Note
Go to the end to download the full example code.
Generative Downscaling#
Generative downscaling over Taiwan using CorrDiff diffusion model.
This example will demonstrate how to user Nvidia’s CorrDiff model, trained for predicting weather over Taiwan, to perform generative downscaling from quarter degree global forecast data to ~3km.
This checkpoint was trained on ERA5 data and WRF data that spans 2018-2021 at one hour time resolution. In this example, we demonstrate an application to GFS data for a typhoon super-resolution from 2023. The model’s performance on GFS data and on data from this year has not been evaluated.
In this example you will learn:
Creating a custom workflow for running CorrDiff inference
Creating a data-source for CorrDiff’s input
Initializing and running CorrDiff diagnostic model
Post-processing results.
# /// script
# dependencies = [
#   "earth2studio[corrdiff] @ git+https://github.com/NVIDIA/earth2studio.git",
#   "cartopy",
# ]
# ///
Creating a Simple CorrDiff Workflow#
As usual, we start with creating a simple workflow to run CorrDiff in. To maximize the
generalization of this workflow, we use dependency injection following the pattern
provided inside earth2studio.run. Since CorrDiff is a diagnostic model, this
workflow won’t predict a time-series, rather just an instantaneous prediction.
For this workflow, we specify
time: Input list of datetimes / strings to run inference for
corrdiff: The initialized CorrDiffTaiwan model
data: Initialized data source to fetch initial conditions from
io: IOBackend
number_of_samples: Number of samples to generate from the model
import os

os.makedirs("outputs", exist_ok=True)
from dotenv import load_dotenv

load_dotenv()  # TODO: make common example prep function

from collections import OrderedDict
from datetime import datetime

import numpy as np
import torch
from loguru import logger

from earth2studio.data import DataSource, prep_data_array
from earth2studio.io import IOBackend
from earth2studio.models.dx import CorrDiffTaiwan
from earth2studio.utils.coords import map_coords, split_coords
from earth2studio.utils.time import to_time_array


def run(
    time: list[str] | list[datetime] | list[np.datetime64],
    corrdiff: CorrDiffTaiwan,
    data: DataSource,
    io: IOBackend,
    number_of_samples: int = 1,
) -> IOBackend:
    """CorrDiff infernce workflow

    Parameters
    ----------
    time : list[str] | list[datetime] | list[np.datetime64]
        List of string, datetimes or np.datetime64
    corrdiff : CorrDiffTaiwan
        CorrDiff mode
    data : DataSource
        Data source
    io : IOBackend
        IO object
    number_of_samples : int, optional
        Number of samples to generate, by default 1

    Returns
    -------
    IOBackend
        Output IO object
    """
    logger.info("Running corrdiff inference!")
    device = torch.device("cuda" if torch.cuda.is_available() else "cpu")
    logger.info(f"Inference device: {device}")

    corrdiff = corrdiff.to(device)
    # Update the number of samples for corrdiff to generate
    corrdiff.number_of_samples = number_of_samples

    # Fetch data from data source and load onto device
    time = to_time_array(time)
    x, coords = prep_data_array(
        data(time, corrdiff.input_coords()["variable"]), device=device
    )
    x, coords = map_coords(x, coords, corrdiff.input_coords())

    logger.success(f"Fetched data from {data.__class__.__name__}")

    # Set up IO backend
    output_coords = corrdiff.output_coords(corrdiff.input_coords())
    total_coords = OrderedDict(
        {
            "time": coords["time"],
            "sample": output_coords["sample"],
            "lat": output_coords["lat"],
            "lon": output_coords["lon"],
        }
    )
    io.add_array(total_coords, output_coords["variable"])

    logger.info("Inference starting!")
    x, coords = corrdiff(x, coords)
    io.write(*split_coords(x, coords))

    logger.success("Inference complete")
    return io
Set Up#
With the workflow defined, the next step is initializing the needed components from Earth-2 studio
It’s clear we need the following:
Diagnostic Model: CorrDiff model for Taiwan
earth2studio.models.dx.CorrDiffTaiwan.Datasource: Pull data from the GFS data api
earth2studio.data.GFS.IO Backend: Save the outputs into a Zarr store
earth2studio.io.ZarrBackend.
from earth2studio.data import GFS
from earth2studio.io import ZarrBackend

# Create CorrDiff model
package = CorrDiffTaiwan.load_default_package()
corrdiff = CorrDiffTaiwan.load_model(package)

# Create the data source
data = GFS()

# Create the IO handler, store in memory
io = ZarrBackend()
Downloading corrdiff_inference_package.zip: 0%|          | 0.00/684M [00:00<?, ?B/s]
Downloading corrdiff_inference_package.zip: 1%|          | 6.37M/684M [00:00<00:10, 66.7MB/s]
Downloading corrdiff_inference_package.zip: 5%|▍         | 33.2M/684M [00:00<00:03, 193MB/s]
Downloading corrdiff_inference_package.zip: 9%|▊         | 58.6M/684M [00:00<00:02, 226MB/s]
Downloading corrdiff_inference_package.zip: 12%|█▏        | 85.4M/684M [00:00<00:02, 247MB/s]
Downloading corrdiff_inference_package.zip: 16%|█▋        | 112M/684M [00:00<00:02, 260MB/s]
Downloading corrdiff_inference_package.zip: 20%|██        | 138M/684M [00:00<00:02, 262MB/s]
Downloading corrdiff_inference_package.zip: 24%|██▍       | 164M/684M [00:00<00:02, 268MB/s]
Downloading corrdiff_inference_package.zip: 28%|██▊       | 190M/684M [00:00<00:01, 269MB/s]
Downloading corrdiff_inference_package.zip: 32%|███▏      | 216M/684M [00:00<00:01, 268MB/s]
Downloading corrdiff_inference_package.zip: 36%|███▌      | 243M/684M [00:01<00:01, 273MB/s]
Downloading corrdiff_inference_package.zip: 39%|███▉      | 270M/684M [00:01<00:01, 274MB/s]
Downloading corrdiff_inference_package.zip: 43%|████▎     | 297M/684M [00:01<00:01, 278MB/s]
Downloading corrdiff_inference_package.zip: 47%|████▋     | 324M/684M [00:01<00:01, 275MB/s]
Downloading corrdiff_inference_package.zip: 51%|█████     | 350M/684M [00:01<00:01, 274MB/s]
Downloading corrdiff_inference_package.zip: 55%|█████▌    | 376M/684M [00:01<00:01, 272MB/s]
Downloading corrdiff_inference_package.zip: 59%|█████▉    | 402M/684M [00:01<00:01, 269MB/s]
Downloading corrdiff_inference_package.zip: 63%|██████▎   | 428M/684M [00:01<00:01, 266MB/s]
Downloading corrdiff_inference_package.zip: 66%|██████▋   | 454M/684M [00:01<00:00, 268MB/s]
Downloading corrdiff_inference_package.zip: 70%|███████   | 481M/684M [00:01<00:00, 273MB/s]
Downloading corrdiff_inference_package.zip: 74%|███████▍  | 507M/684M [00:02<00:00, 273MB/s]
Downloading corrdiff_inference_package.zip: 78%|███████▊  | 534M/684M [00:02<00:00, 273MB/s]
Downloading corrdiff_inference_package.zip: 82%|████████▏ | 561M/684M [00:02<00:00, 276MB/s]
Downloading corrdiff_inference_package.zip: 86%|████████▌ | 587M/684M [00:02<00:00, 267MB/s]
Downloading corrdiff_inference_package.zip: 90%|████████▉ | 612M/684M [00:02<00:00, 267MB/s]
Downloading corrdiff_inference_package.zip: 93%|█████████▎| 638M/684M [00:02<00:00, 268MB/s]
Downloading corrdiff_inference_package.zip: 97%|█████████▋| 665M/684M [00:02<00:00, 270MB/s]
Downloading corrdiff_inference_package.zip: 100%|██████████| 684M/684M [00:02<00:00, 265MB/s]
Execute the Workflow#
With all components initialized, running the workflow is a single line of Python code. Workflow will return the provided IO object back to the user, which can be used to then post process. Some have additional APIs that can be handy for post-processing or saving to file. Check the API docs for more information.
For the inference we will predict 1 sample for a particular timestamp representing Typhoon Koinu.
io = run(["2023-10-04T18:00:00"], corrdiff, data, io, number_of_samples=1)
2026-01-22 19:31:39.577 | INFO     | __main__:run:114 - Running corrdiff inference!
2026-01-22 19:31:39.578 | INFO     | __main__:run:116 - Inference device: cuda

Fetching GFS data:   0%|          | 0/12 [00:00<?, ?it/s]

2026-01-22 19:31:40.509 | DEBUG    | earth2studio.data.gfs:fetch_array:382 - Fetching GFS grib file: noaa-gfs-bdp-pds/gfs.20231004/18/atmos/gfs.t18z.pgrb2.0p25.f000 418951103-1205697

Fetching GFS data:   0%|          | 0/12 [00:00<?, ?it/s]

2026-01-22 19:31:40.512 | DEBUG    | earth2studio.data.gfs:fetch_array:382 - Fetching GFS grib file: noaa-gfs-bdp-pds/gfs.20231004/18/atmos/gfs.t18z.pgrb2.0p25.f000 407465443-514270

Fetching GFS data:   0%|          | 0/12 [00:00<?, ?it/s]

2026-01-22 19:31:40.514 | DEBUG    | earth2studio.data.gfs:fetch_array:382 - Fetching GFS grib file: noaa-gfs-bdp-pds/gfs.20231004/18/atmos/gfs.t18z.pgrb2.0p25.f000 258060355-819591

Fetching GFS data:   0%|          | 0/12 [00:00<?, ?it/s]

2026-01-22 19:31:40.515 | DEBUG    | earth2studio.data.gfs:fetch_array:382 - Fetching GFS grib file: noaa-gfs-bdp-pds/gfs.20231004/18/atmos/gfs.t18z.pgrb2.0p25.f000 258879946-735487

Fetching GFS data:   0%|          | 0/12 [00:00<?, ?it/s]

2026-01-22 19:31:40.517 | DEBUG    | earth2studio.data.gfs:fetch_array:382 - Fetching GFS grib file: noaa-gfs-bdp-pds/gfs.20231004/18/atmos/gfs.t18z.pgrb2.0p25.f000 337303053-570645

Fetching GFS data:   0%|          | 0/12 [00:00<?, ?it/s]

2026-01-22 19:31:40.519 | DEBUG    | earth2studio.data.gfs:fetch_array:382 - Fetching GFS grib file: noaa-gfs-bdp-pds/gfs.20231004/18/atmos/gfs.t18z.pgrb2.0p25.f000 264233423-556738

Fetching GFS data:   0%|          | 0/12 [00:00<?, ?it/s]

2026-01-22 19:31:40.521 | DEBUG    | earth2studio.data.gfs:fetch_array:382 - Fetching GFS grib file: noaa-gfs-bdp-pds/gfs.20231004/18/atmos/gfs.t18z.pgrb2.0p25.f000 337873698-579539

Fetching GFS data:   0%|          | 0/12 [00:00<?, ?it/s]

2026-01-22 19:31:40.523 | DEBUG    | earth2studio.data.gfs:fetch_array:382 - Fetching GFS grib file: noaa-gfs-bdp-pds/gfs.20231004/18/atmos/gfs.t18z.pgrb2.0p25.f000 411076281-975703

Fetching GFS data:   0%|          | 0/12 [00:00<?, ?it/s]

2026-01-22 19:31:40.525 | DEBUG    | earth2studio.data.gfs:fetch_array:382 - Fetching GFS grib file: noaa-gfs-bdp-pds/gfs.20231004/18/atmos/gfs.t18z.pgrb2.0p25.f000 331406077-849817

Fetching GFS data:   0%|          | 0/12 [00:00<?, ?it/s]

2026-01-22 19:31:40.526 | DEBUG    | earth2studio.data.gfs:fetch_array:382 - Fetching GFS grib file: noaa-gfs-bdp-pds/gfs.20231004/18/atmos/gfs.t18z.pgrb2.0p25.f000 412051984-953804

Fetching GFS data:   0%|          | 0/12 [00:00<?, ?it/s]

2026-01-22 19:31:40.528 | DEBUG    | earth2studio.data.gfs:fetch_array:382 - Fetching GFS grib file: noaa-gfs-bdp-pds/gfs.20231004/18/atmos/gfs.t18z.pgrb2.0p25.f000 264790161-556189

Fetching GFS data:   0%|          | 0/12 [00:00<?, ?it/s]

2026-01-22 19:31:40.530 | DEBUG    | earth2studio.data.gfs:fetch_array:382 - Fetching GFS grib file: noaa-gfs-bdp-pds/gfs.20231004/18/atmos/gfs.t18z.pgrb2.0p25.f000 330494443-911634

Fetching GFS data:   0%|          | 0/12 [00:00<?, ?it/s]
Fetching GFS data:   8%|▊         | 1/12 [00:00<00:07,  1.43it/s]
Fetching GFS data:  17%|█▋        | 2/12 [00:00<00:04,  2.44it/s]
Fetching GFS data:  42%|████▏     | 5/12 [00:01<00:01,  6.02it/s]
Fetching GFS data:  50%|█████     | 6/12 [00:01<00:01,  3.18it/s]
Fetching GFS data:  58%|█████▊    | 7/12 [00:02<00:01,  3.02it/s]
Fetching GFS data:  67%|██████▋   | 8/12 [00:02<00:01,  2.53it/s]
Fetching GFS data:  75%|███████▌  | 9/12 [00:03<00:01,  2.65it/s]
Fetching GFS data:  83%|████████▎ | 10/12 [00:03<00:00,  2.66it/s]
Fetching GFS data:  92%|█████████▏| 11/12 [00:04<00:00,  1.43it/s]
Fetching GFS data: 100%|██████████| 12/12 [00:05<00:00,  1.72it/s]
Fetching GFS data: 100%|██████████| 12/12 [00:05<00:00,  2.27it/s]
2026-01-22 19:31:45.825 | SUCCESS  | __main__:run:129 - Fetched data from GFS
2026-01-22 19:31:45.846 | INFO     | __main__:run:143 - Inference starting!
2026-01-22 19:31:47.668 | SUCCESS  | __main__:run:147 - Inference complete
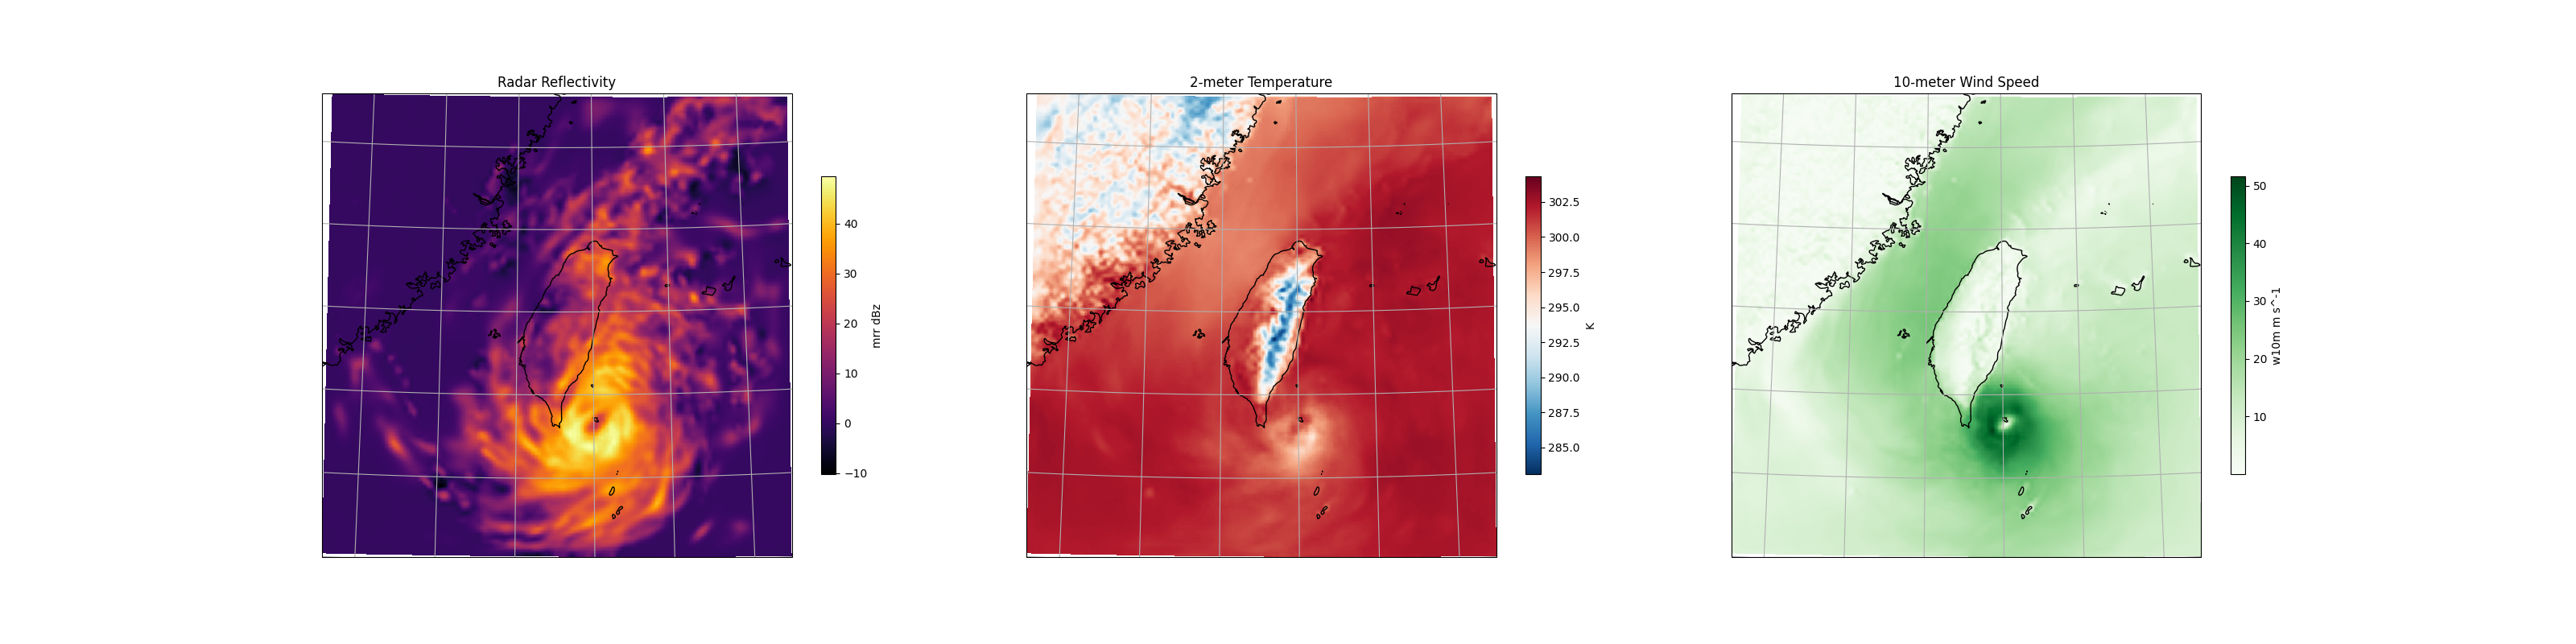
Post Processing#
The last step is to post process our results. Cartopy is a great library for plotting fields on projections of a sphere.
Notice that the Zarr IO function has additional APIs to interact with the stored data.
import cartopy.crs as ccrs
import matplotlib.pyplot as plt

projection = ccrs.LambertConformal(
    central_longitude=io["lon"][:].mean(),
)

fig = plt.figure(figsize=(4 * 8, 8))

ax0 = fig.add_subplot(1, 3, 1, projection=projection)
c = ax0.pcolormesh(
    io["lon"],
    io["lat"],
    io["mrr"][0, 0],
    transform=ccrs.PlateCarree(),
    cmap="inferno",
)
plt.colorbar(c, ax=ax0, shrink=0.6, label="mrr dBz")
ax0.coastlines()
ax0.gridlines()
ax0.set_title("Radar Reflectivity")

ax1 = fig.add_subplot(1, 3, 2, projection=projection)
c = ax1.pcolormesh(
    io["lon"],
    io["lat"],
    io["t2m"][0, 0],
    transform=ccrs.PlateCarree(),
    cmap="RdBu_r",
)
plt.colorbar(c, ax=ax1, shrink=0.6, label="K")
ax1.coastlines()
ax1.gridlines()
ax1.set_title("2-meter Temperature")

ax2 = fig.add_subplot(1, 3, 3, projection=projection)
c = ax2.pcolormesh(
    io["lon"],
    io["lat"],
    np.sqrt(io["u10m"][0, 0] ** 2 + io["v10m"][0, 0] ** 2),
    transform=ccrs.PlateCarree(),
    cmap="Greens",
)
plt.colorbar(c, ax=ax2, shrink=0.6, label="w10m m s^-1")
ax2.coastlines()
ax2.gridlines()
ax2.set_title("10-meter Wind Speed")

plt.savefig("outputs/04_corr_diff_prediction.jpg")
Total running time of the script: (0 minutes 24.550 seconds)