DFT-D3 Dispersion Benchmarks#
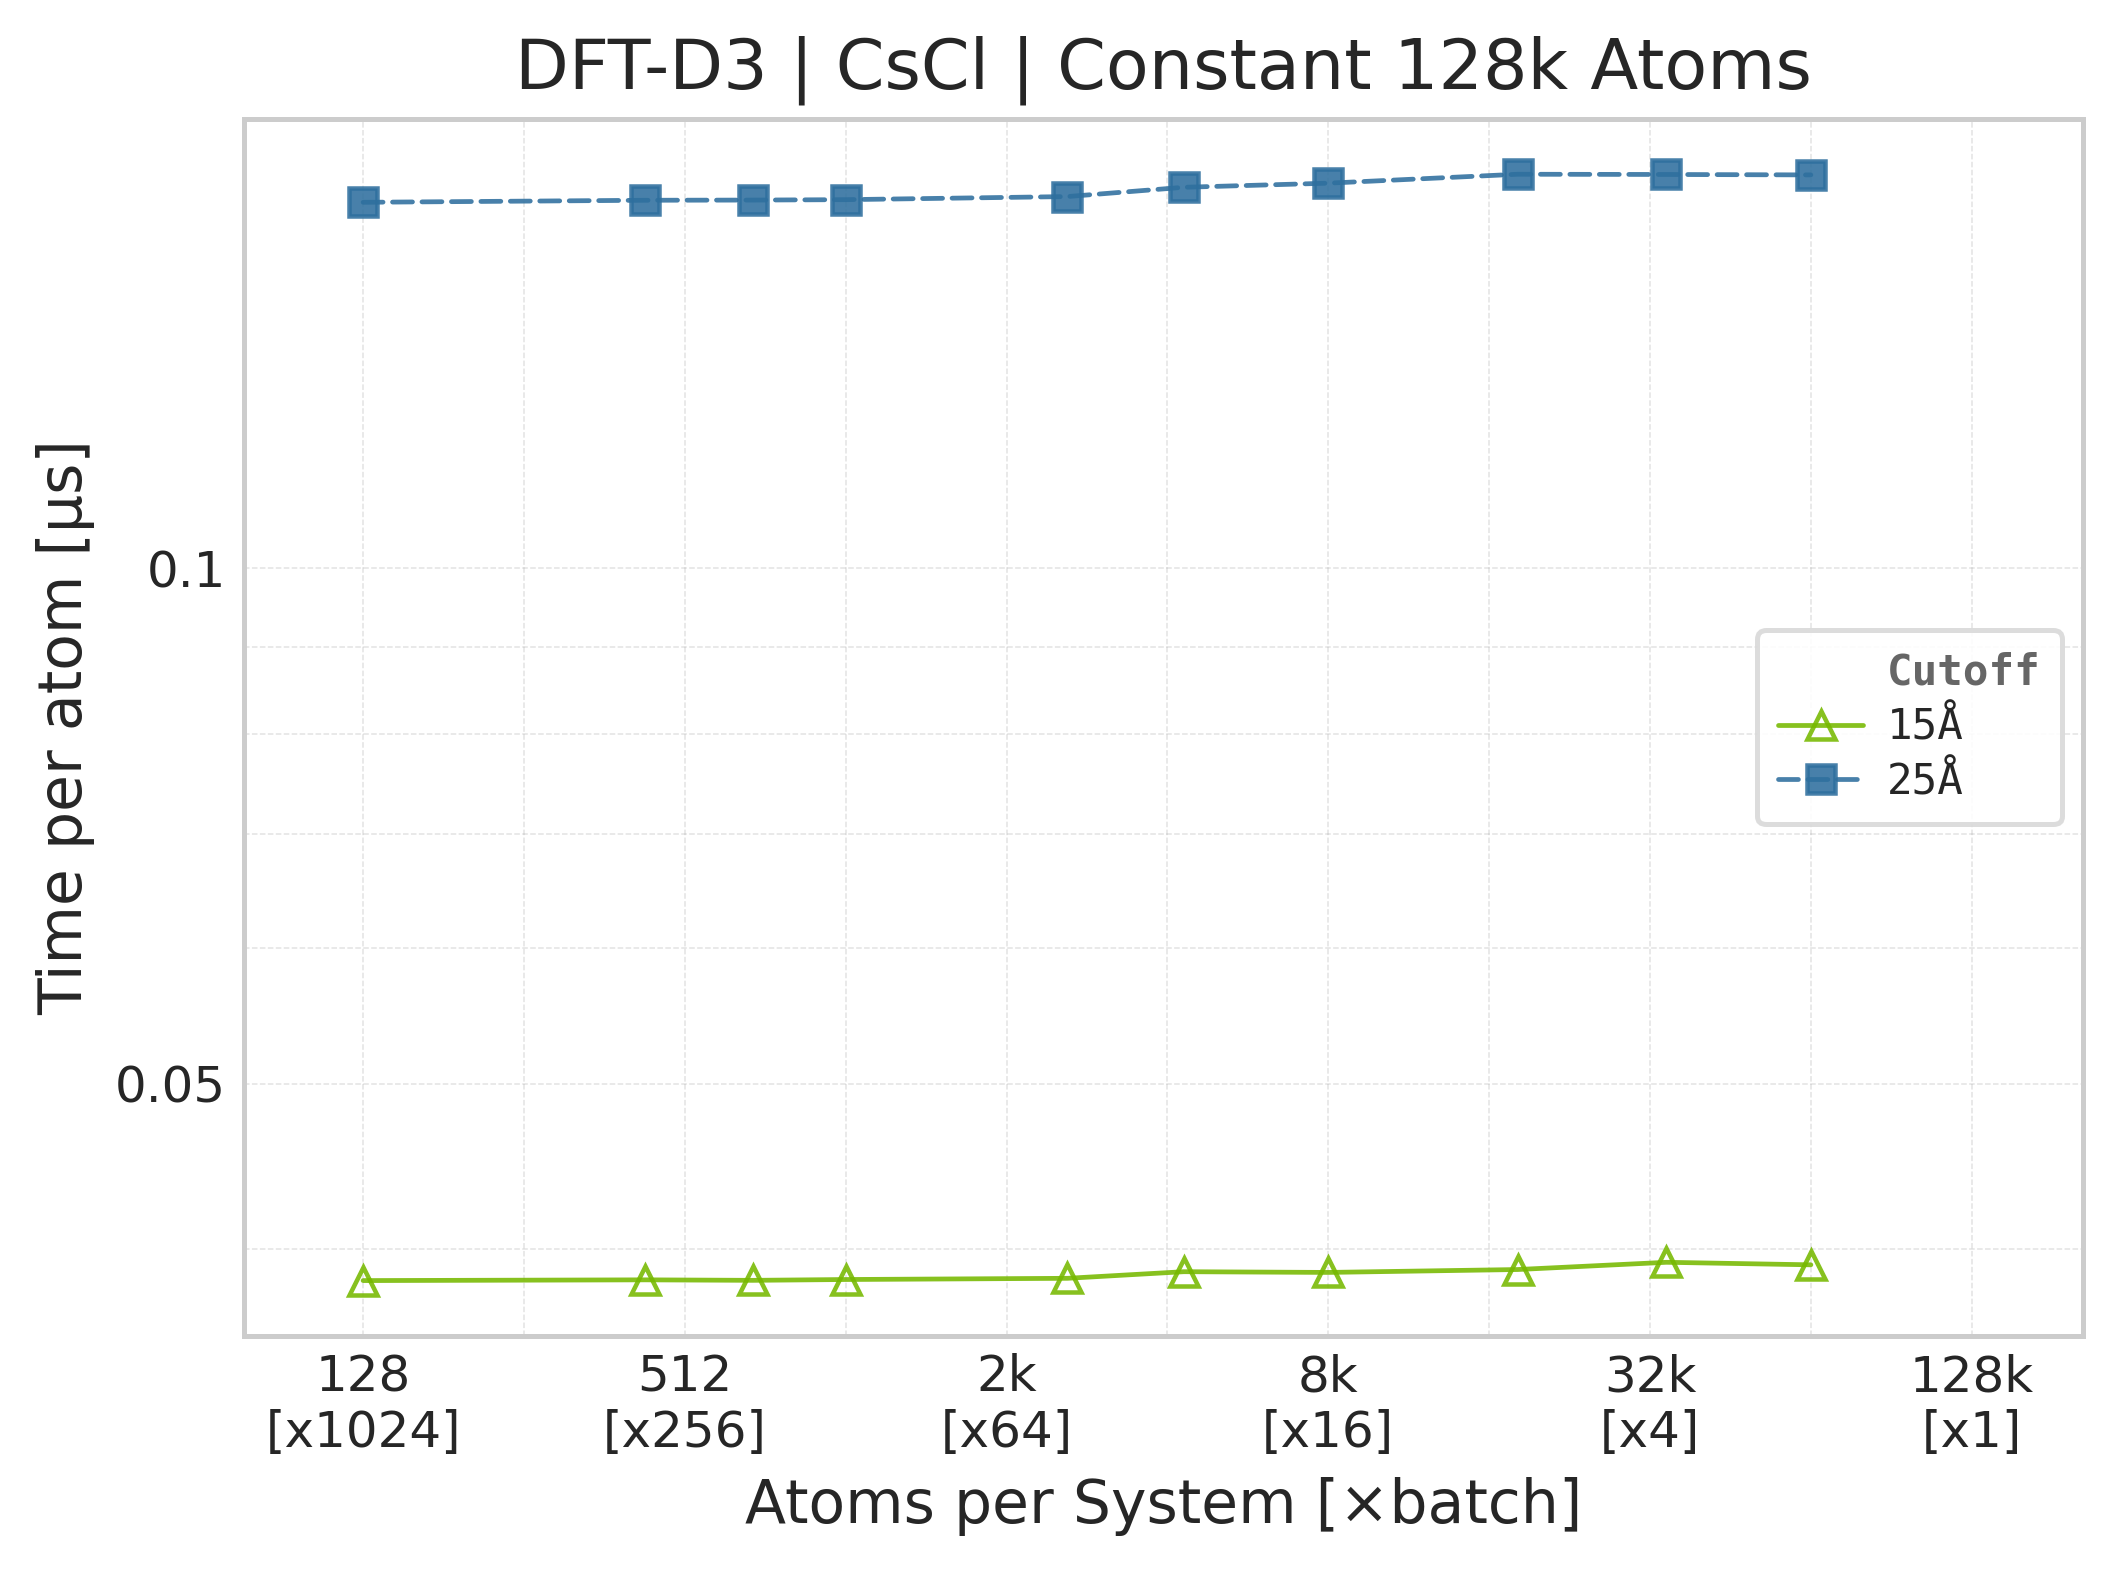
Performance benchmarks for DFT-D3 dispersion corrections in ALCHEMI Toolkit-Ops. Results show scaling behaviour with increasing system size for periodic systems, including both single-system and batched computations.
Warning
These results are intended to be indicative only: your actual performance may vary depending on the atomic system topology, software and hardware configuration and we encourage users to benchmark on their own systems of interest.
How to Read These Charts#
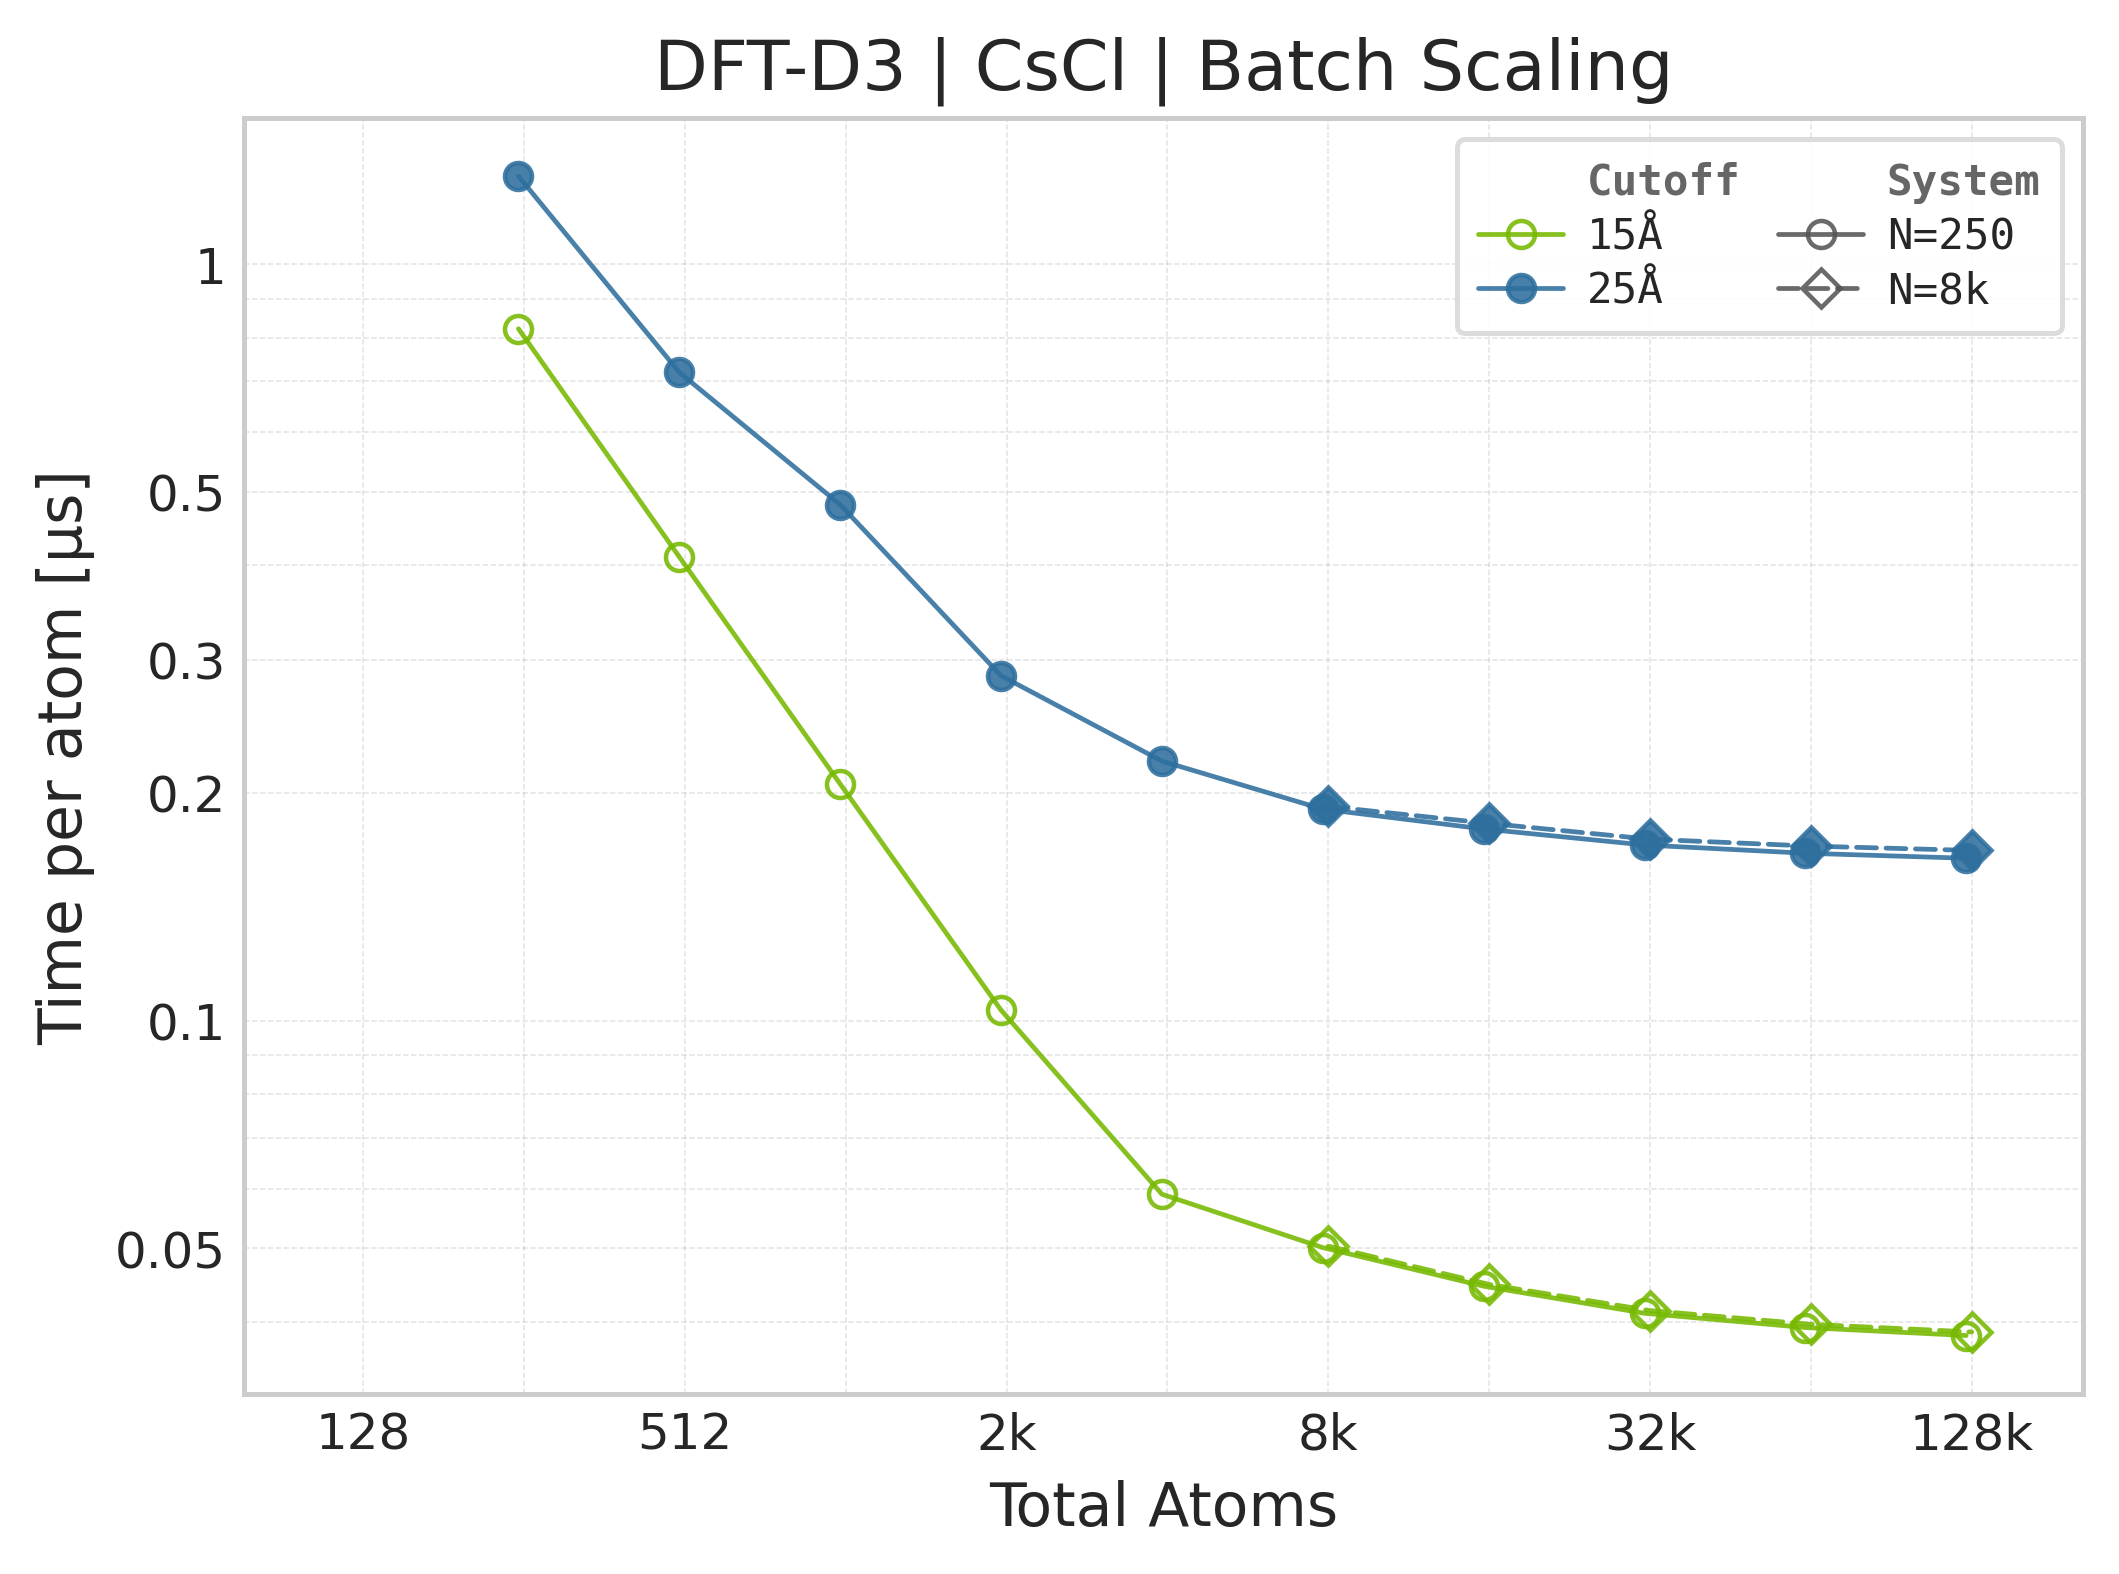
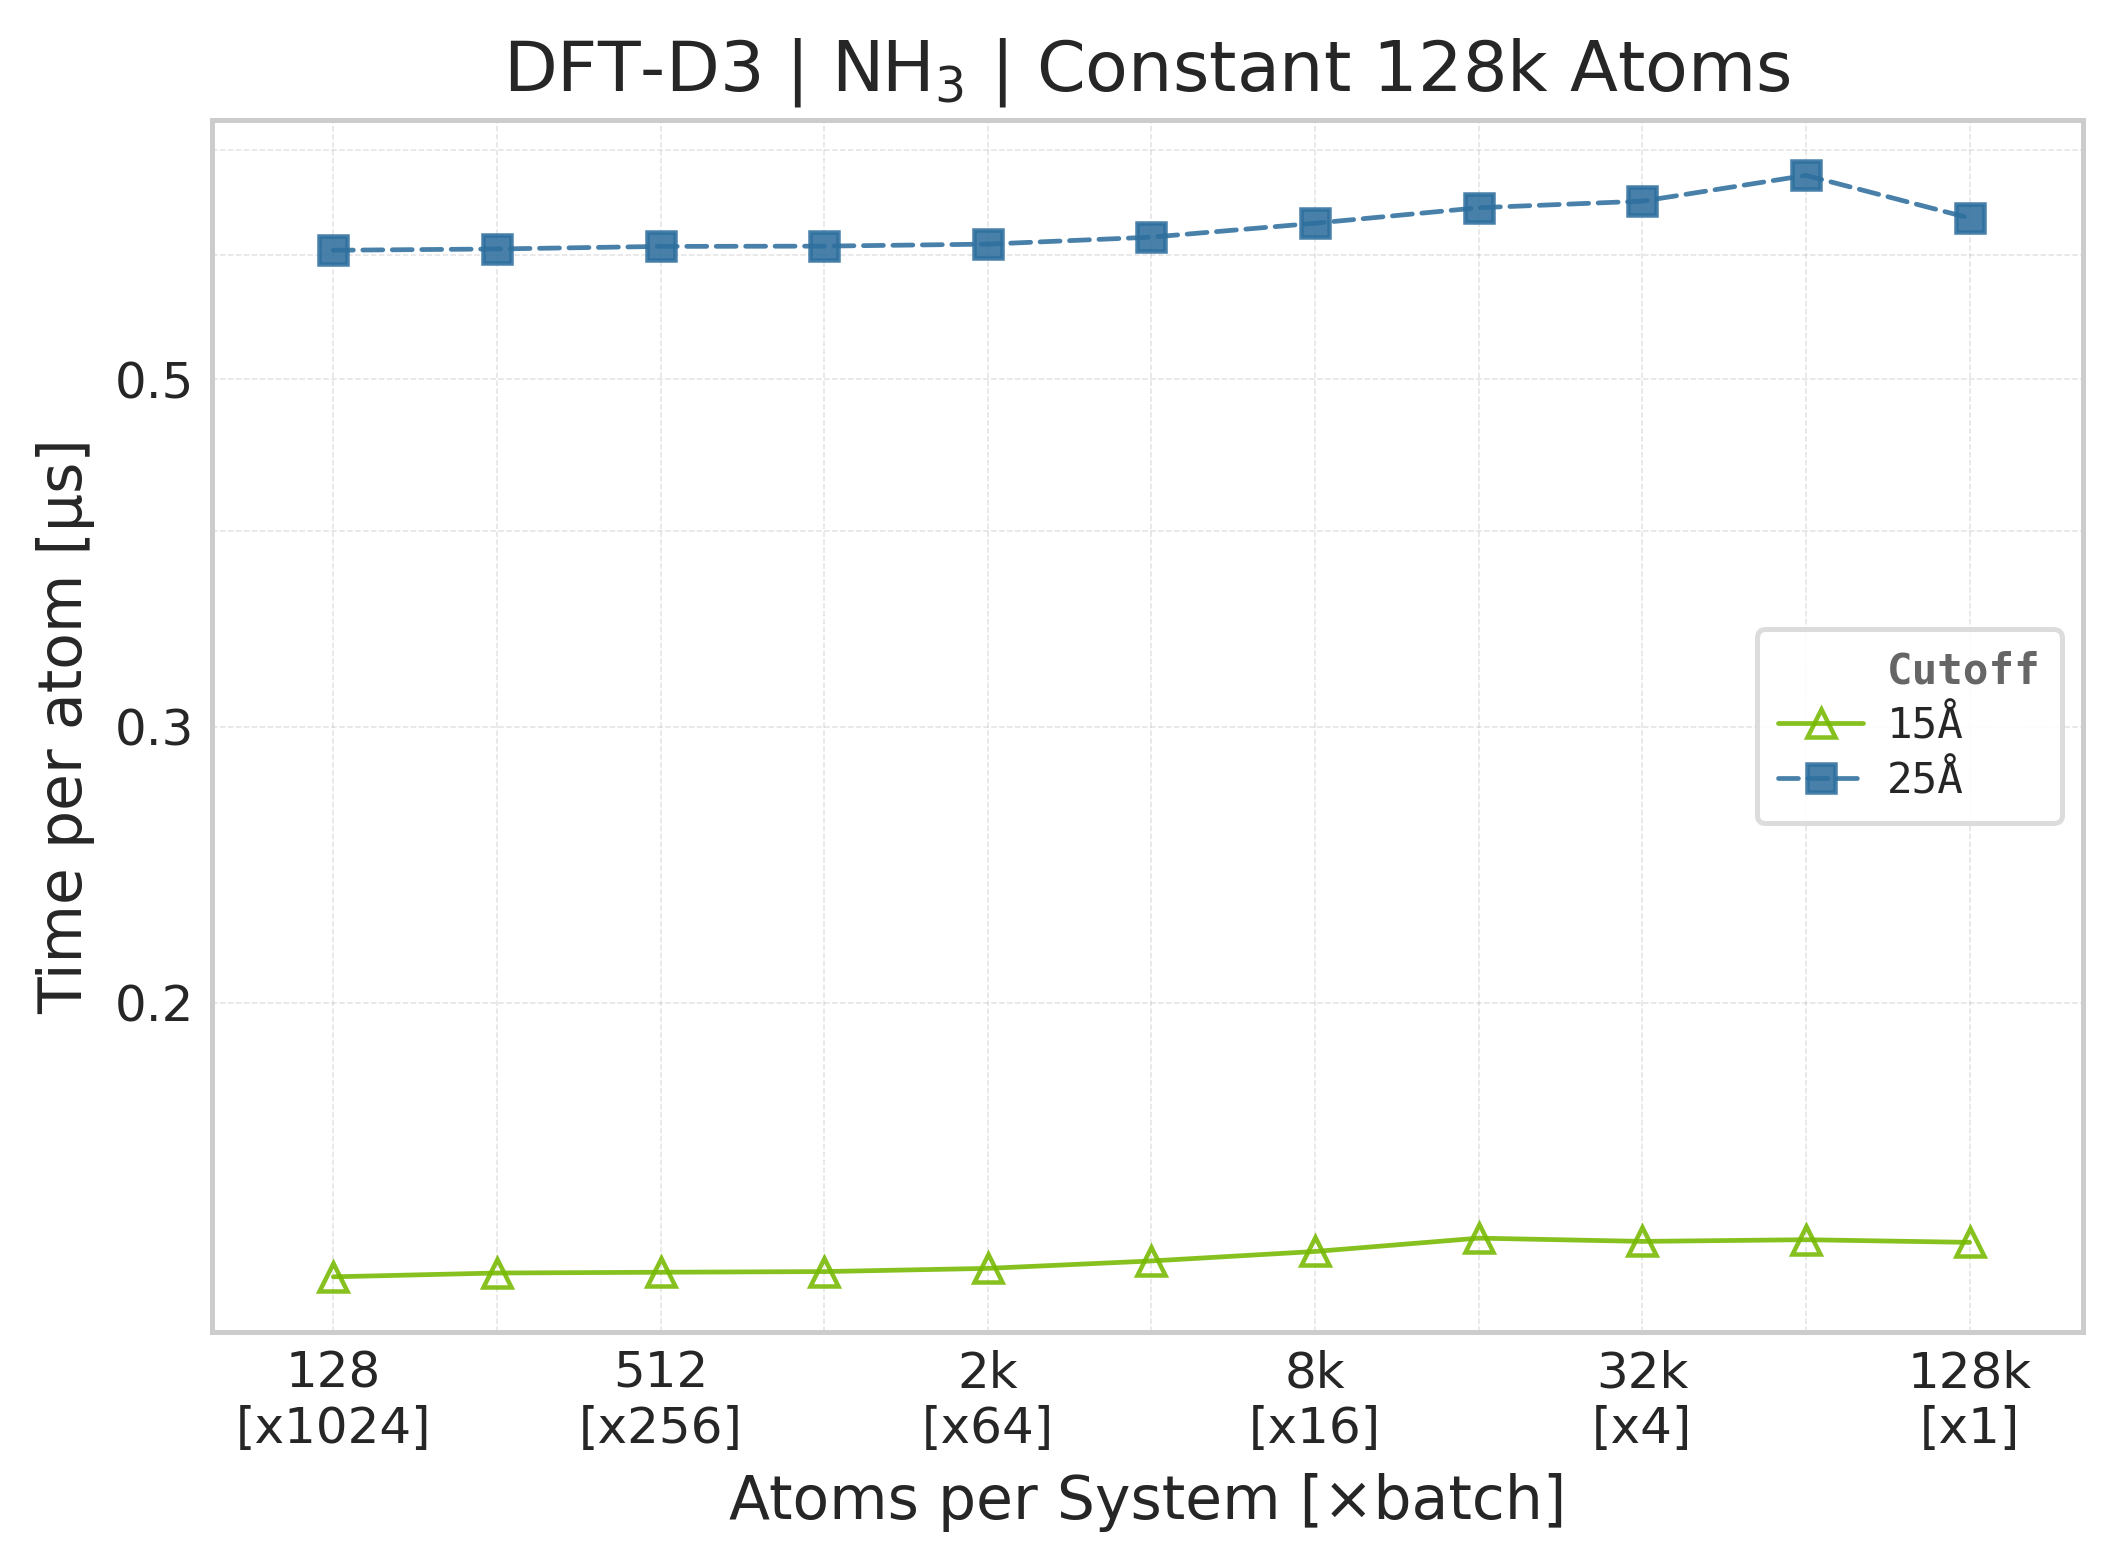
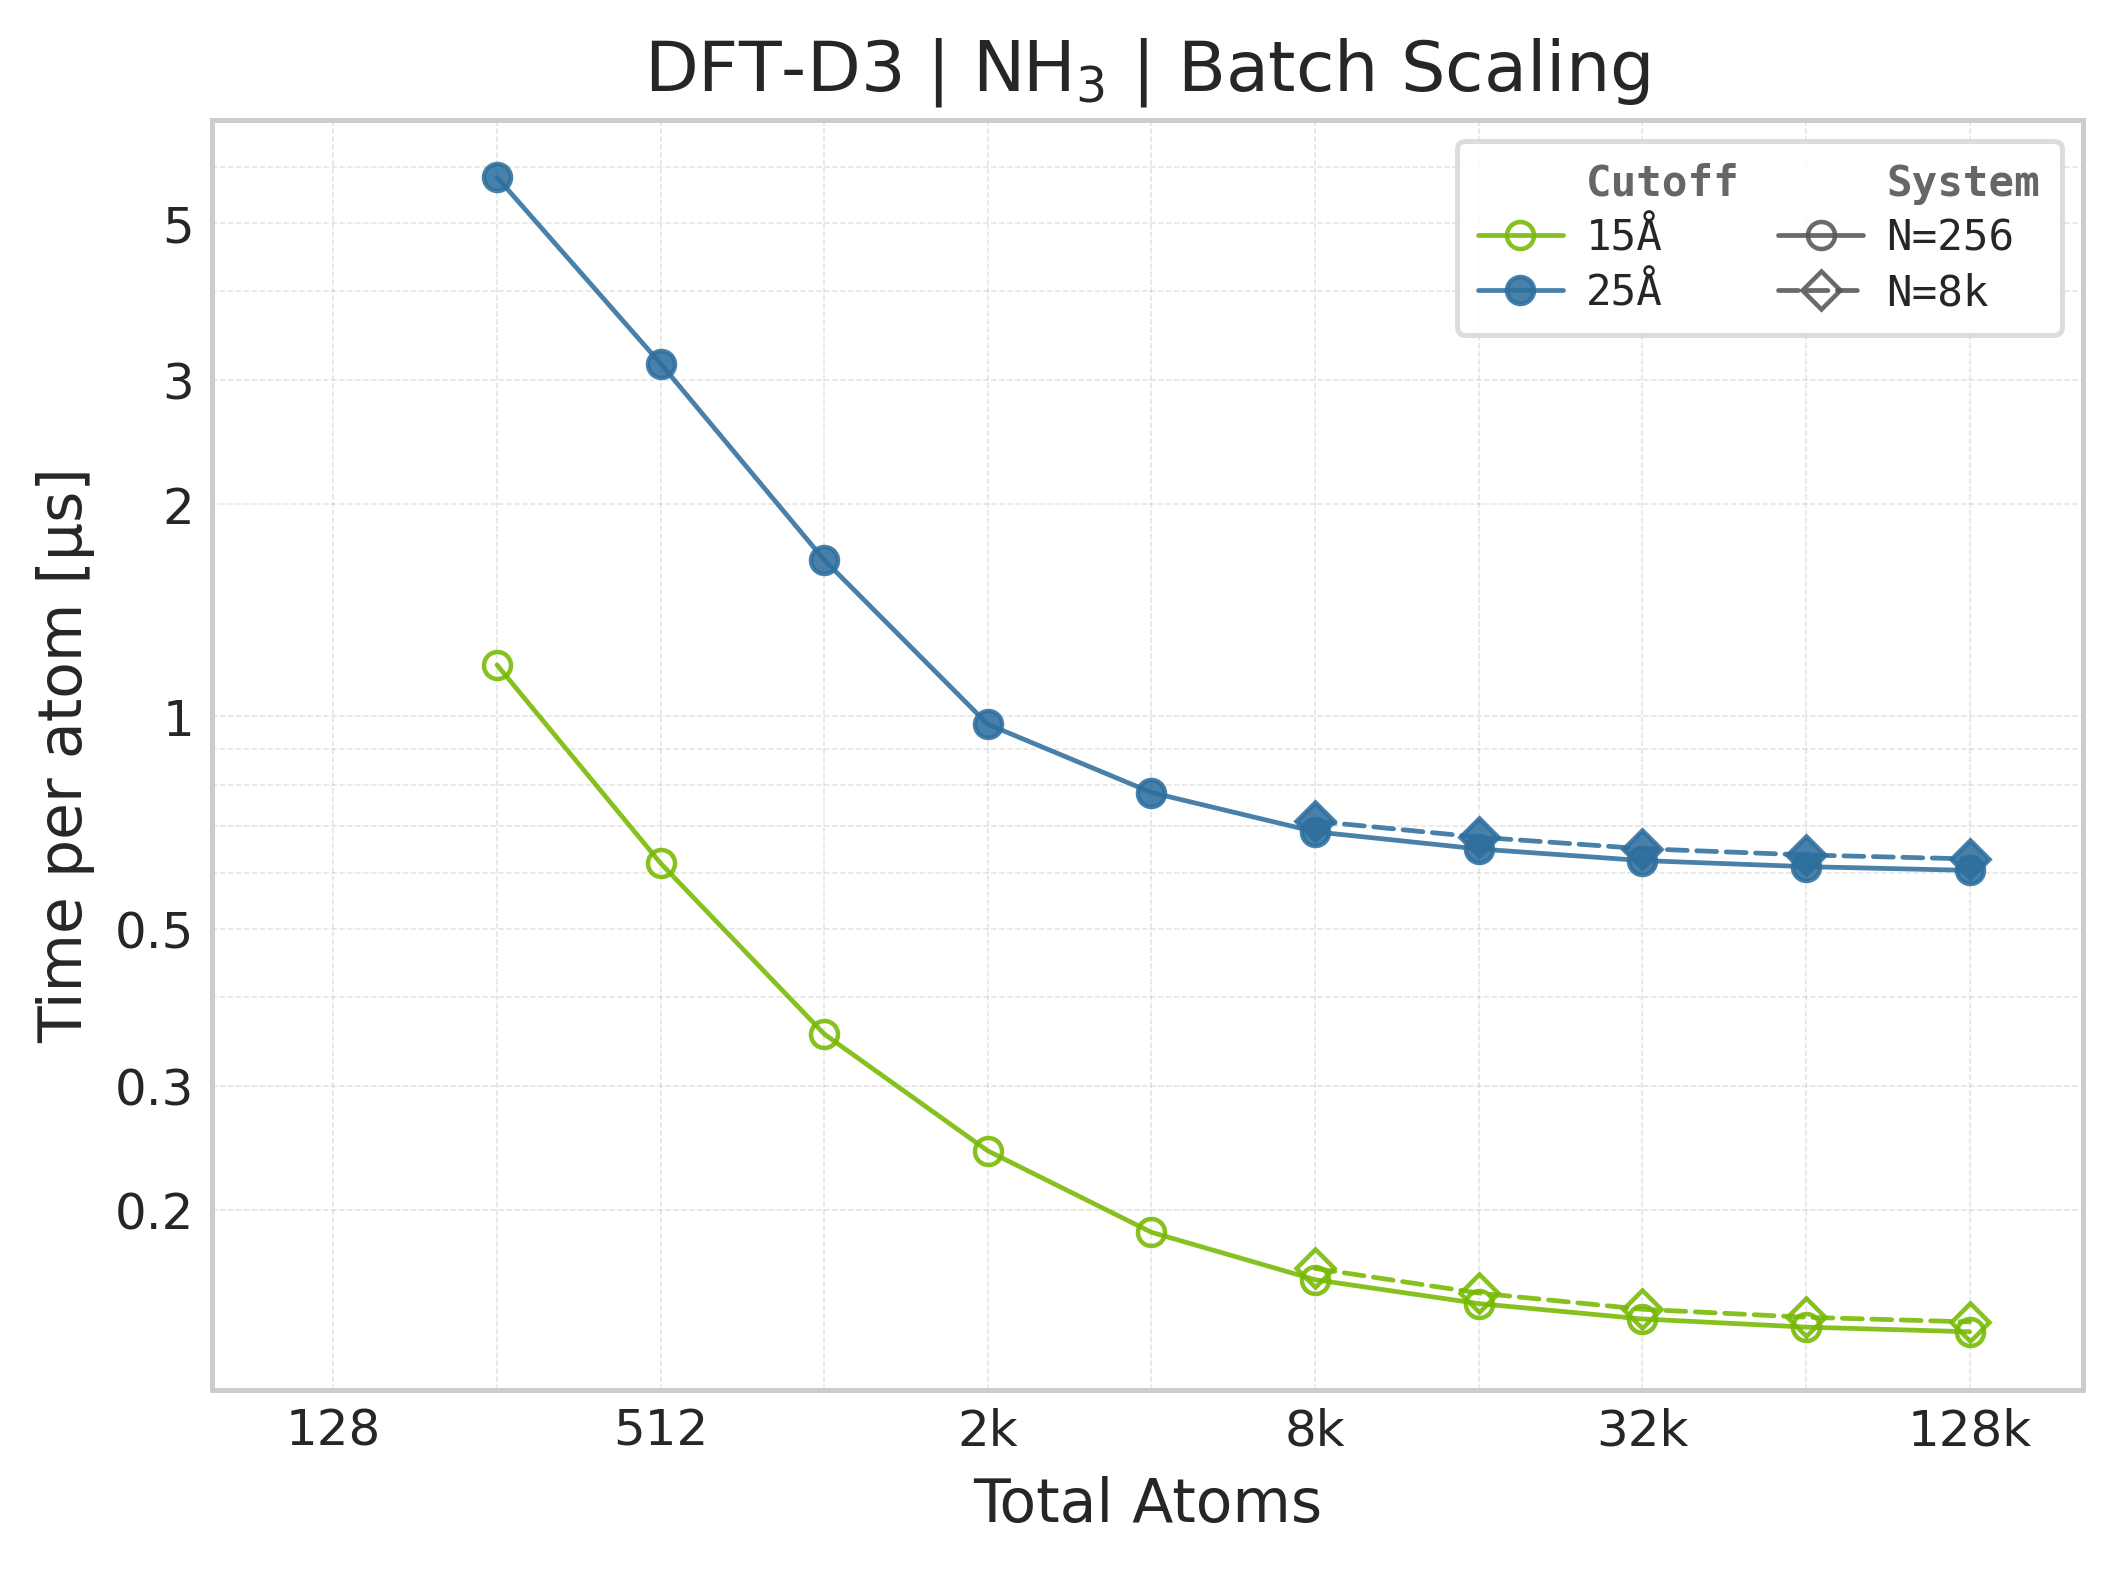
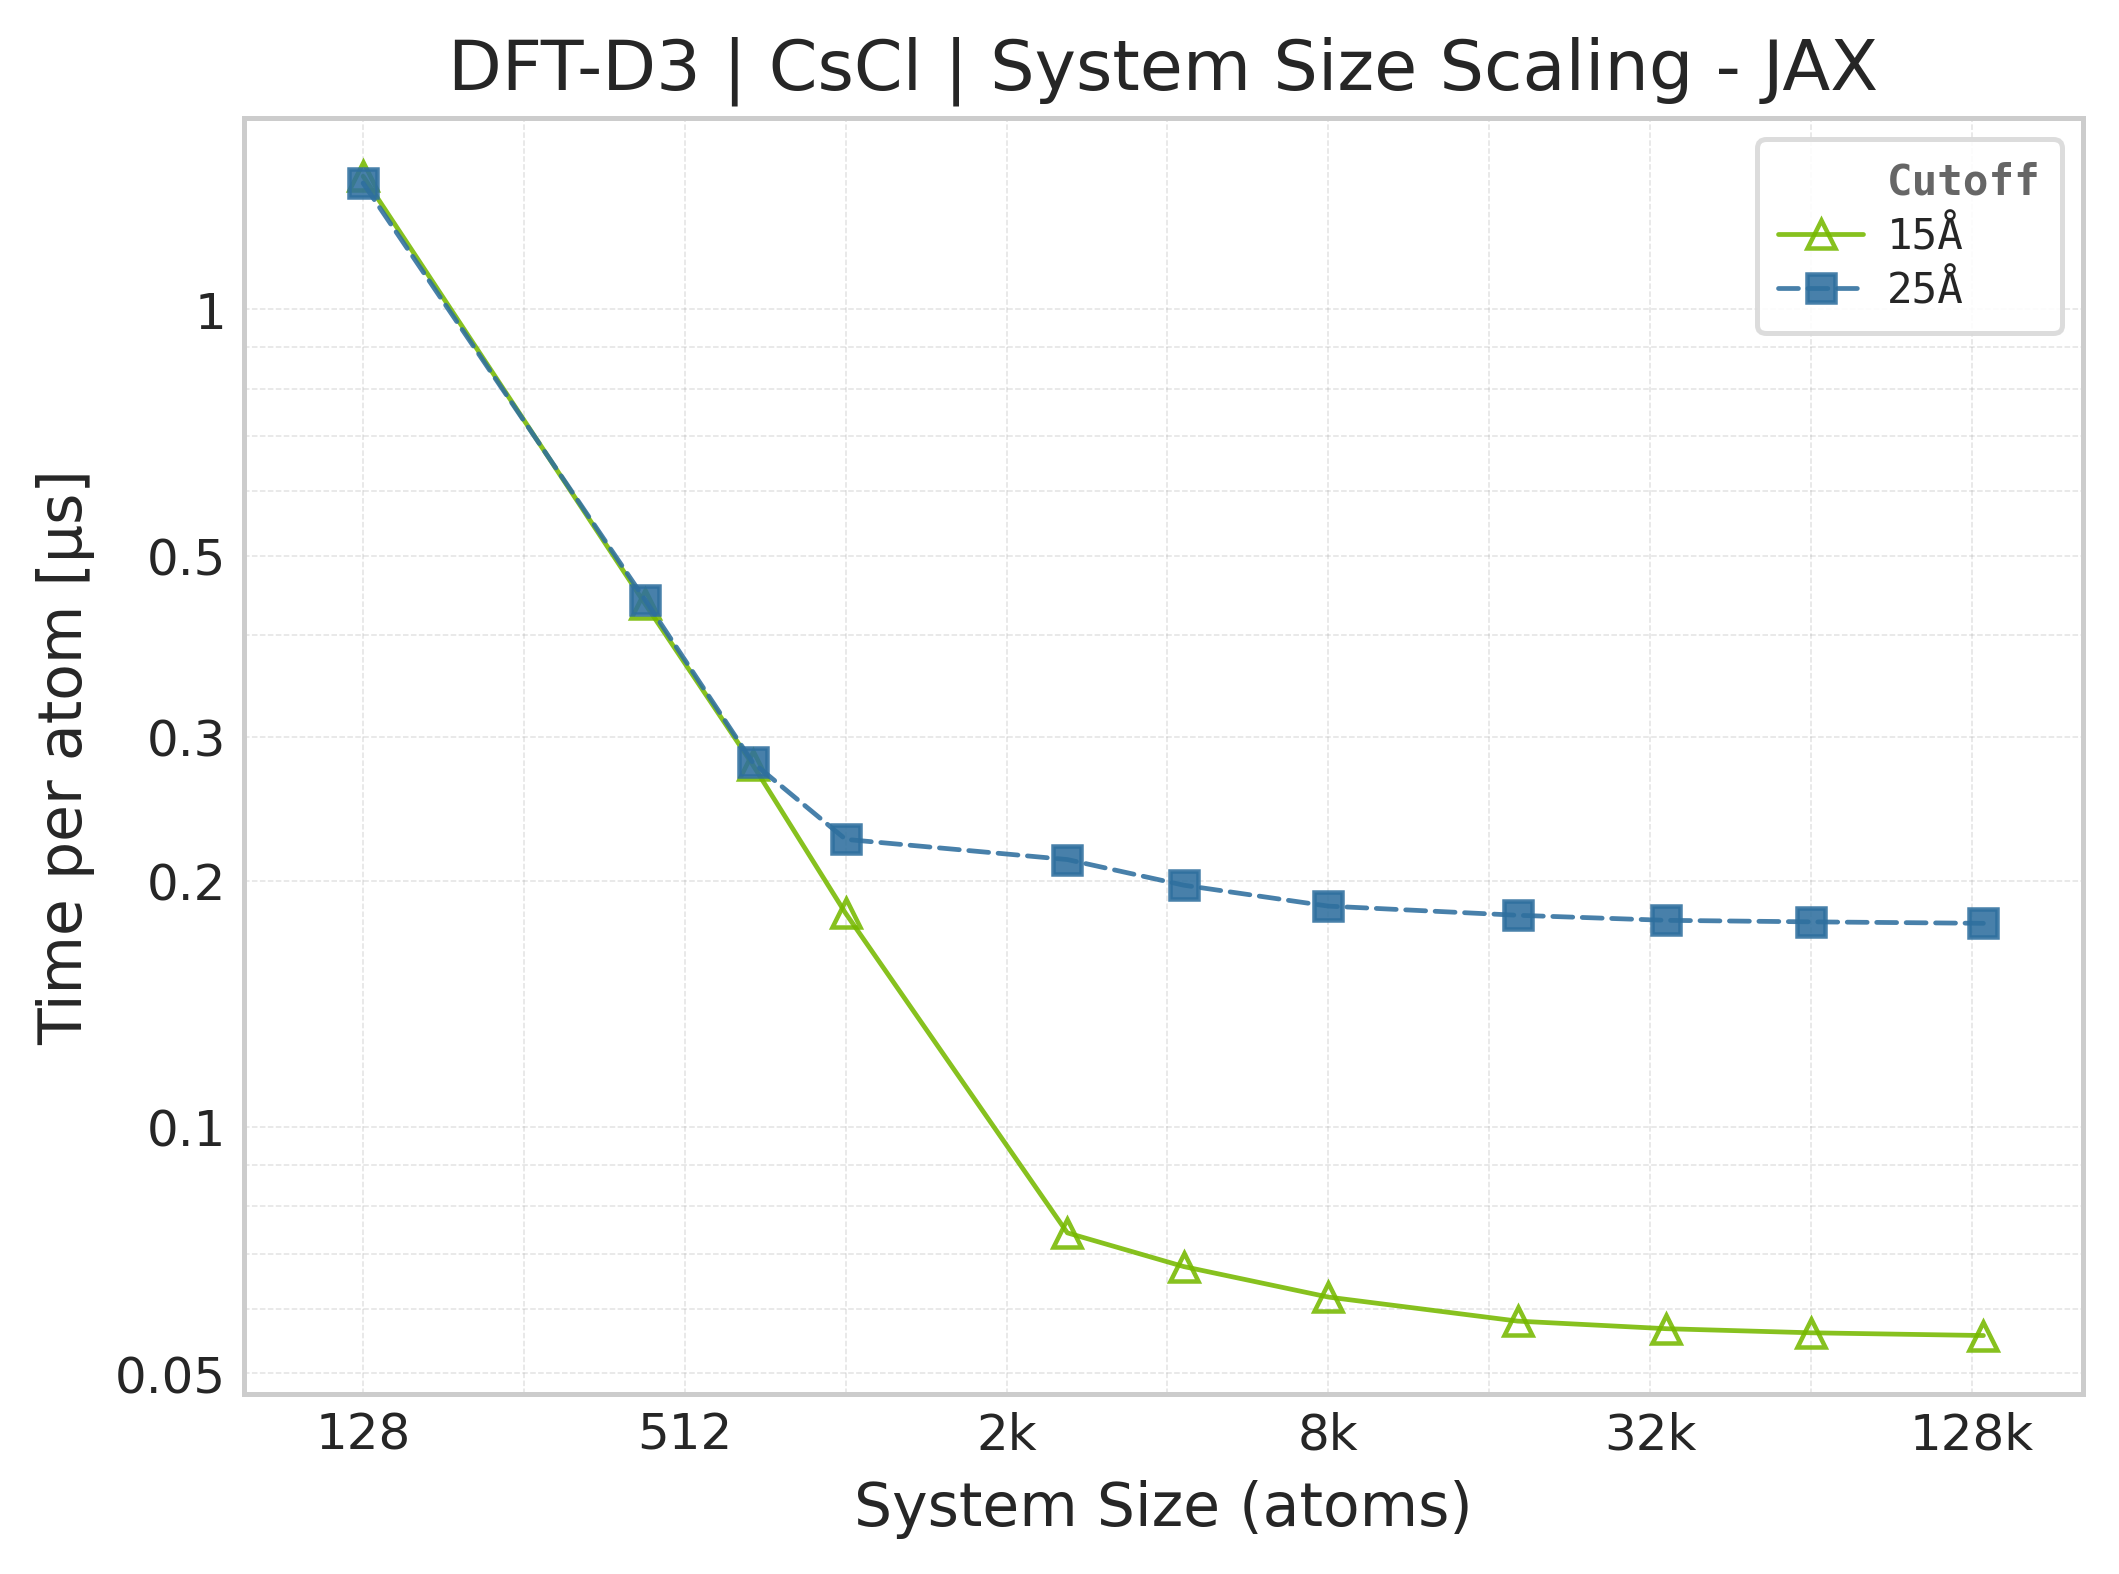
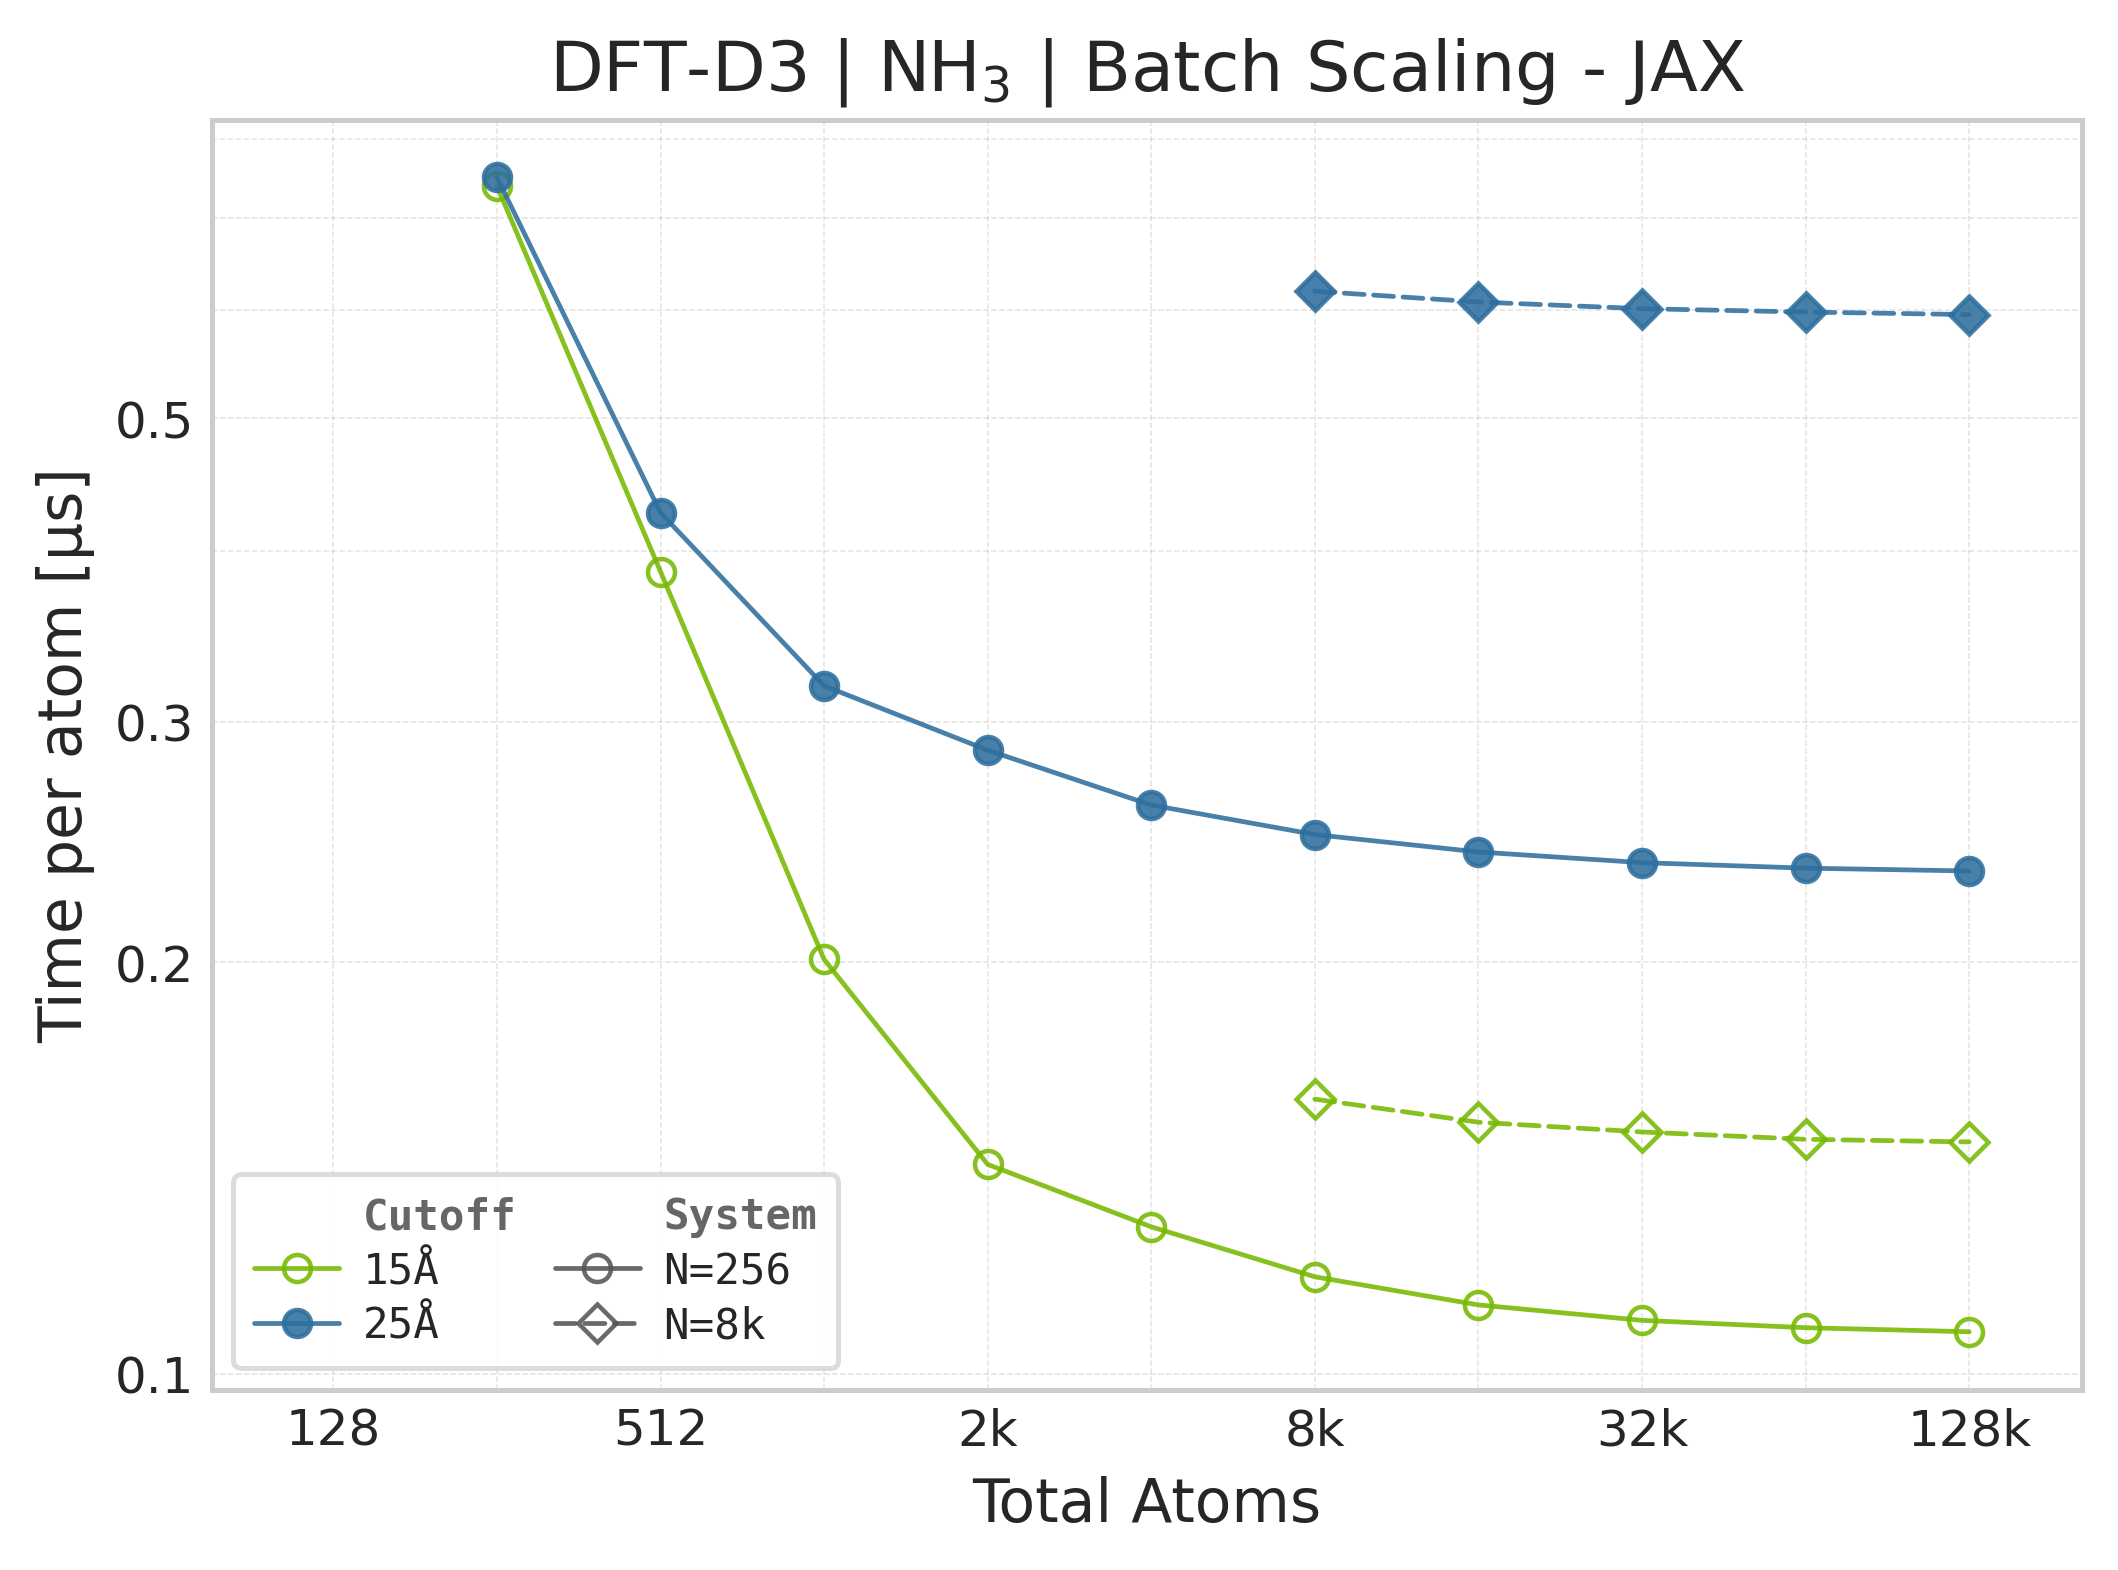
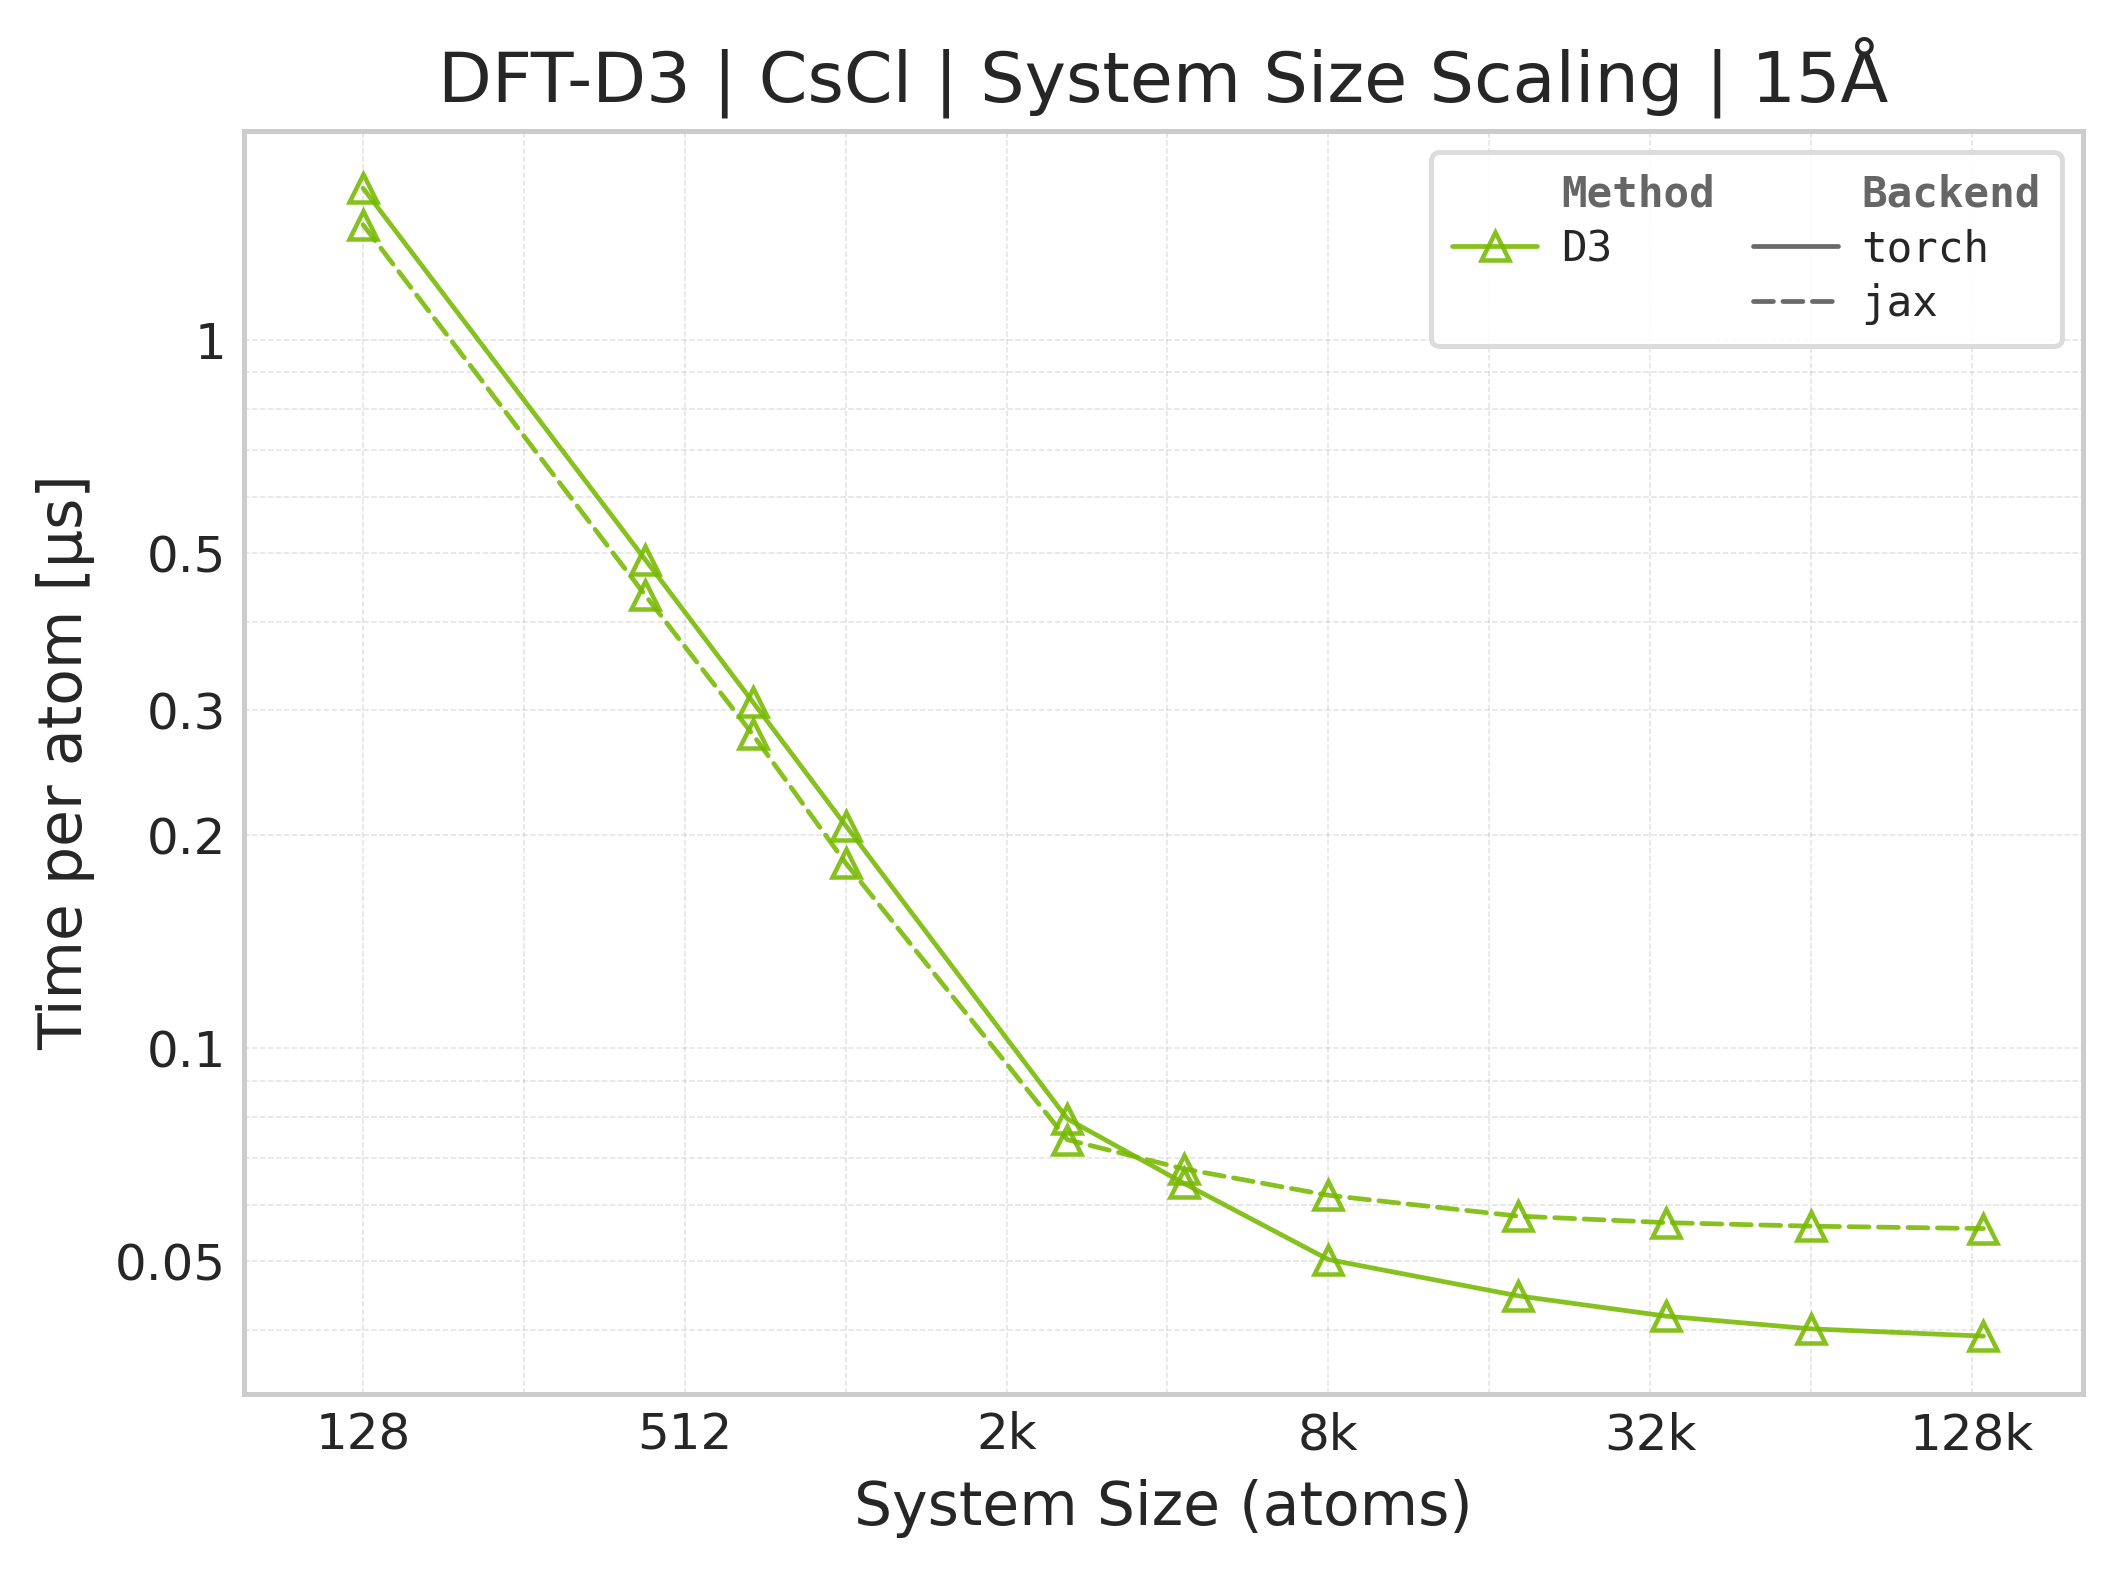
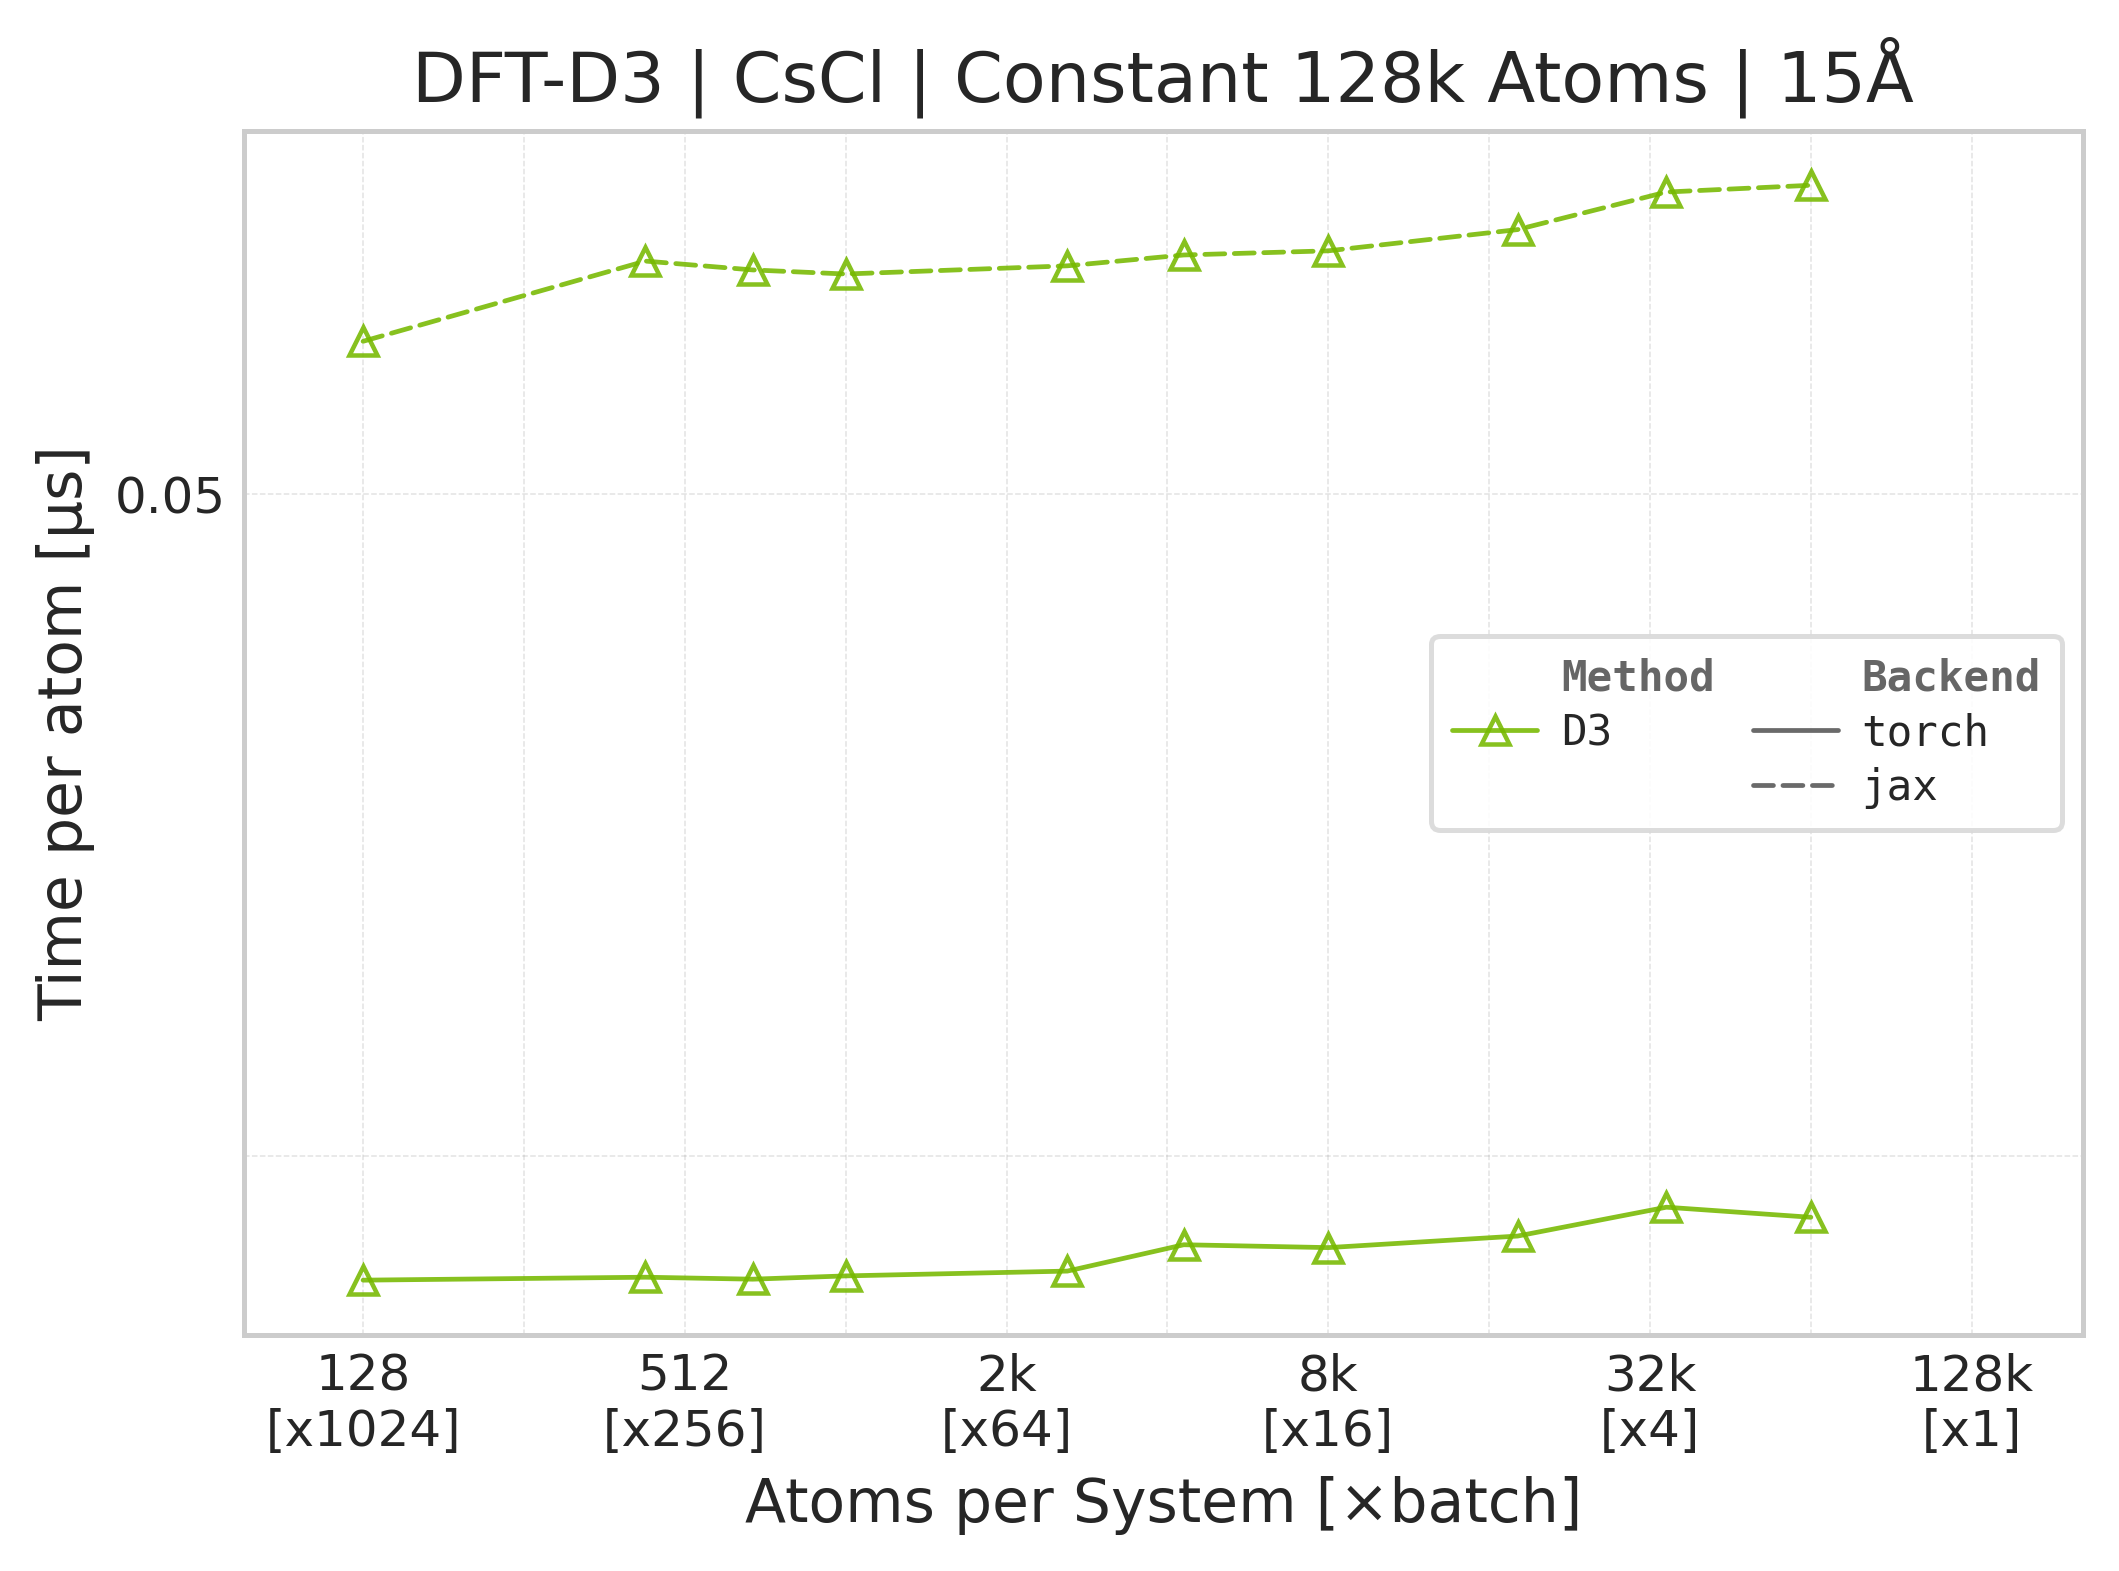
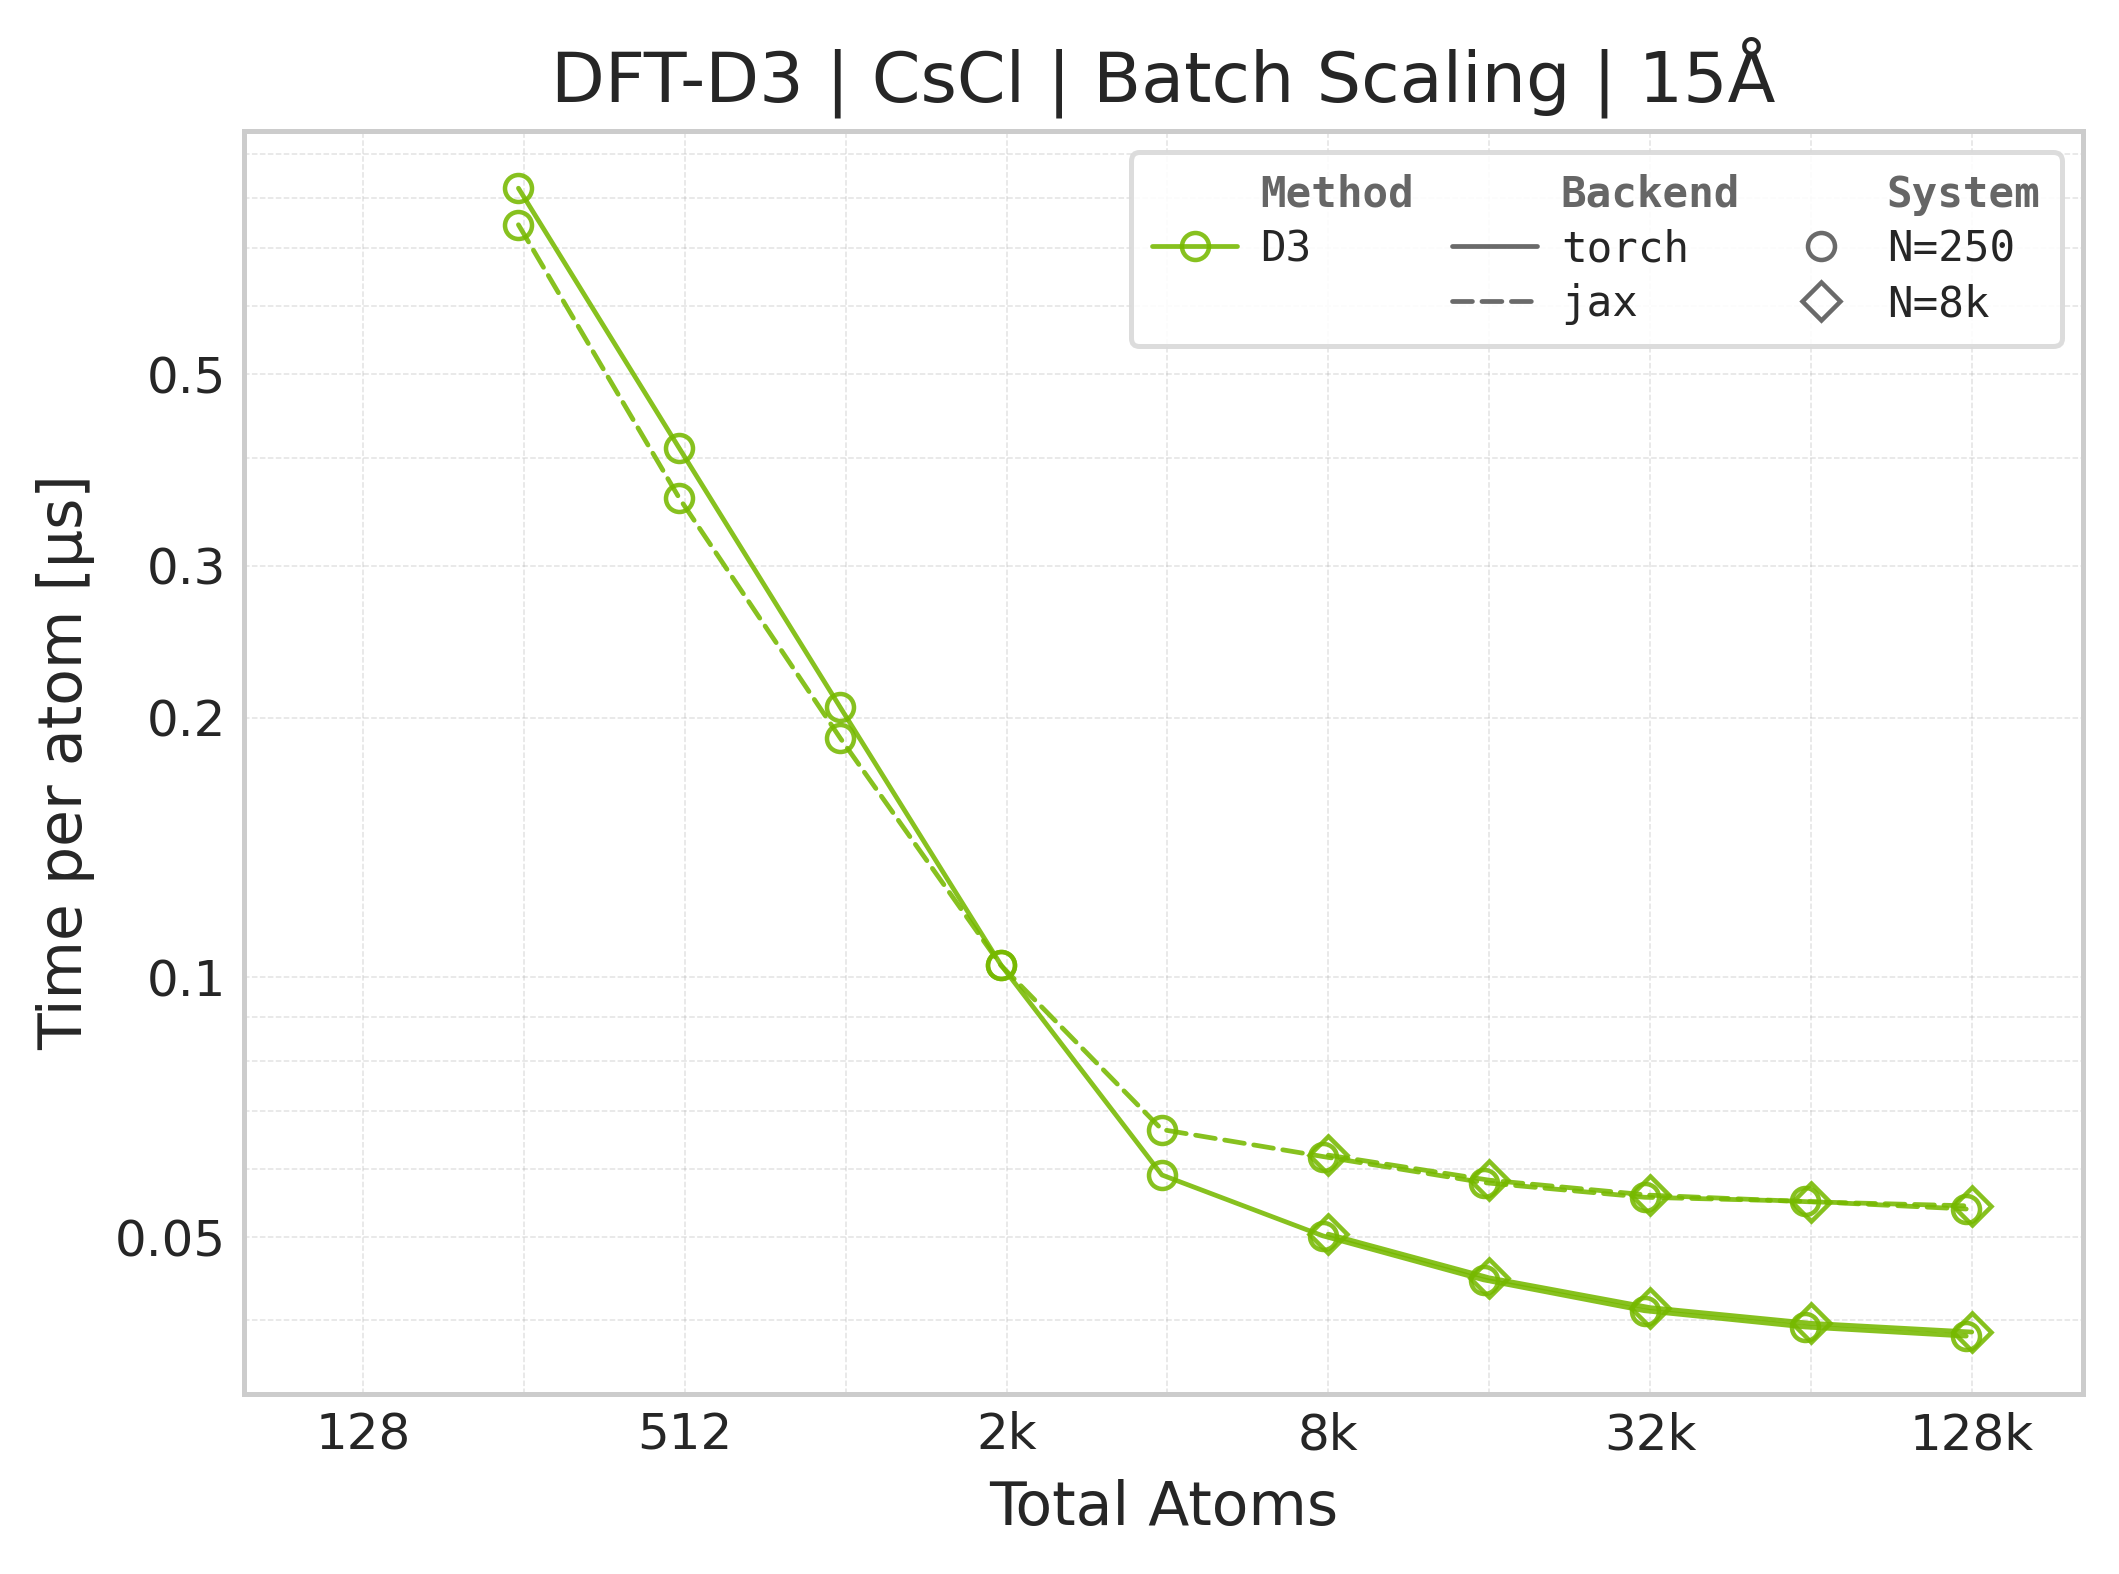
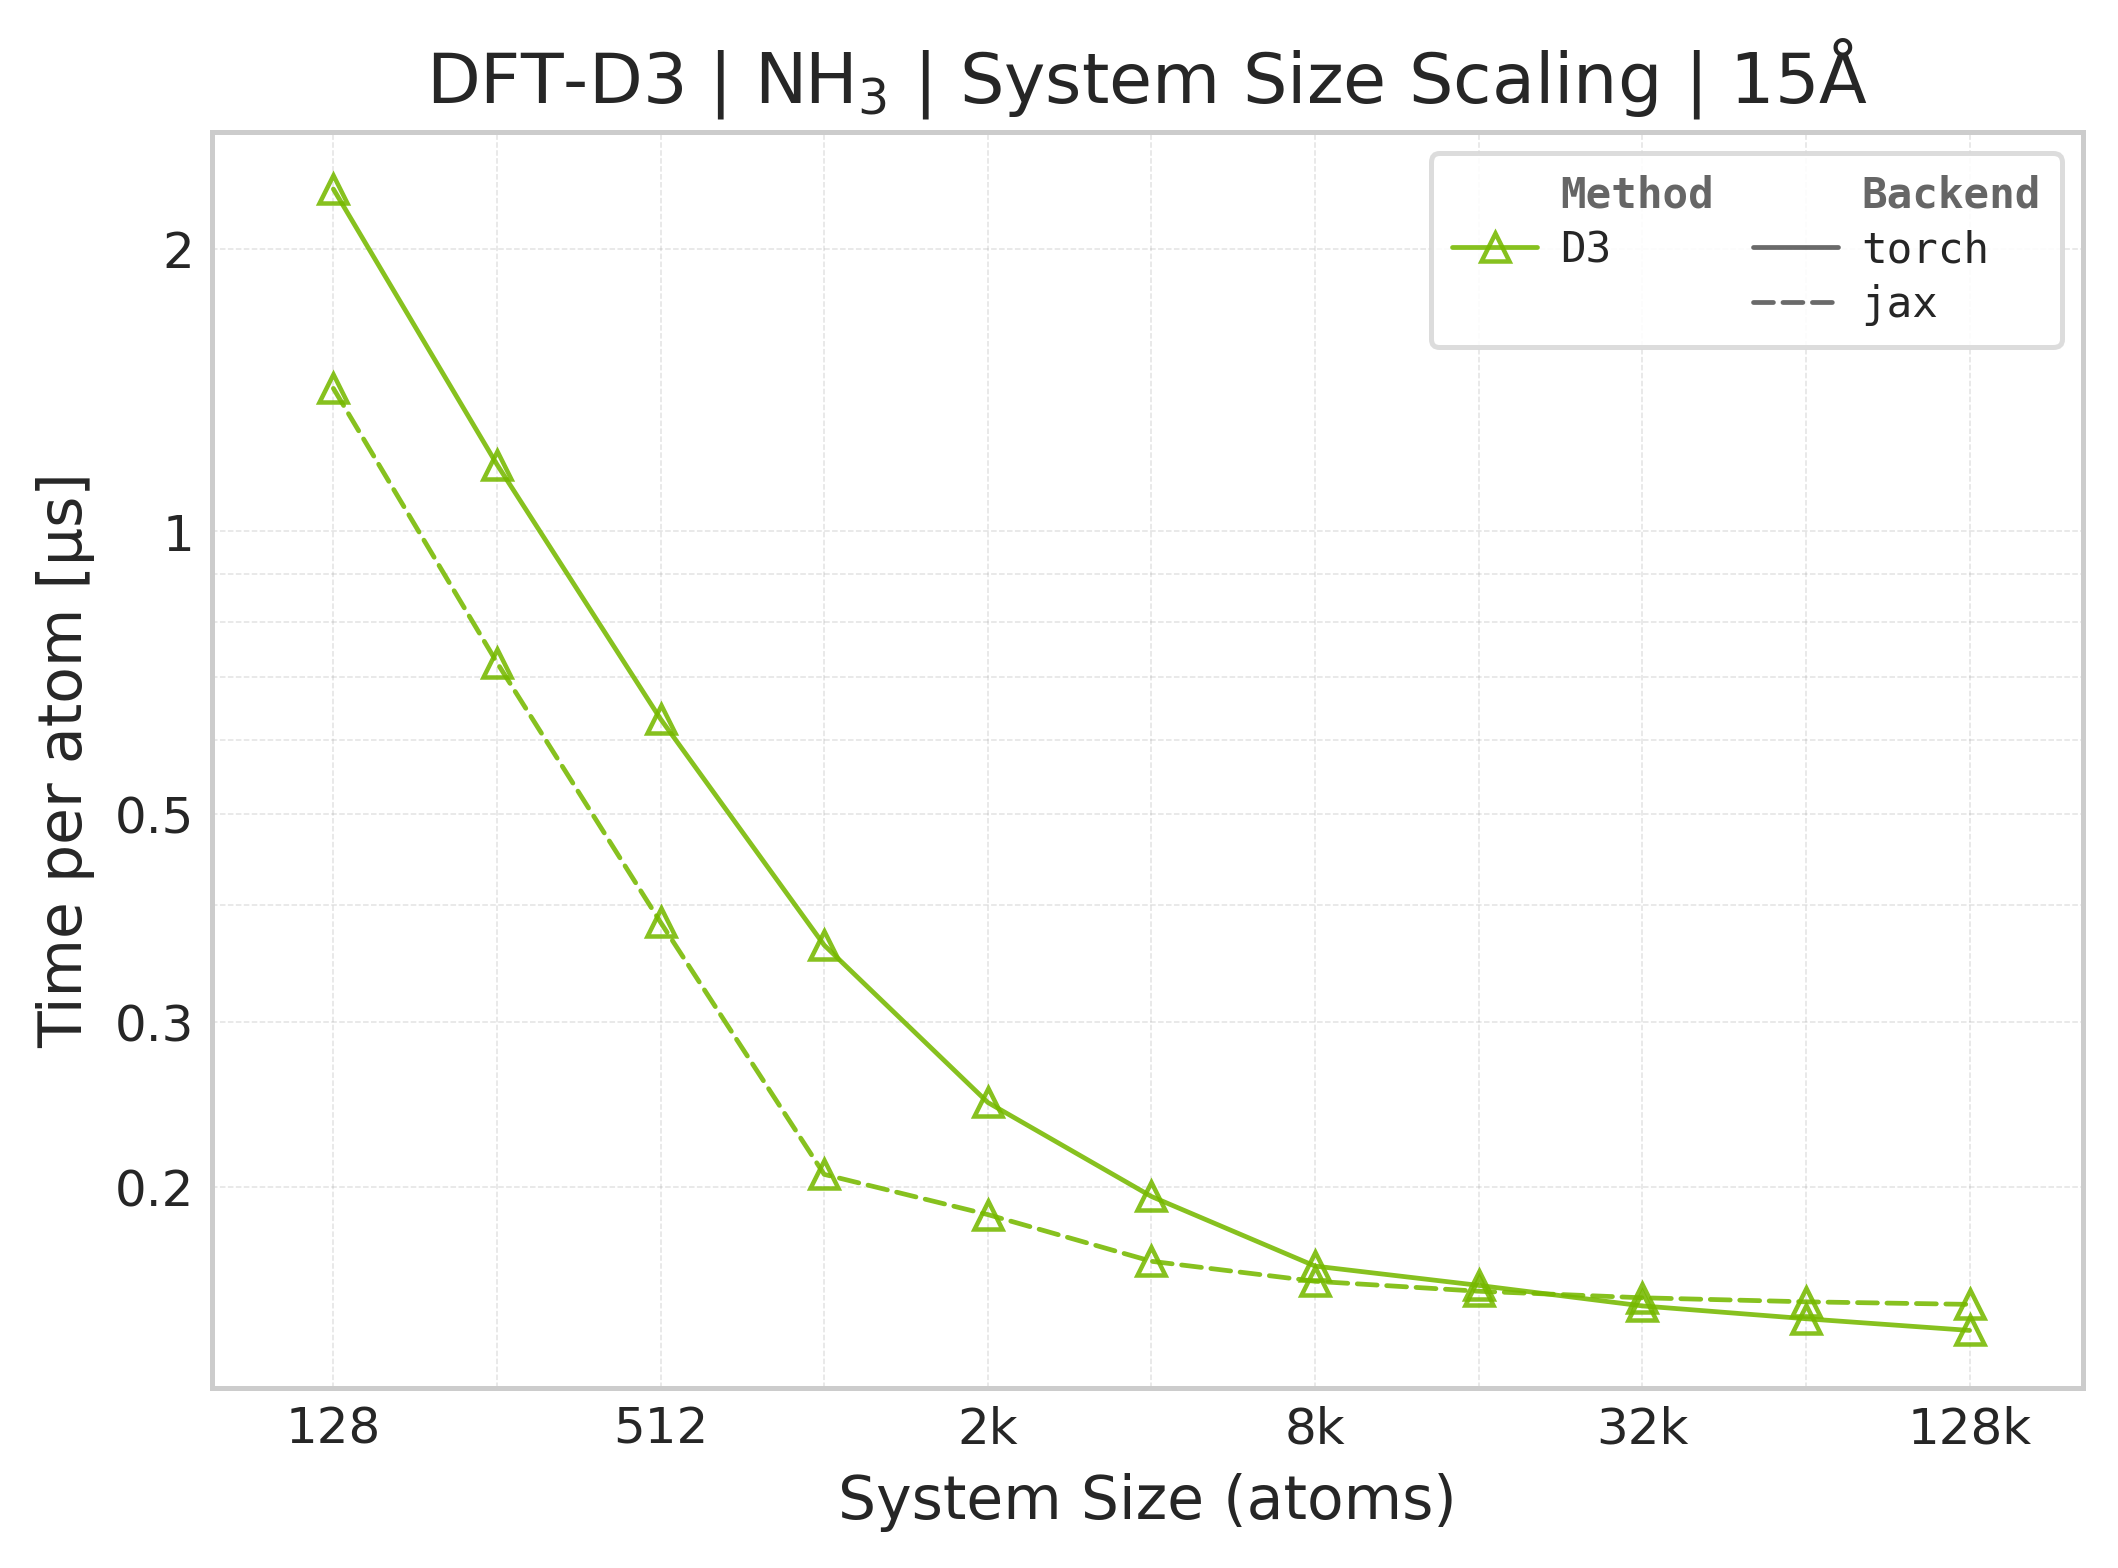
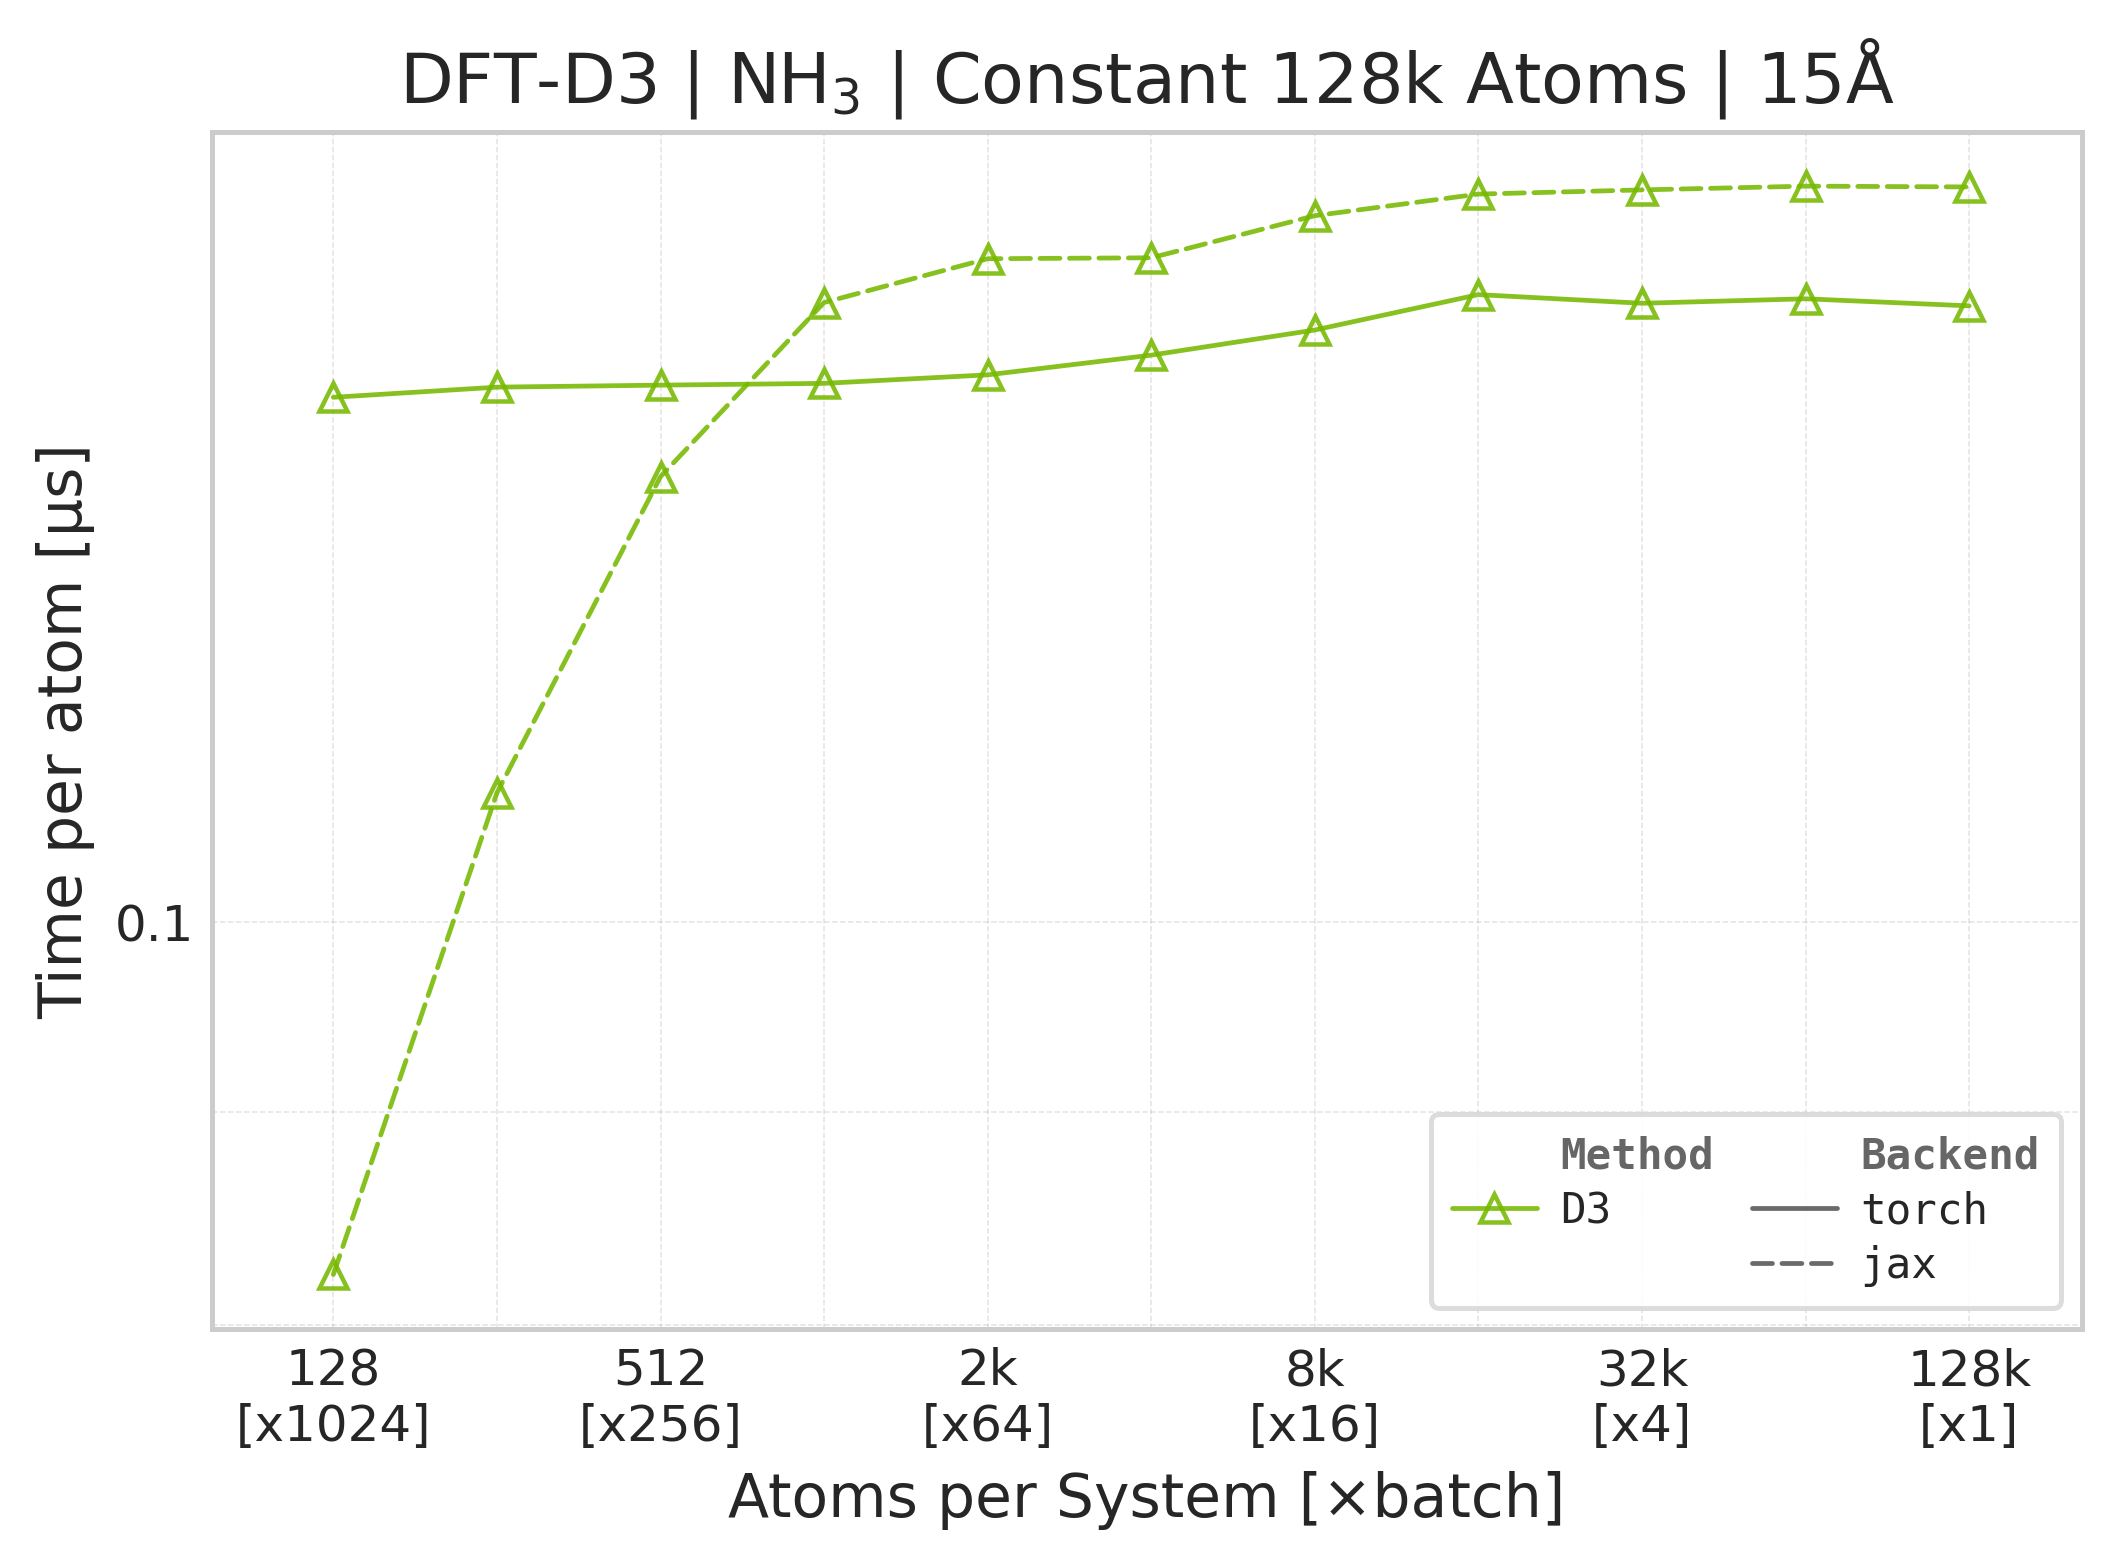
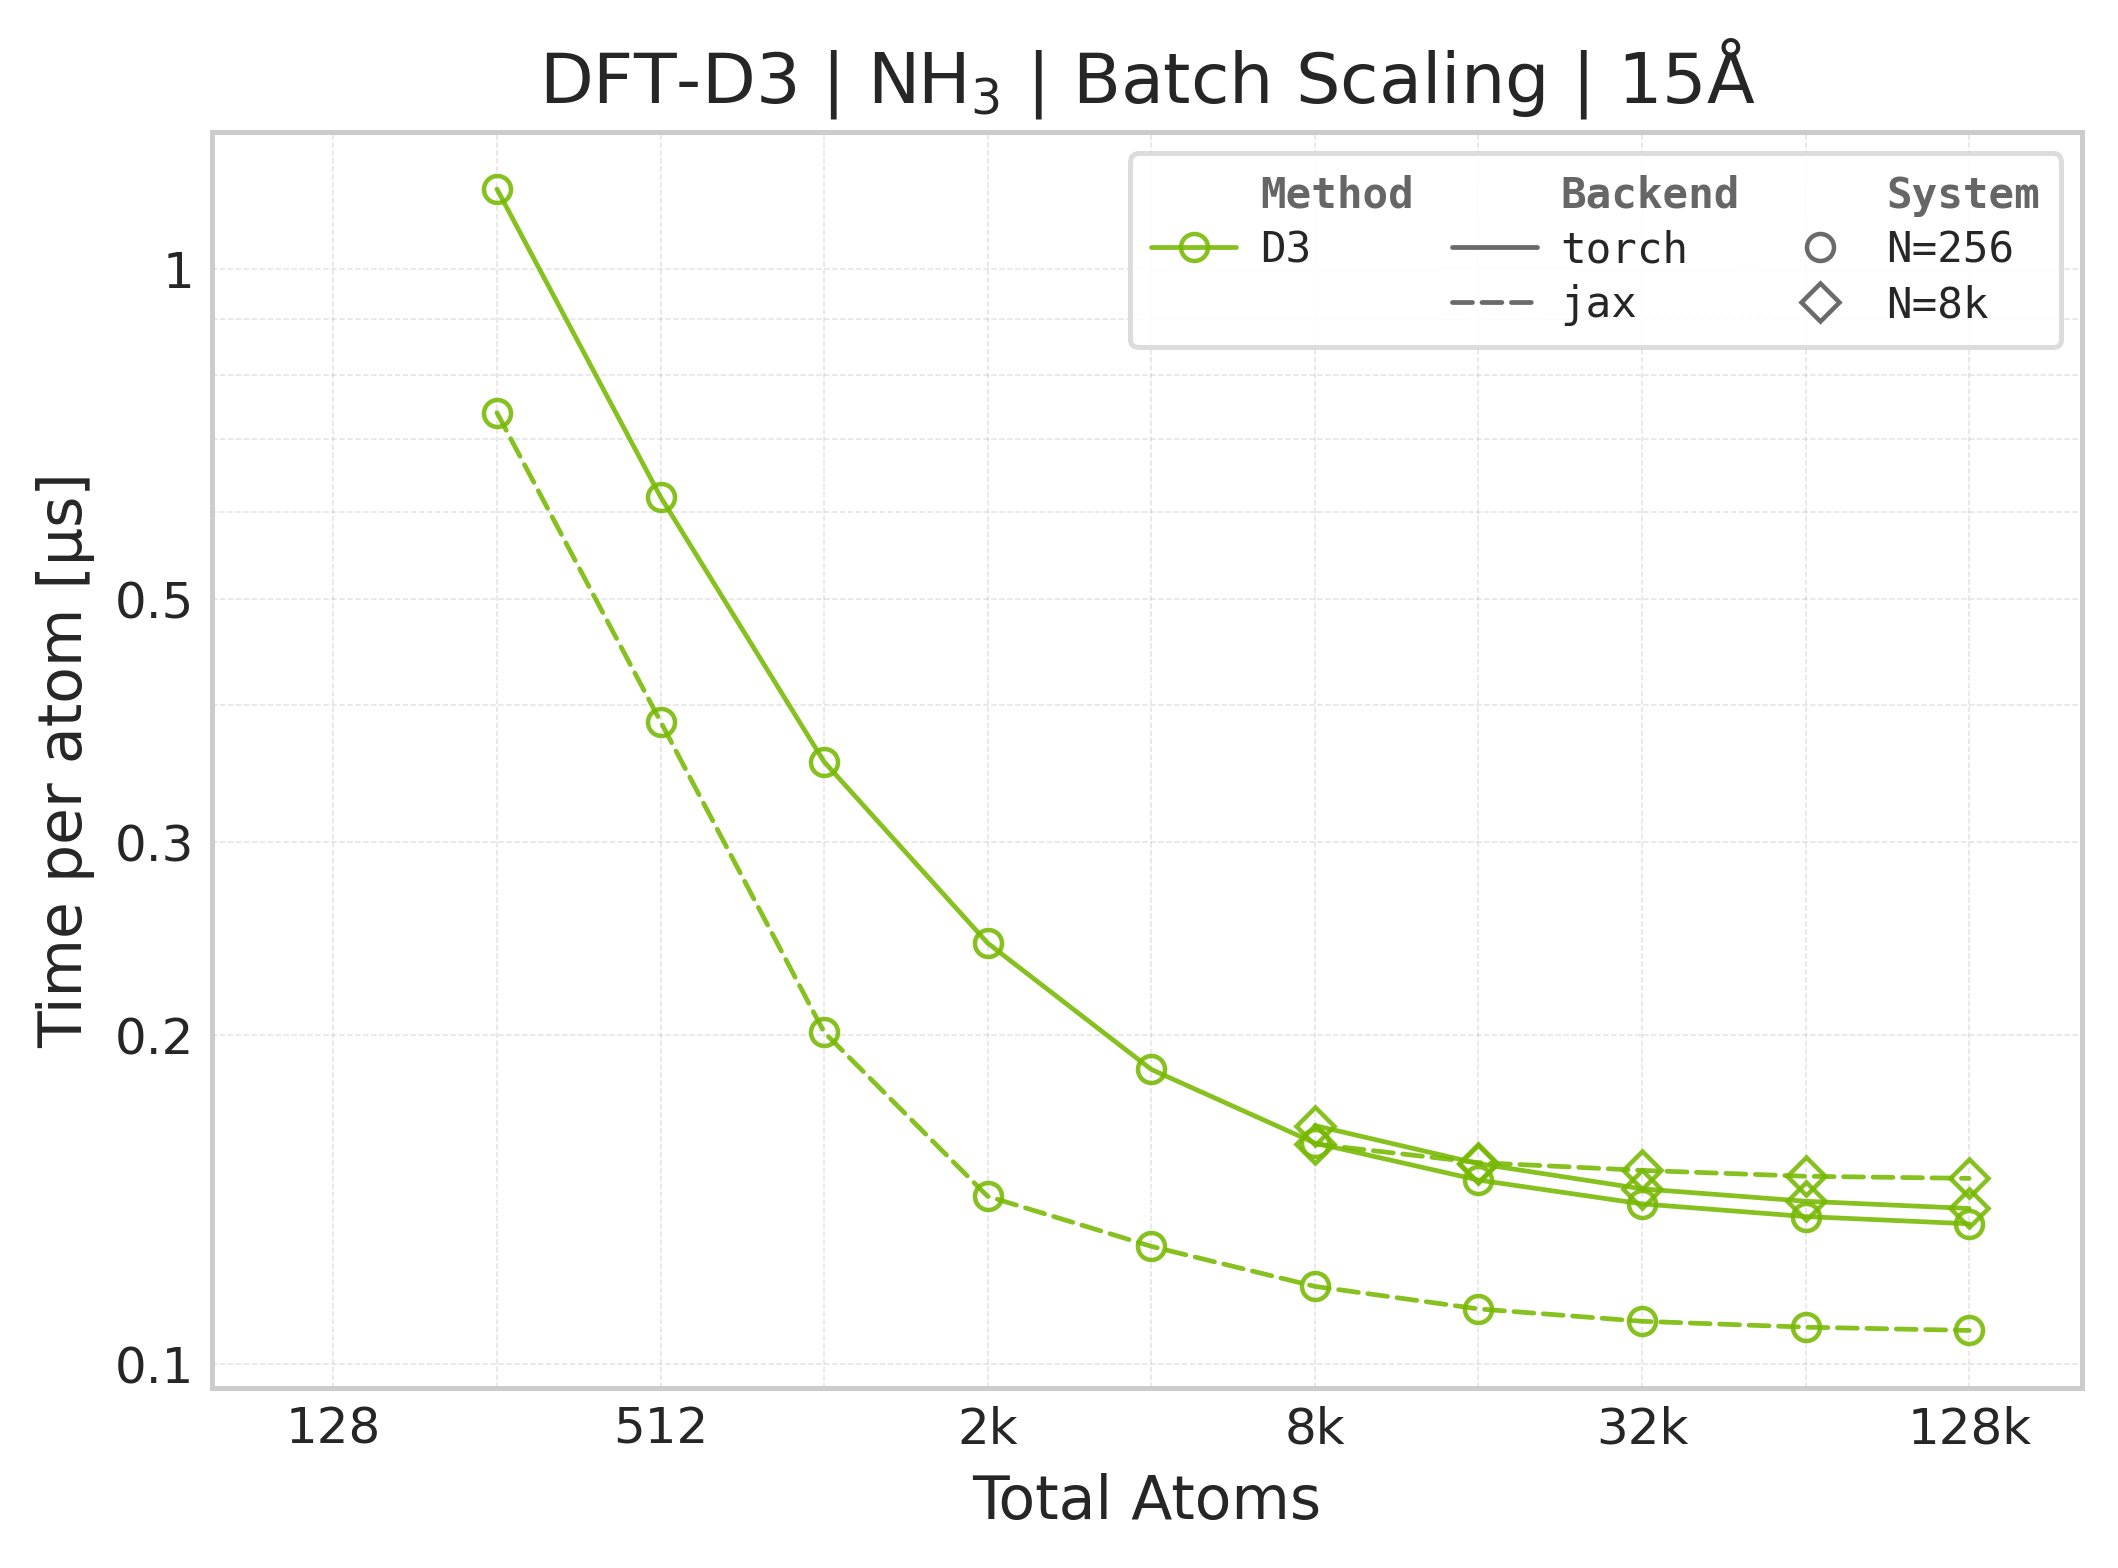
Time Scaling : Mean execution time (µs/atom) vs. system size. Lower is better. Timings exclude neighbor list construction, and only comprise the DFT-D3 computation.
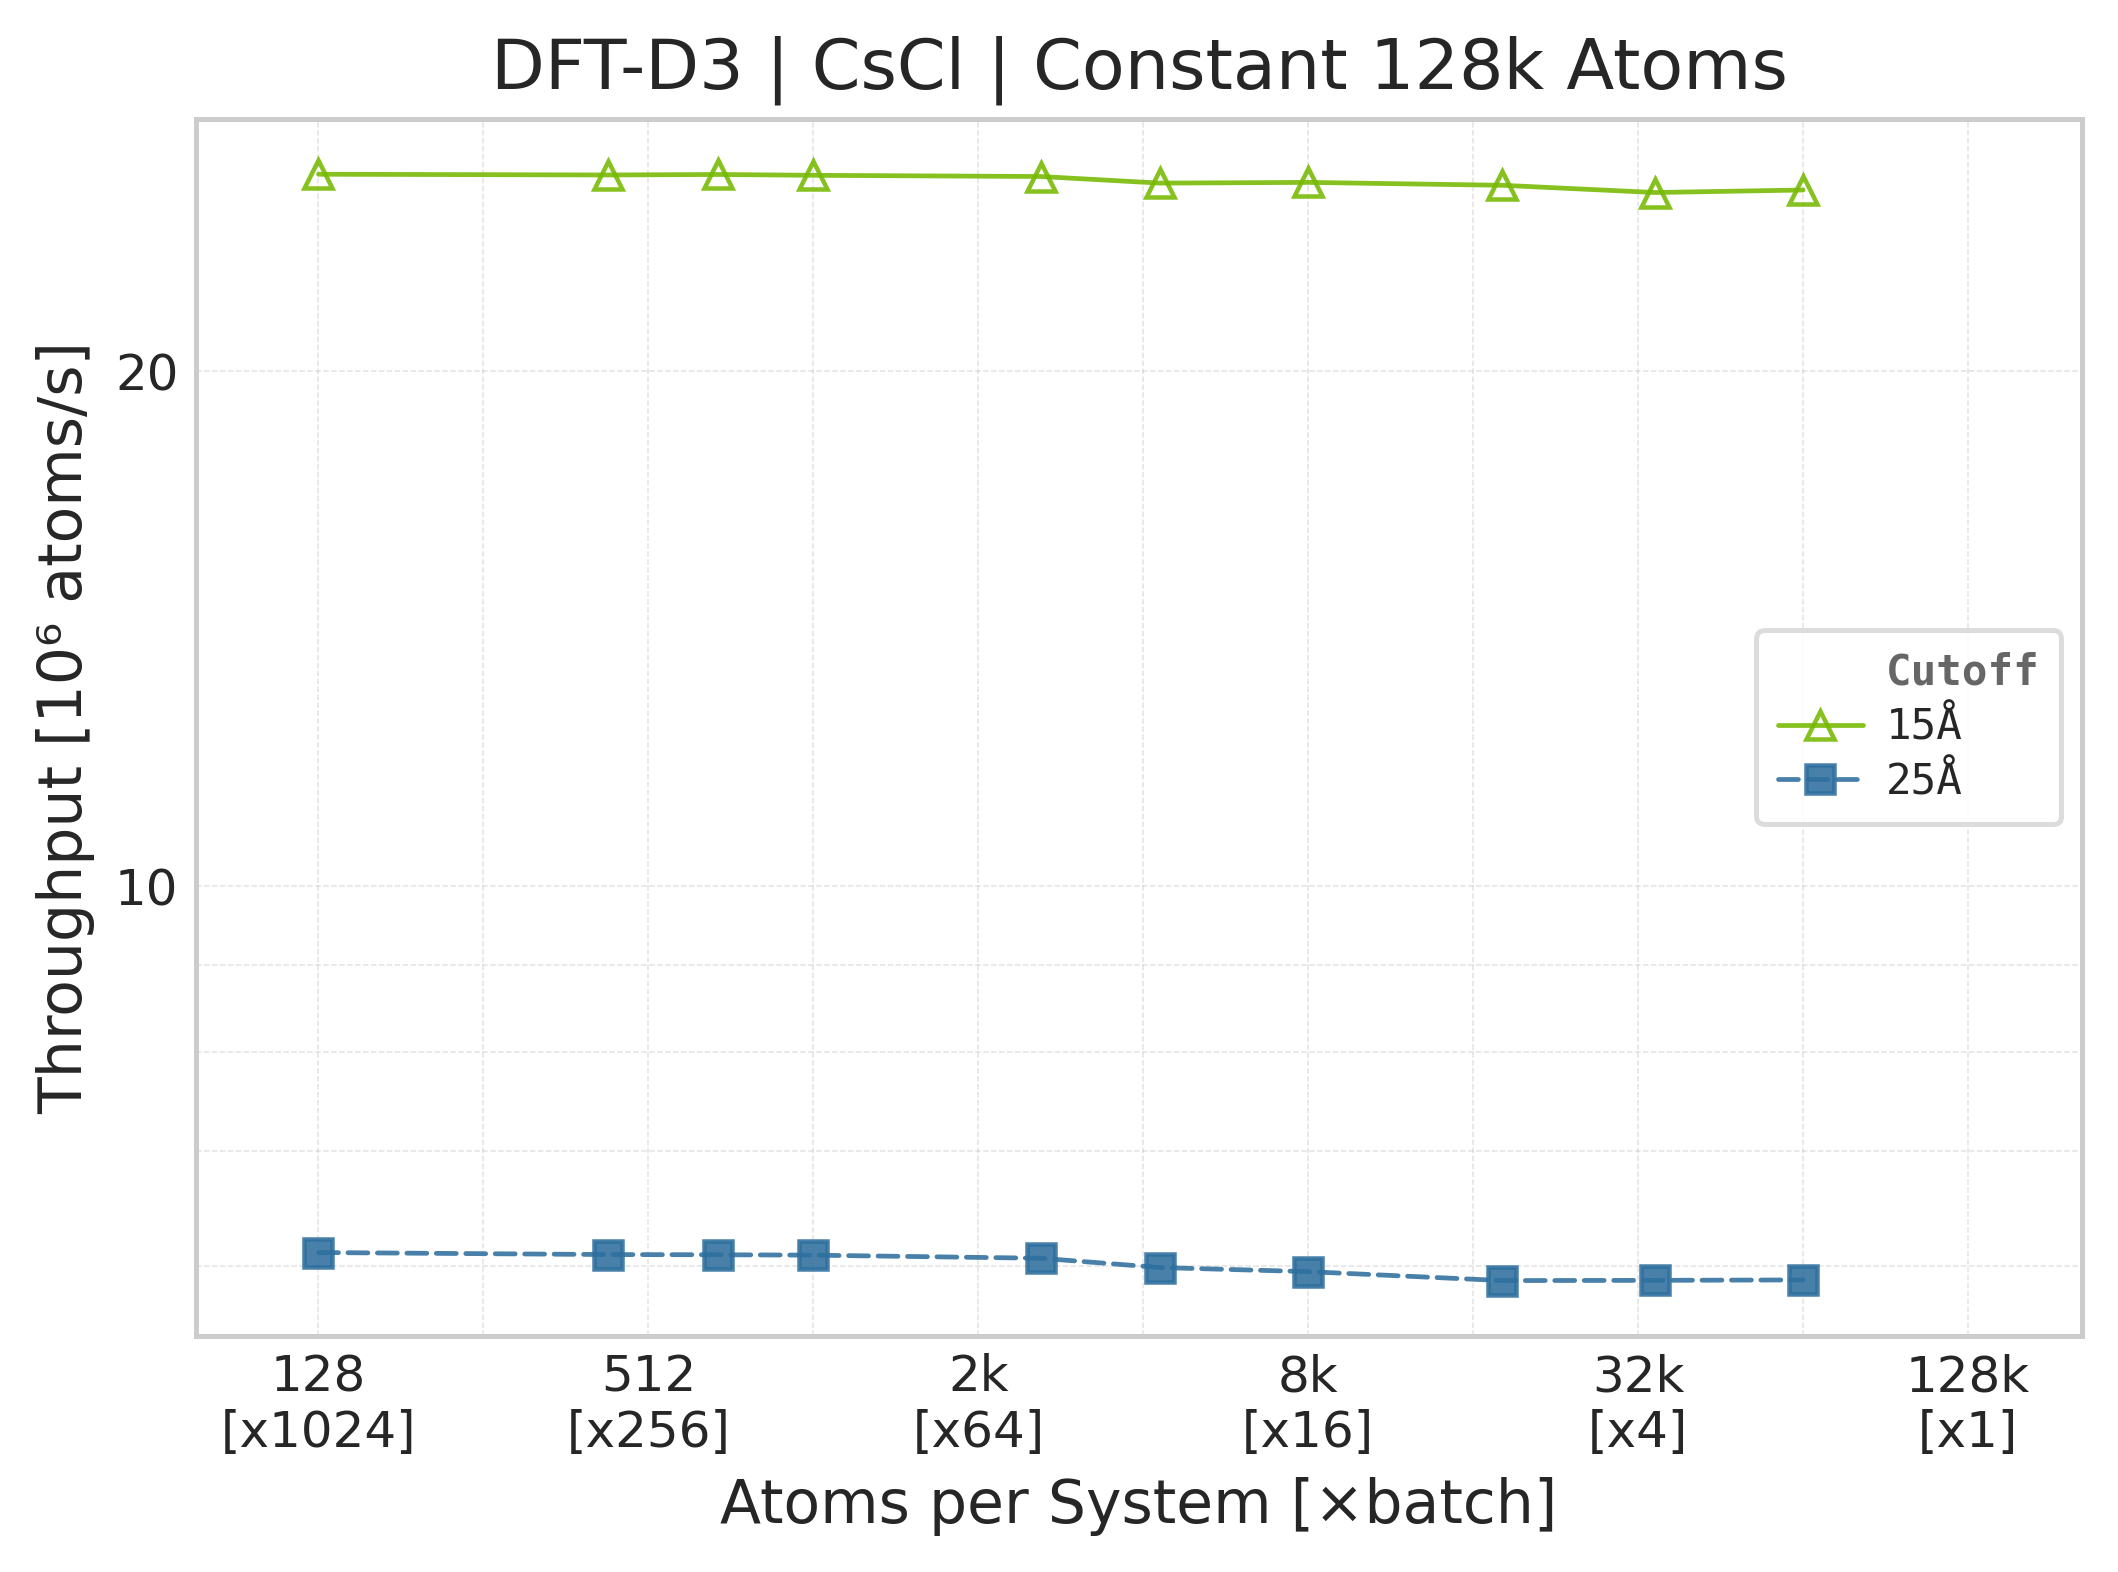
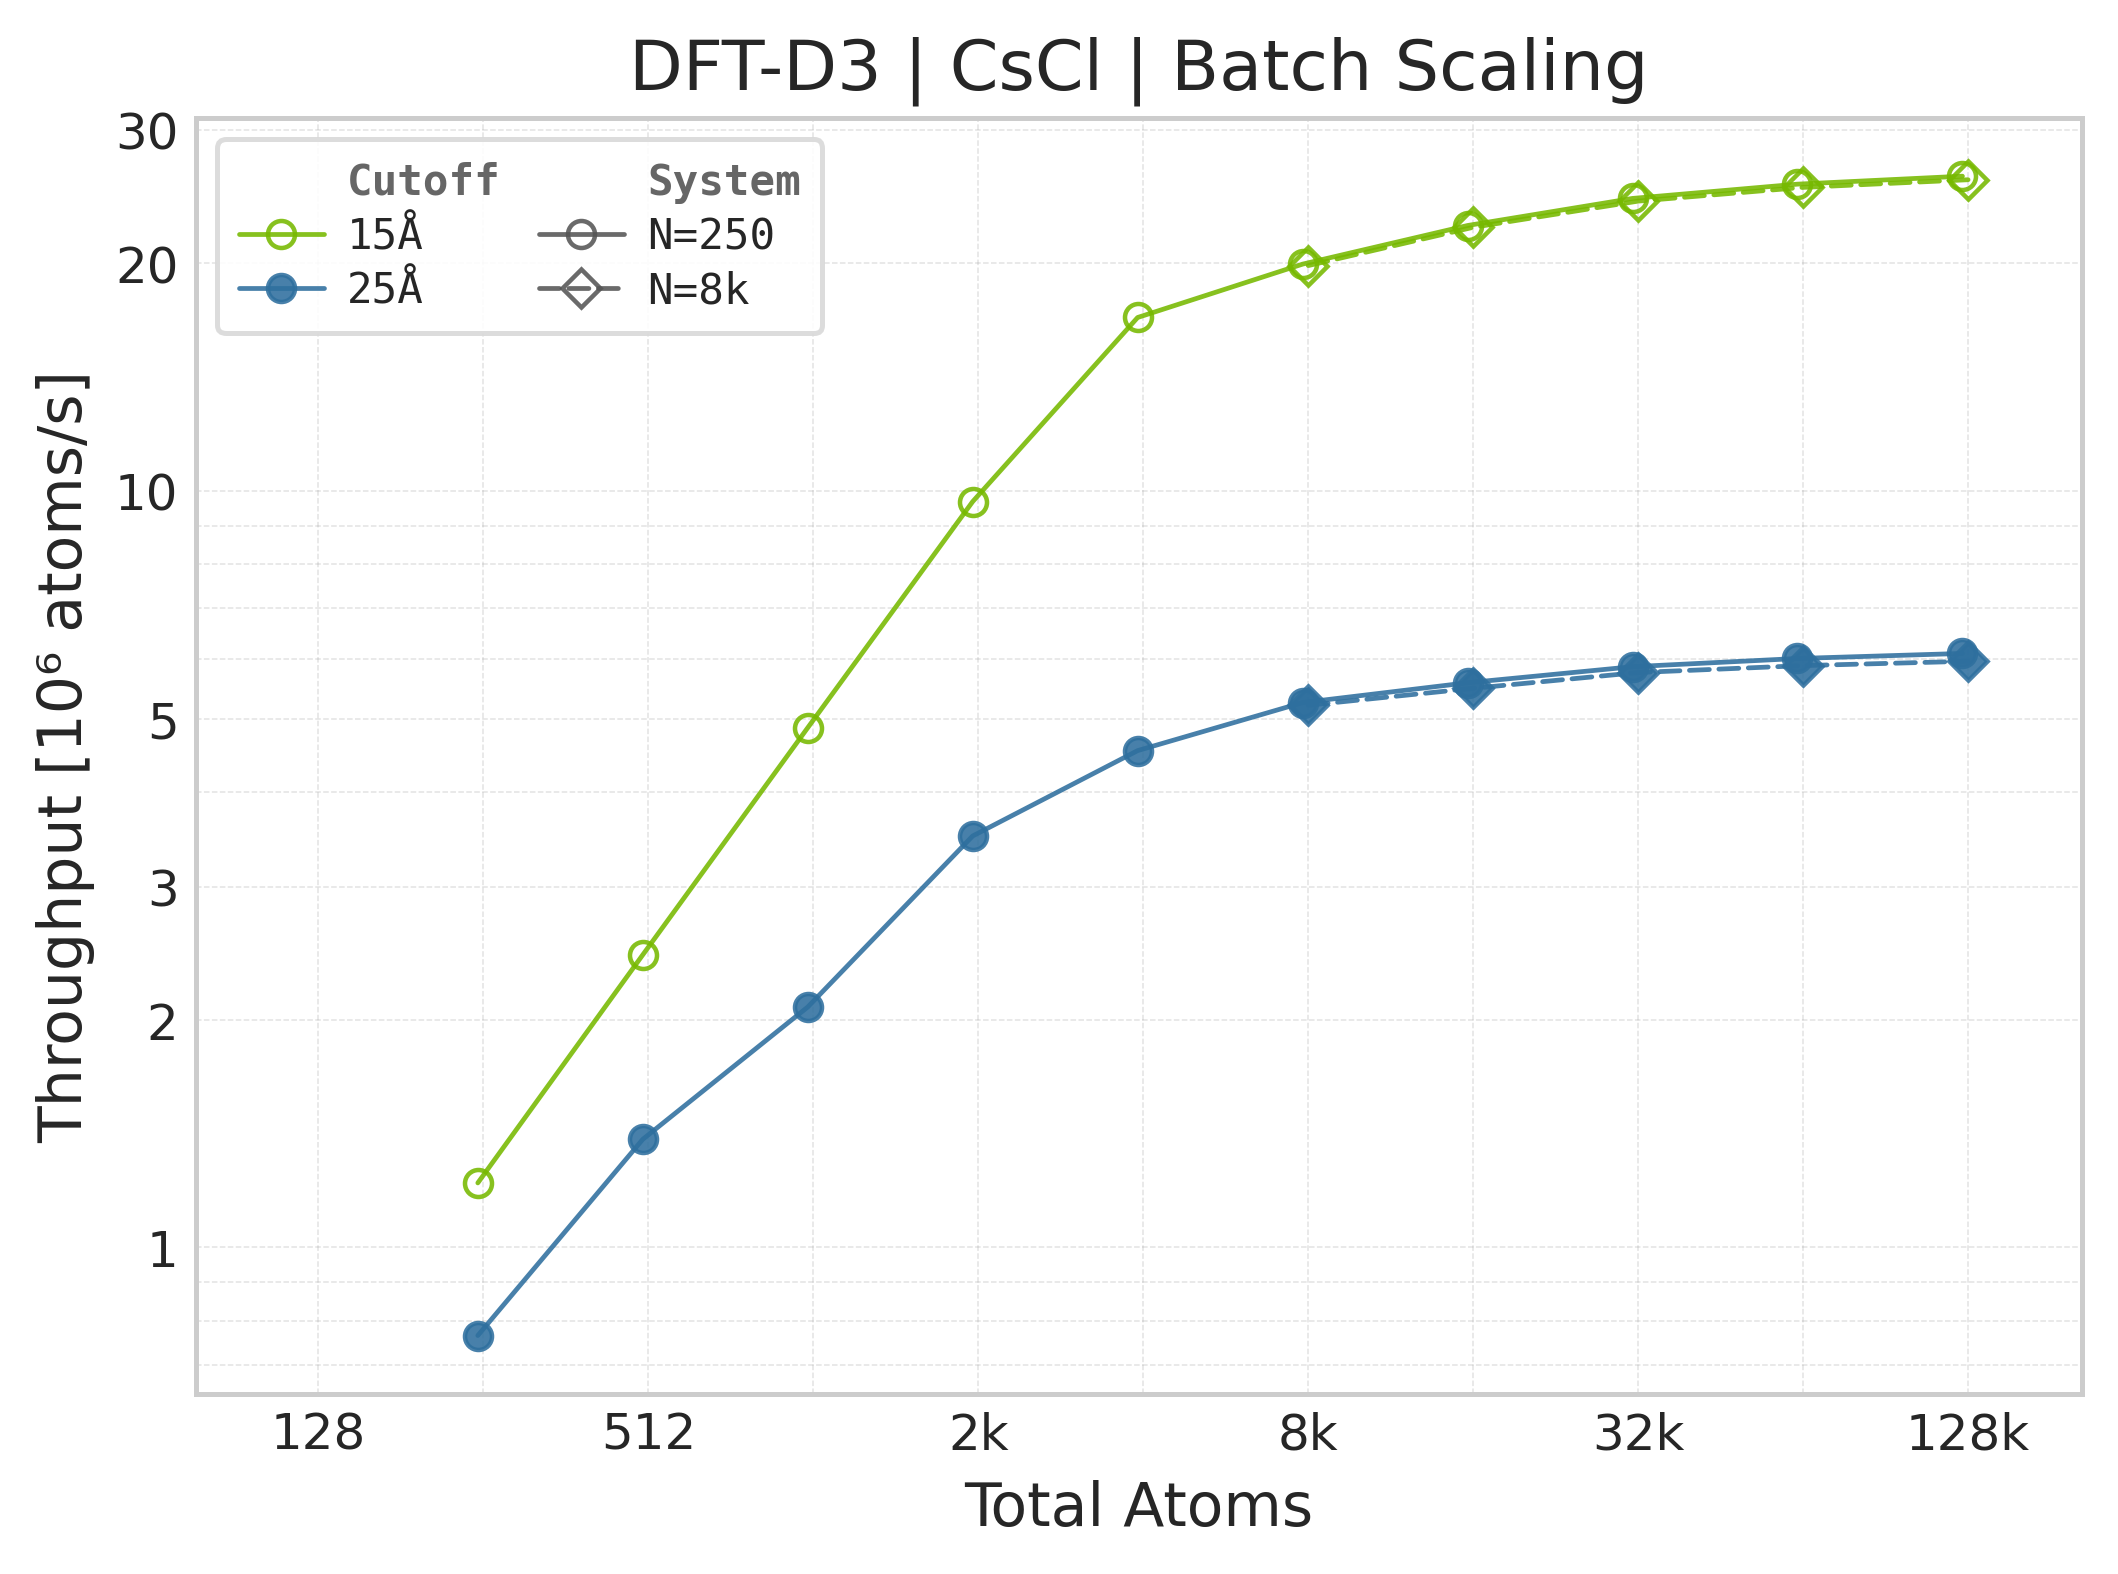
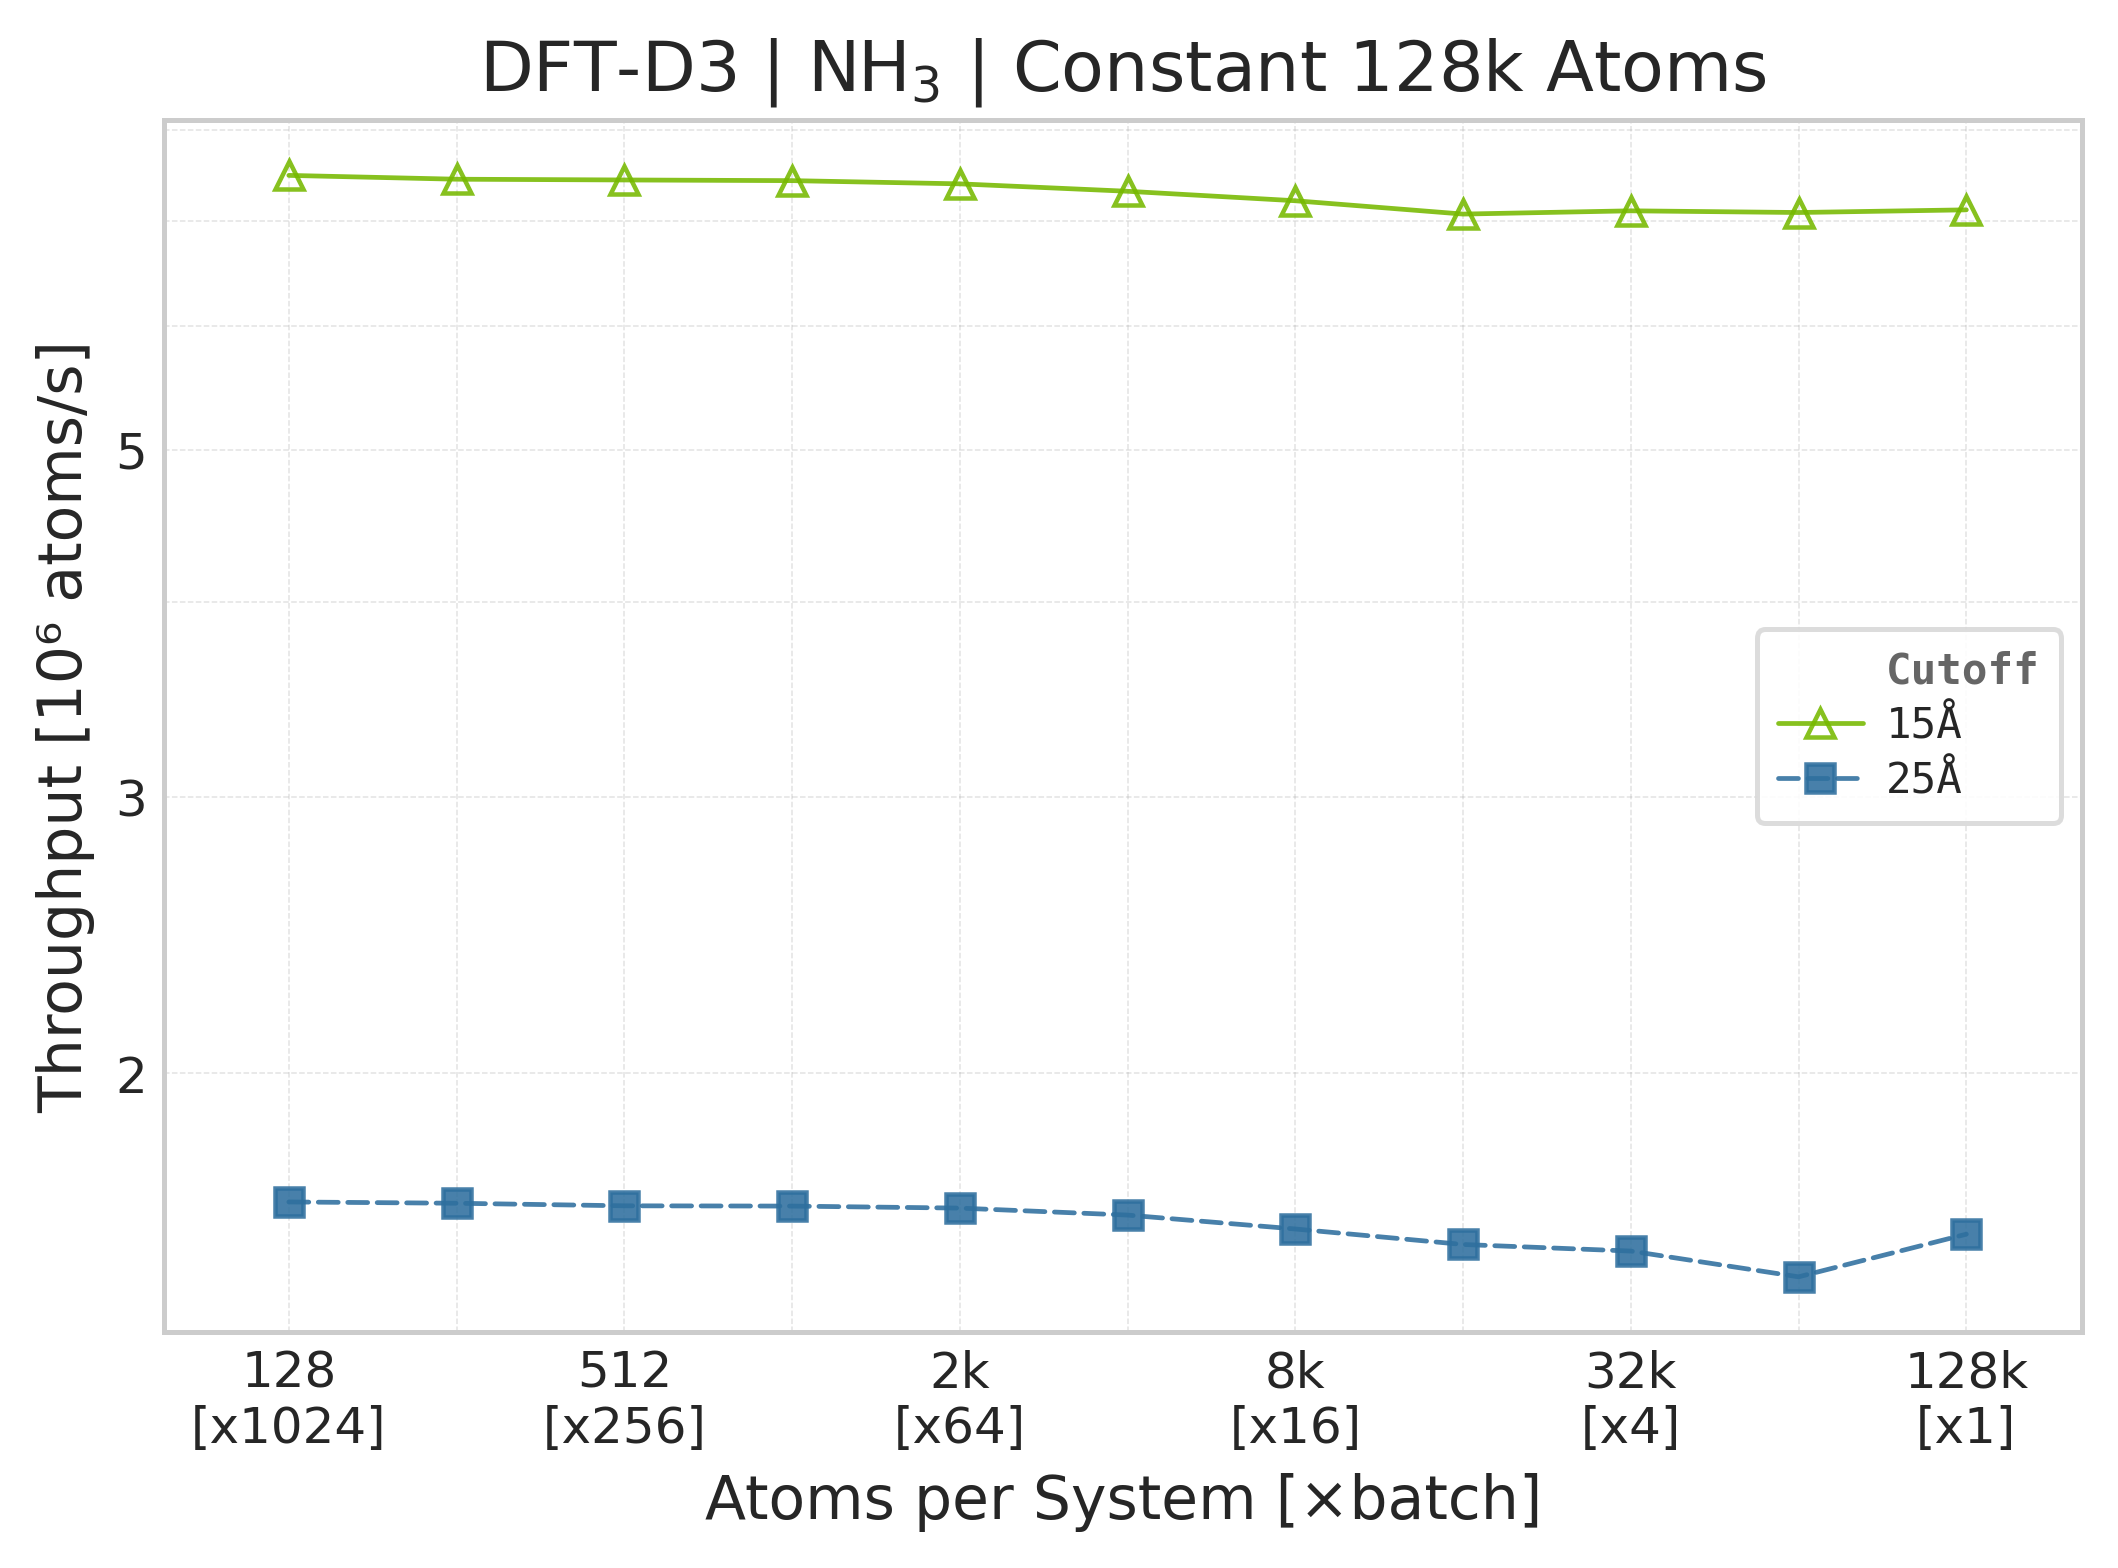
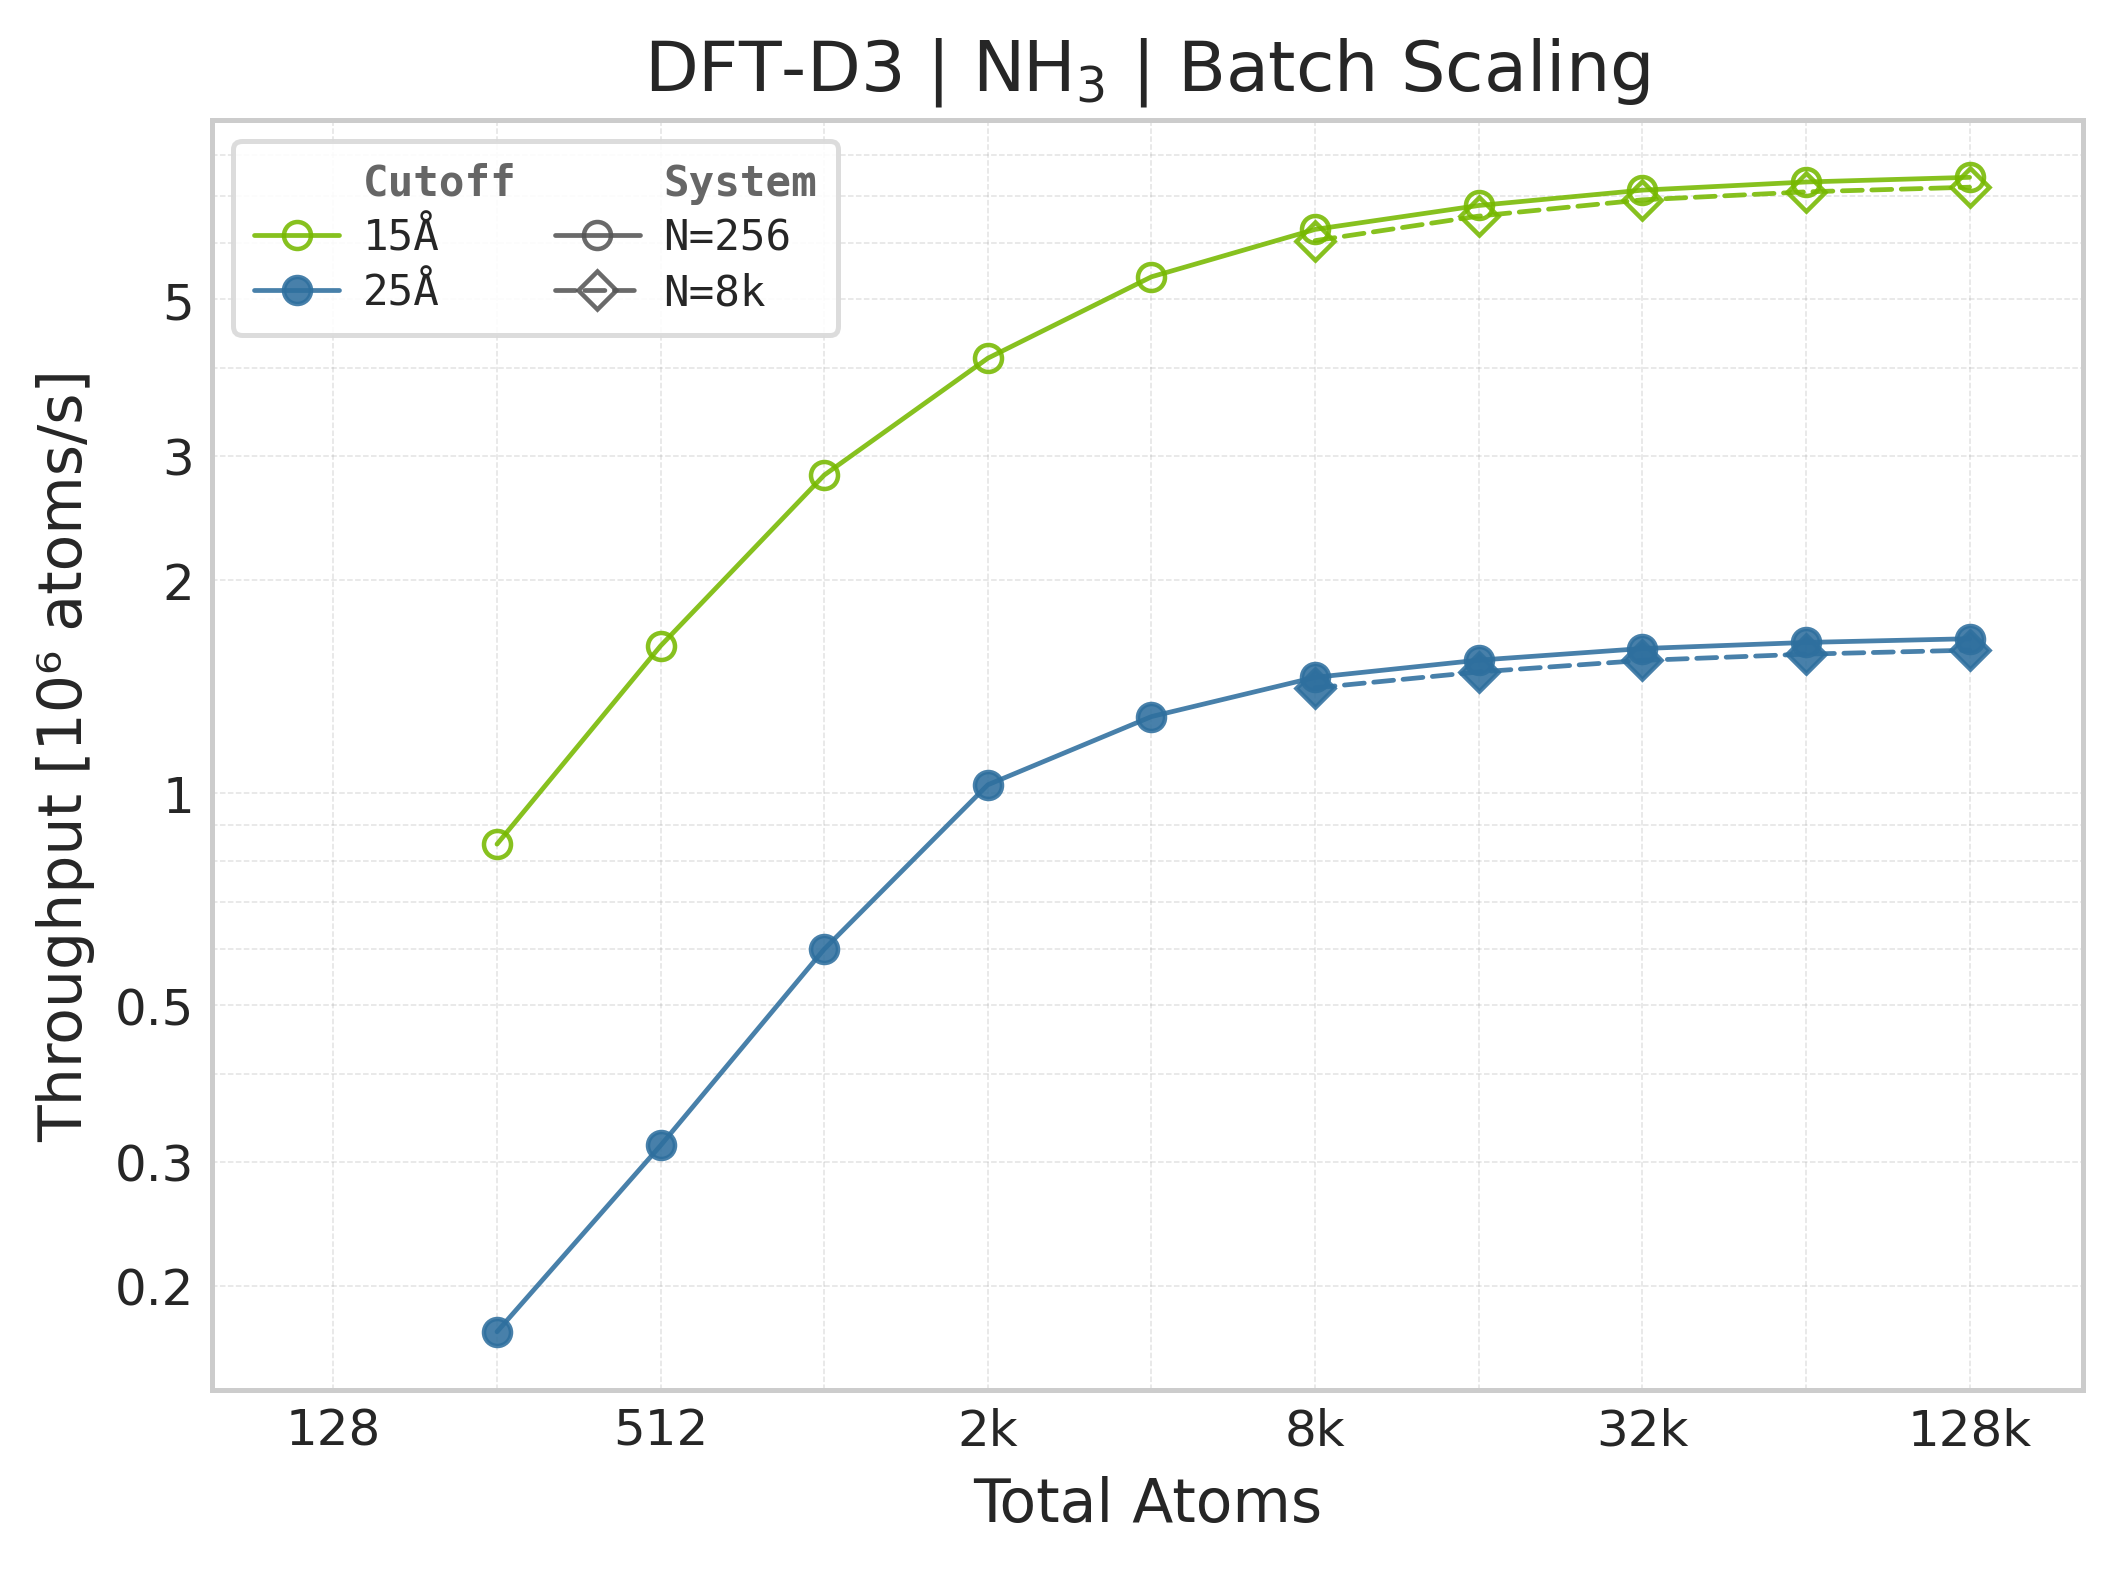
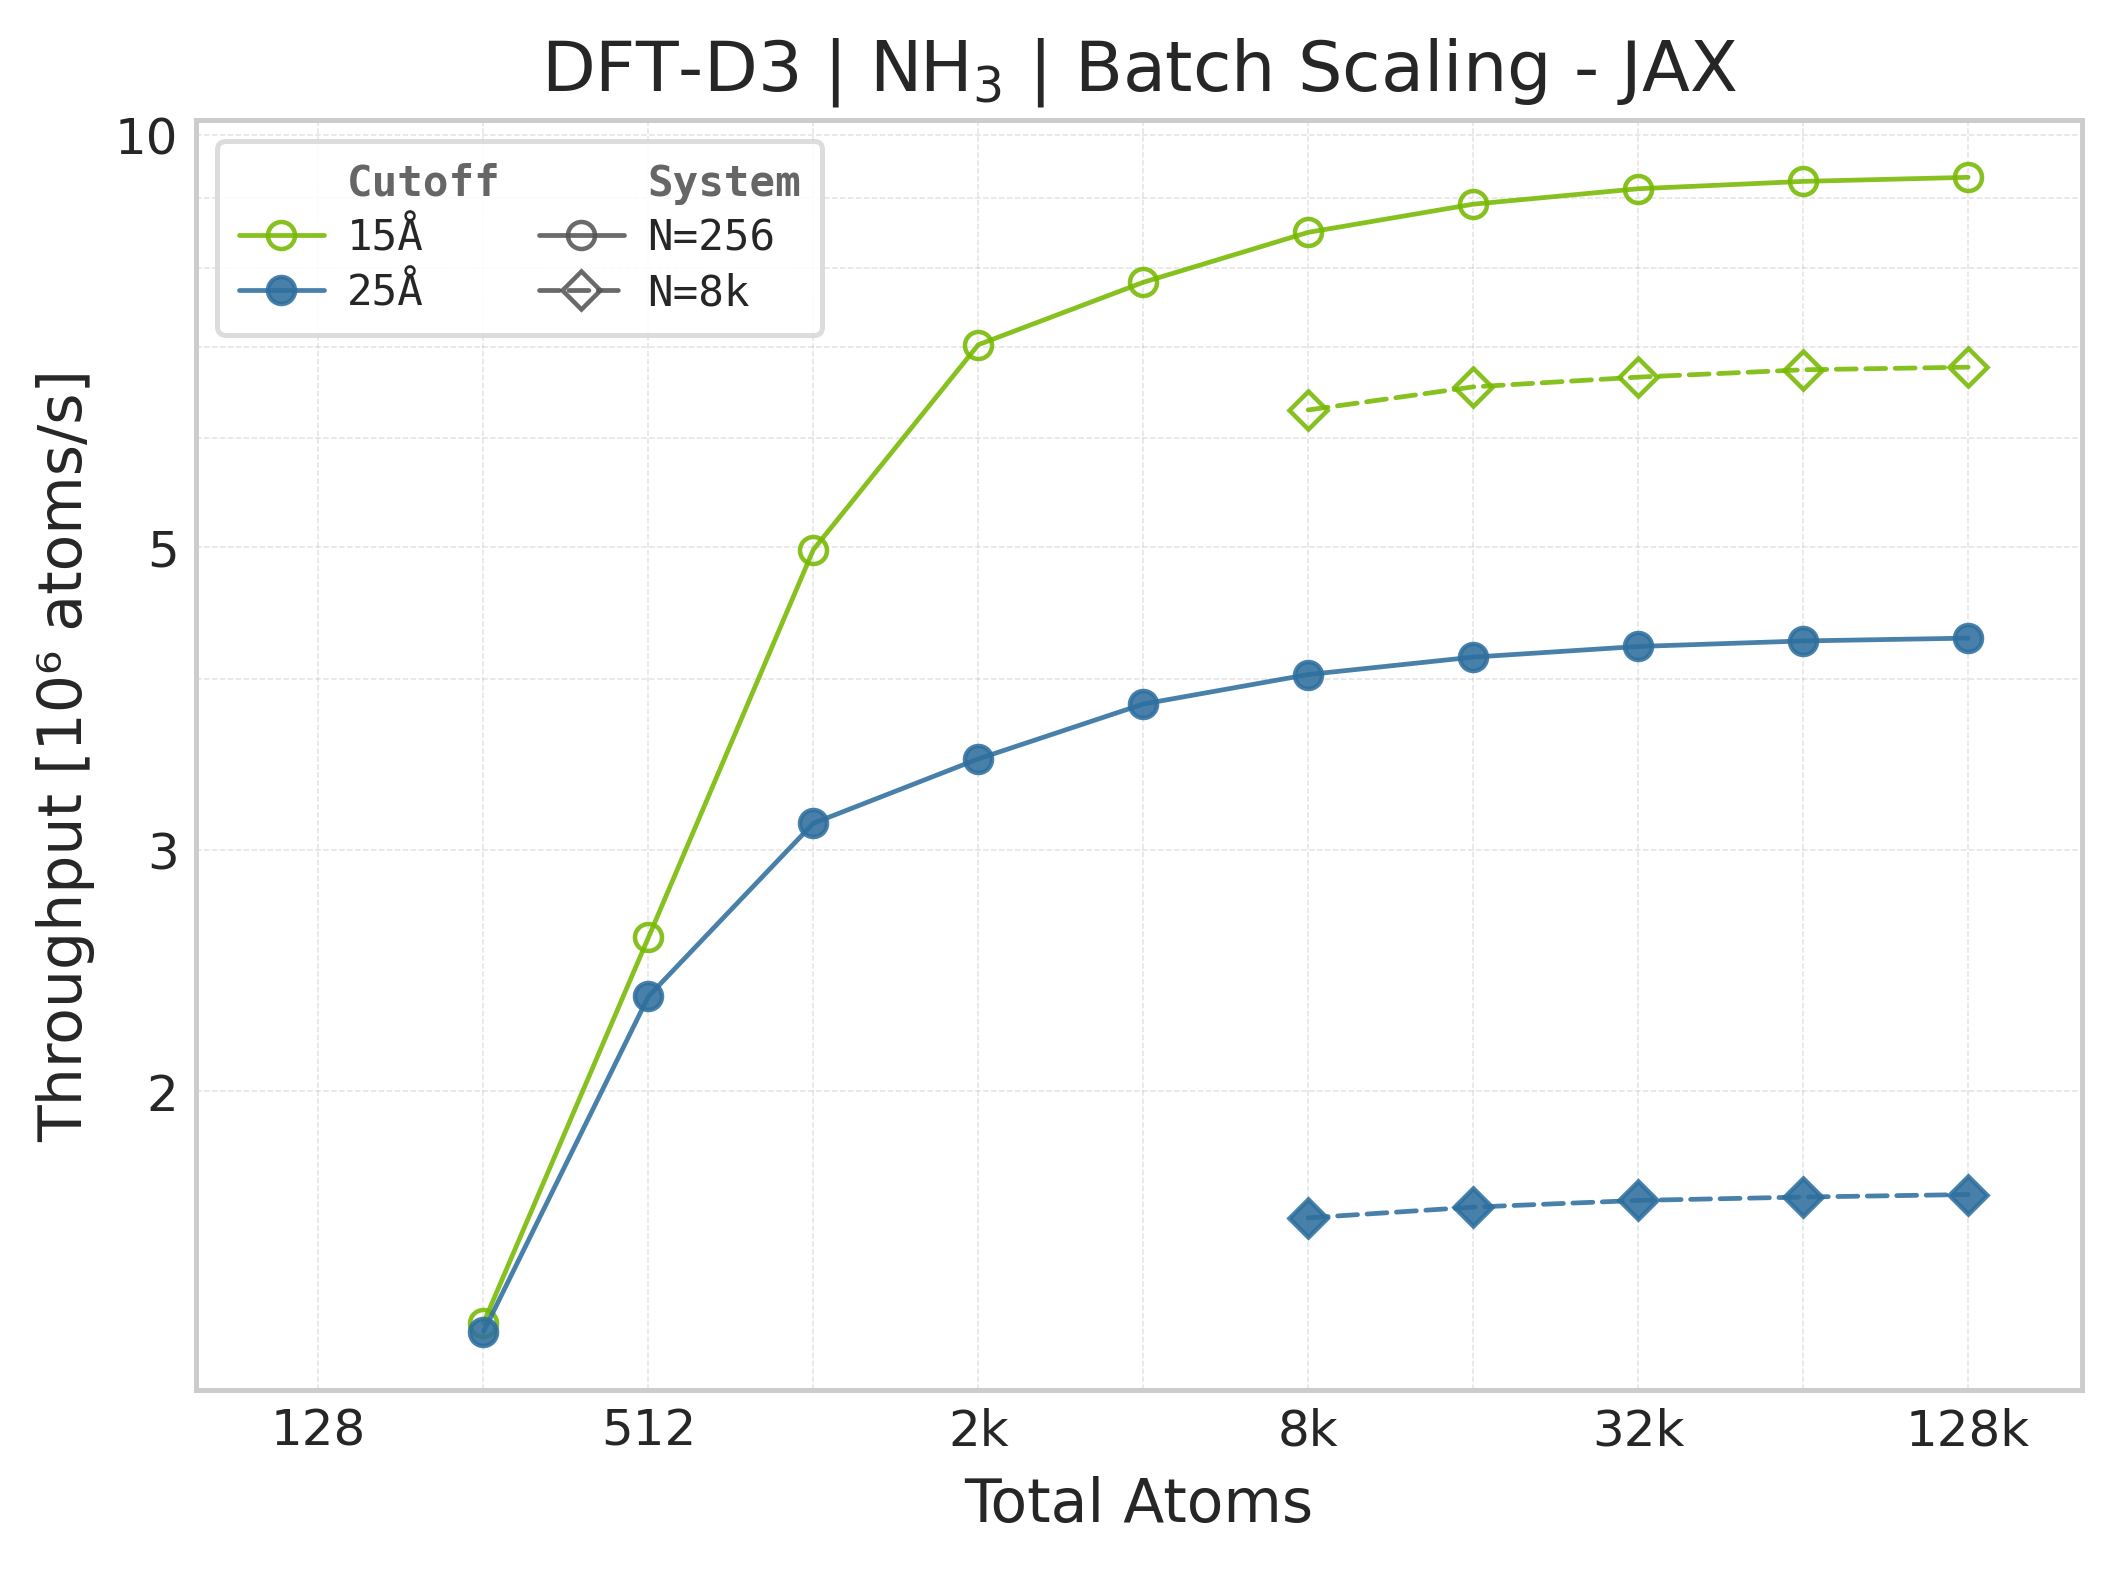
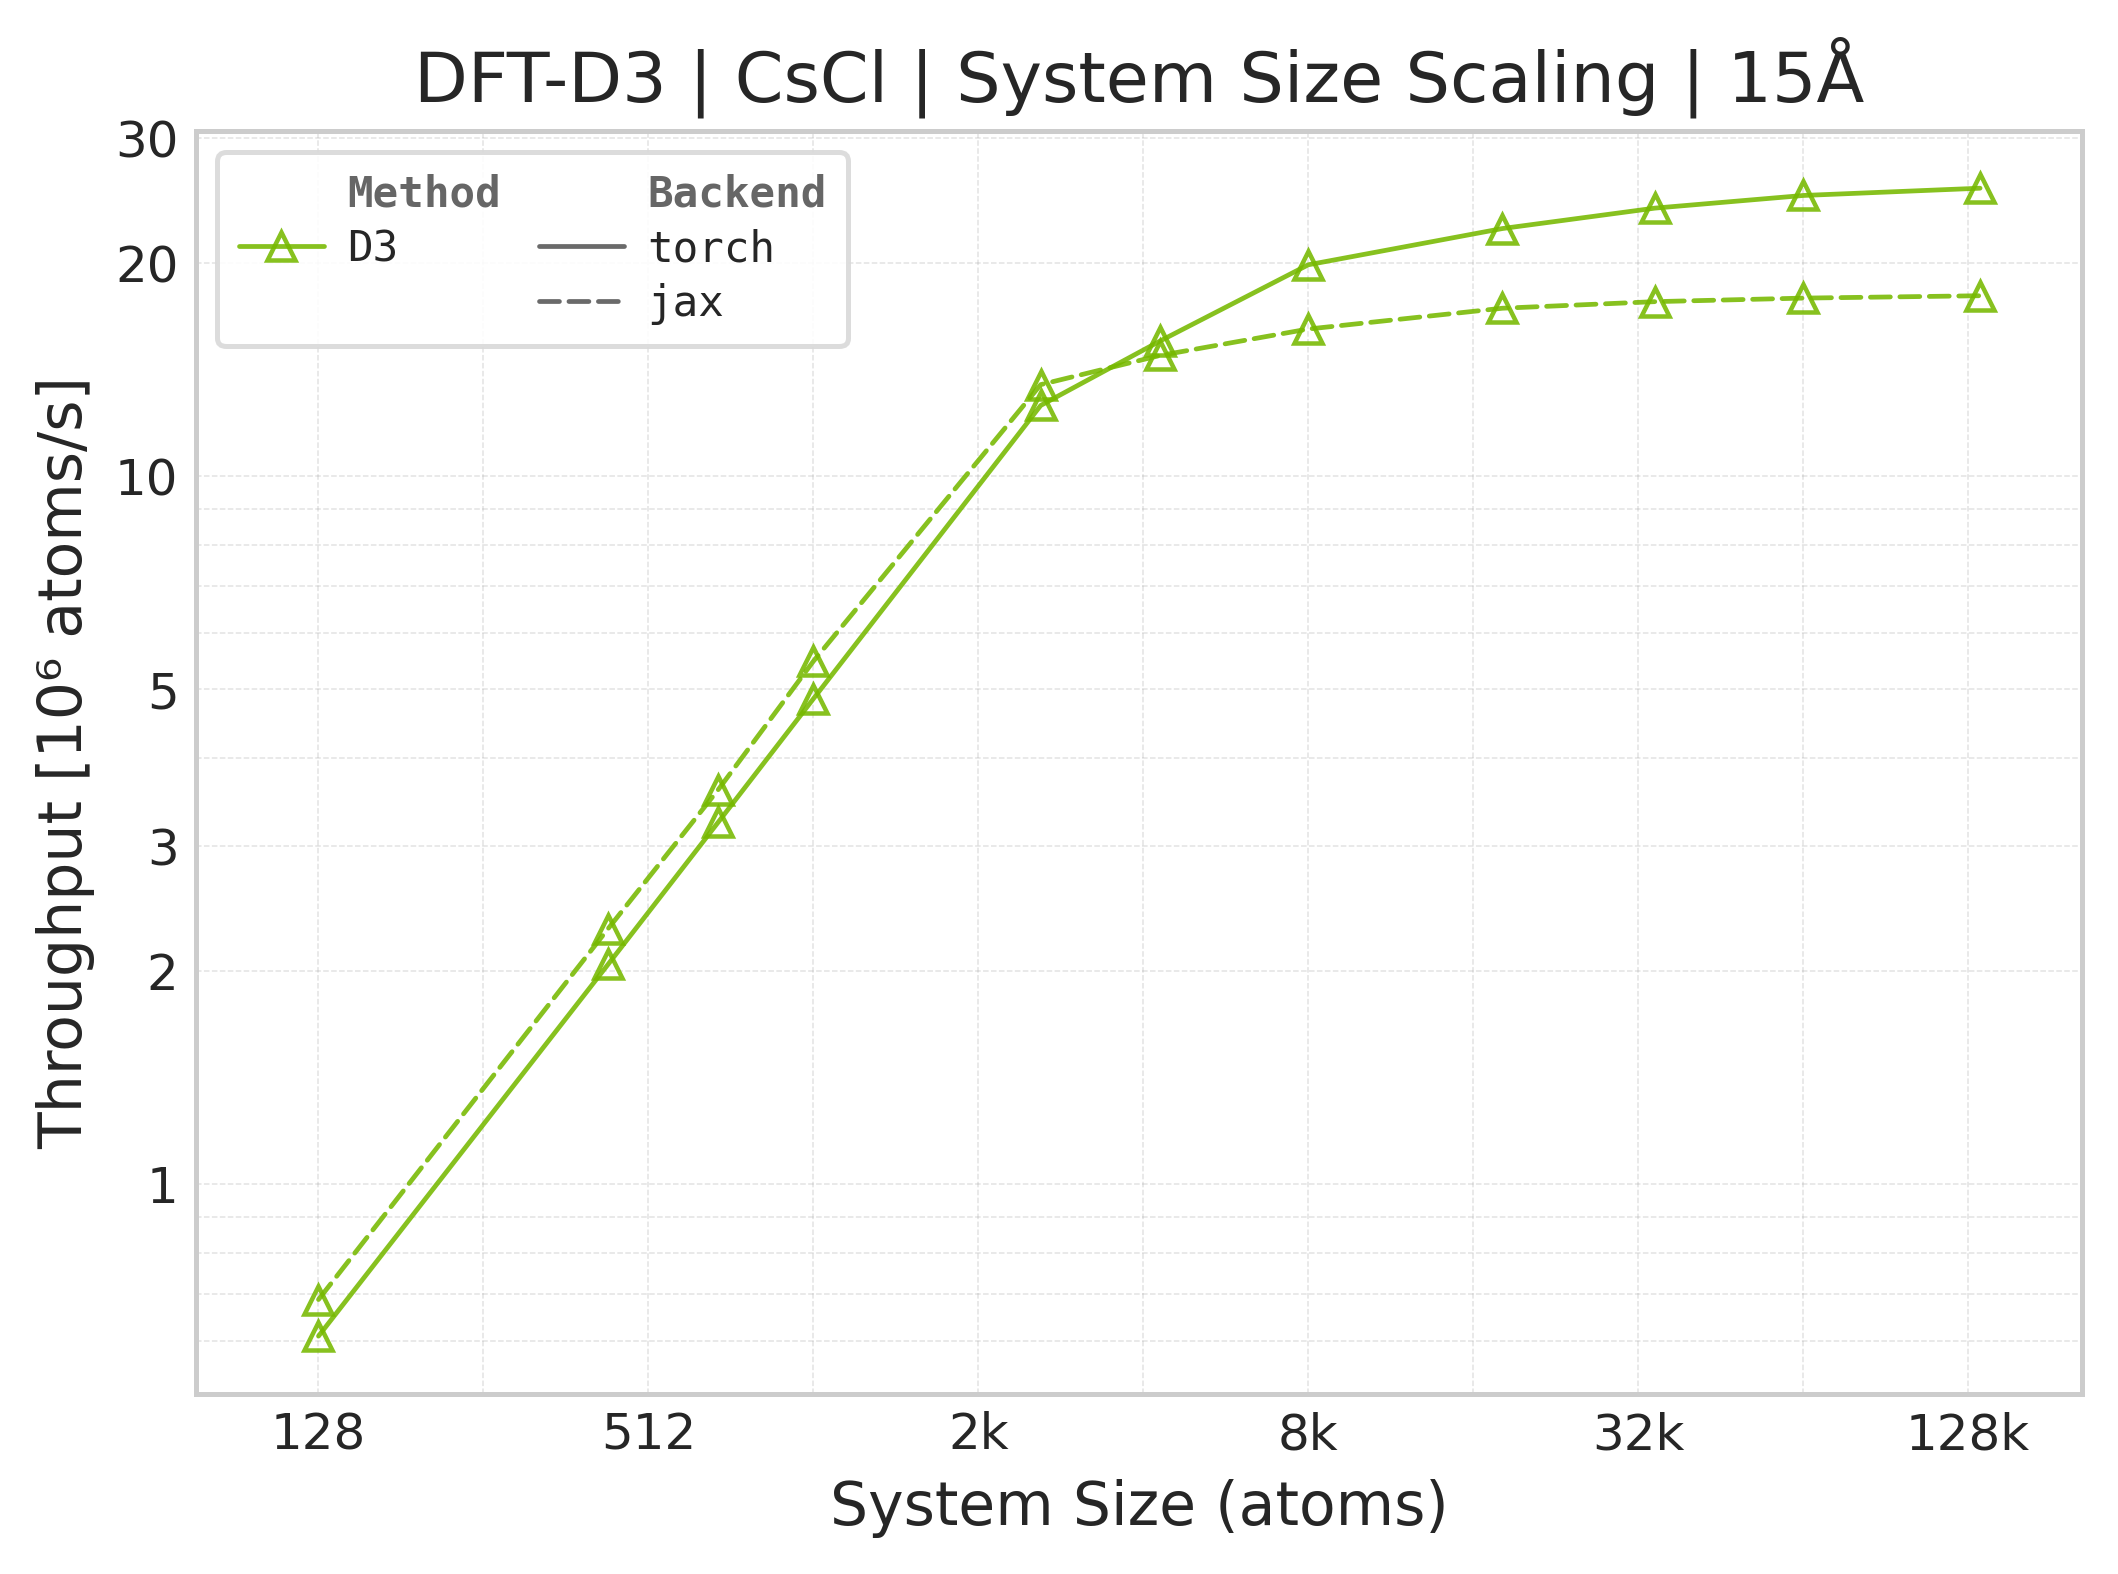
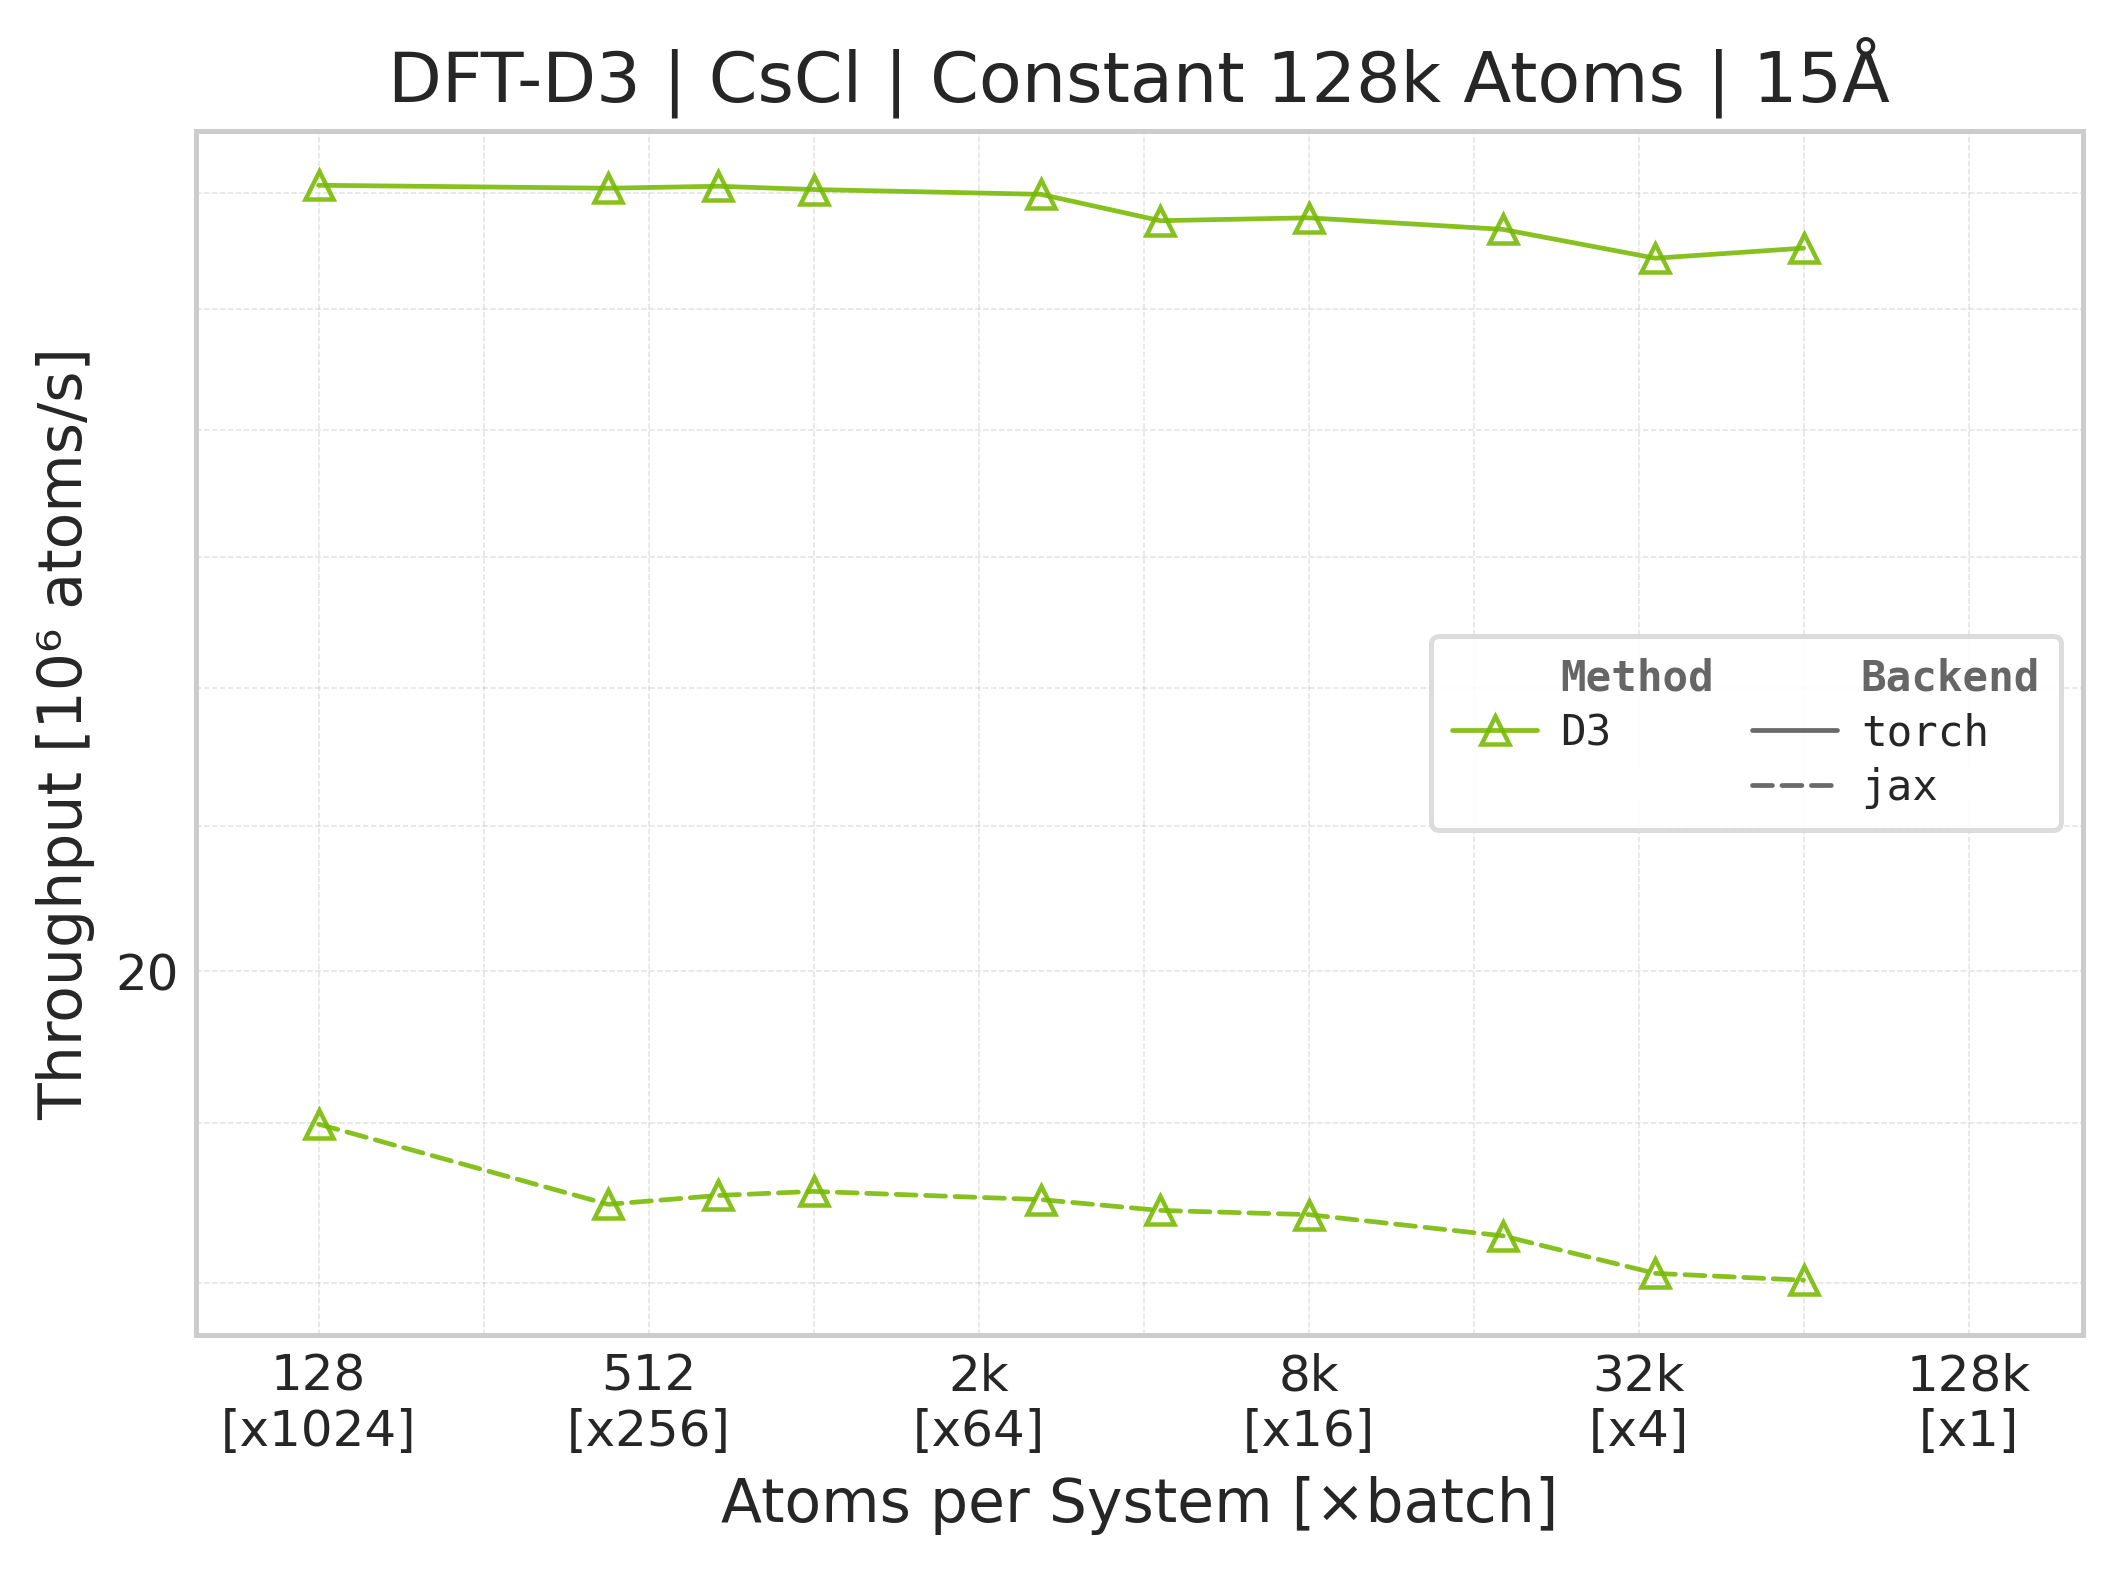
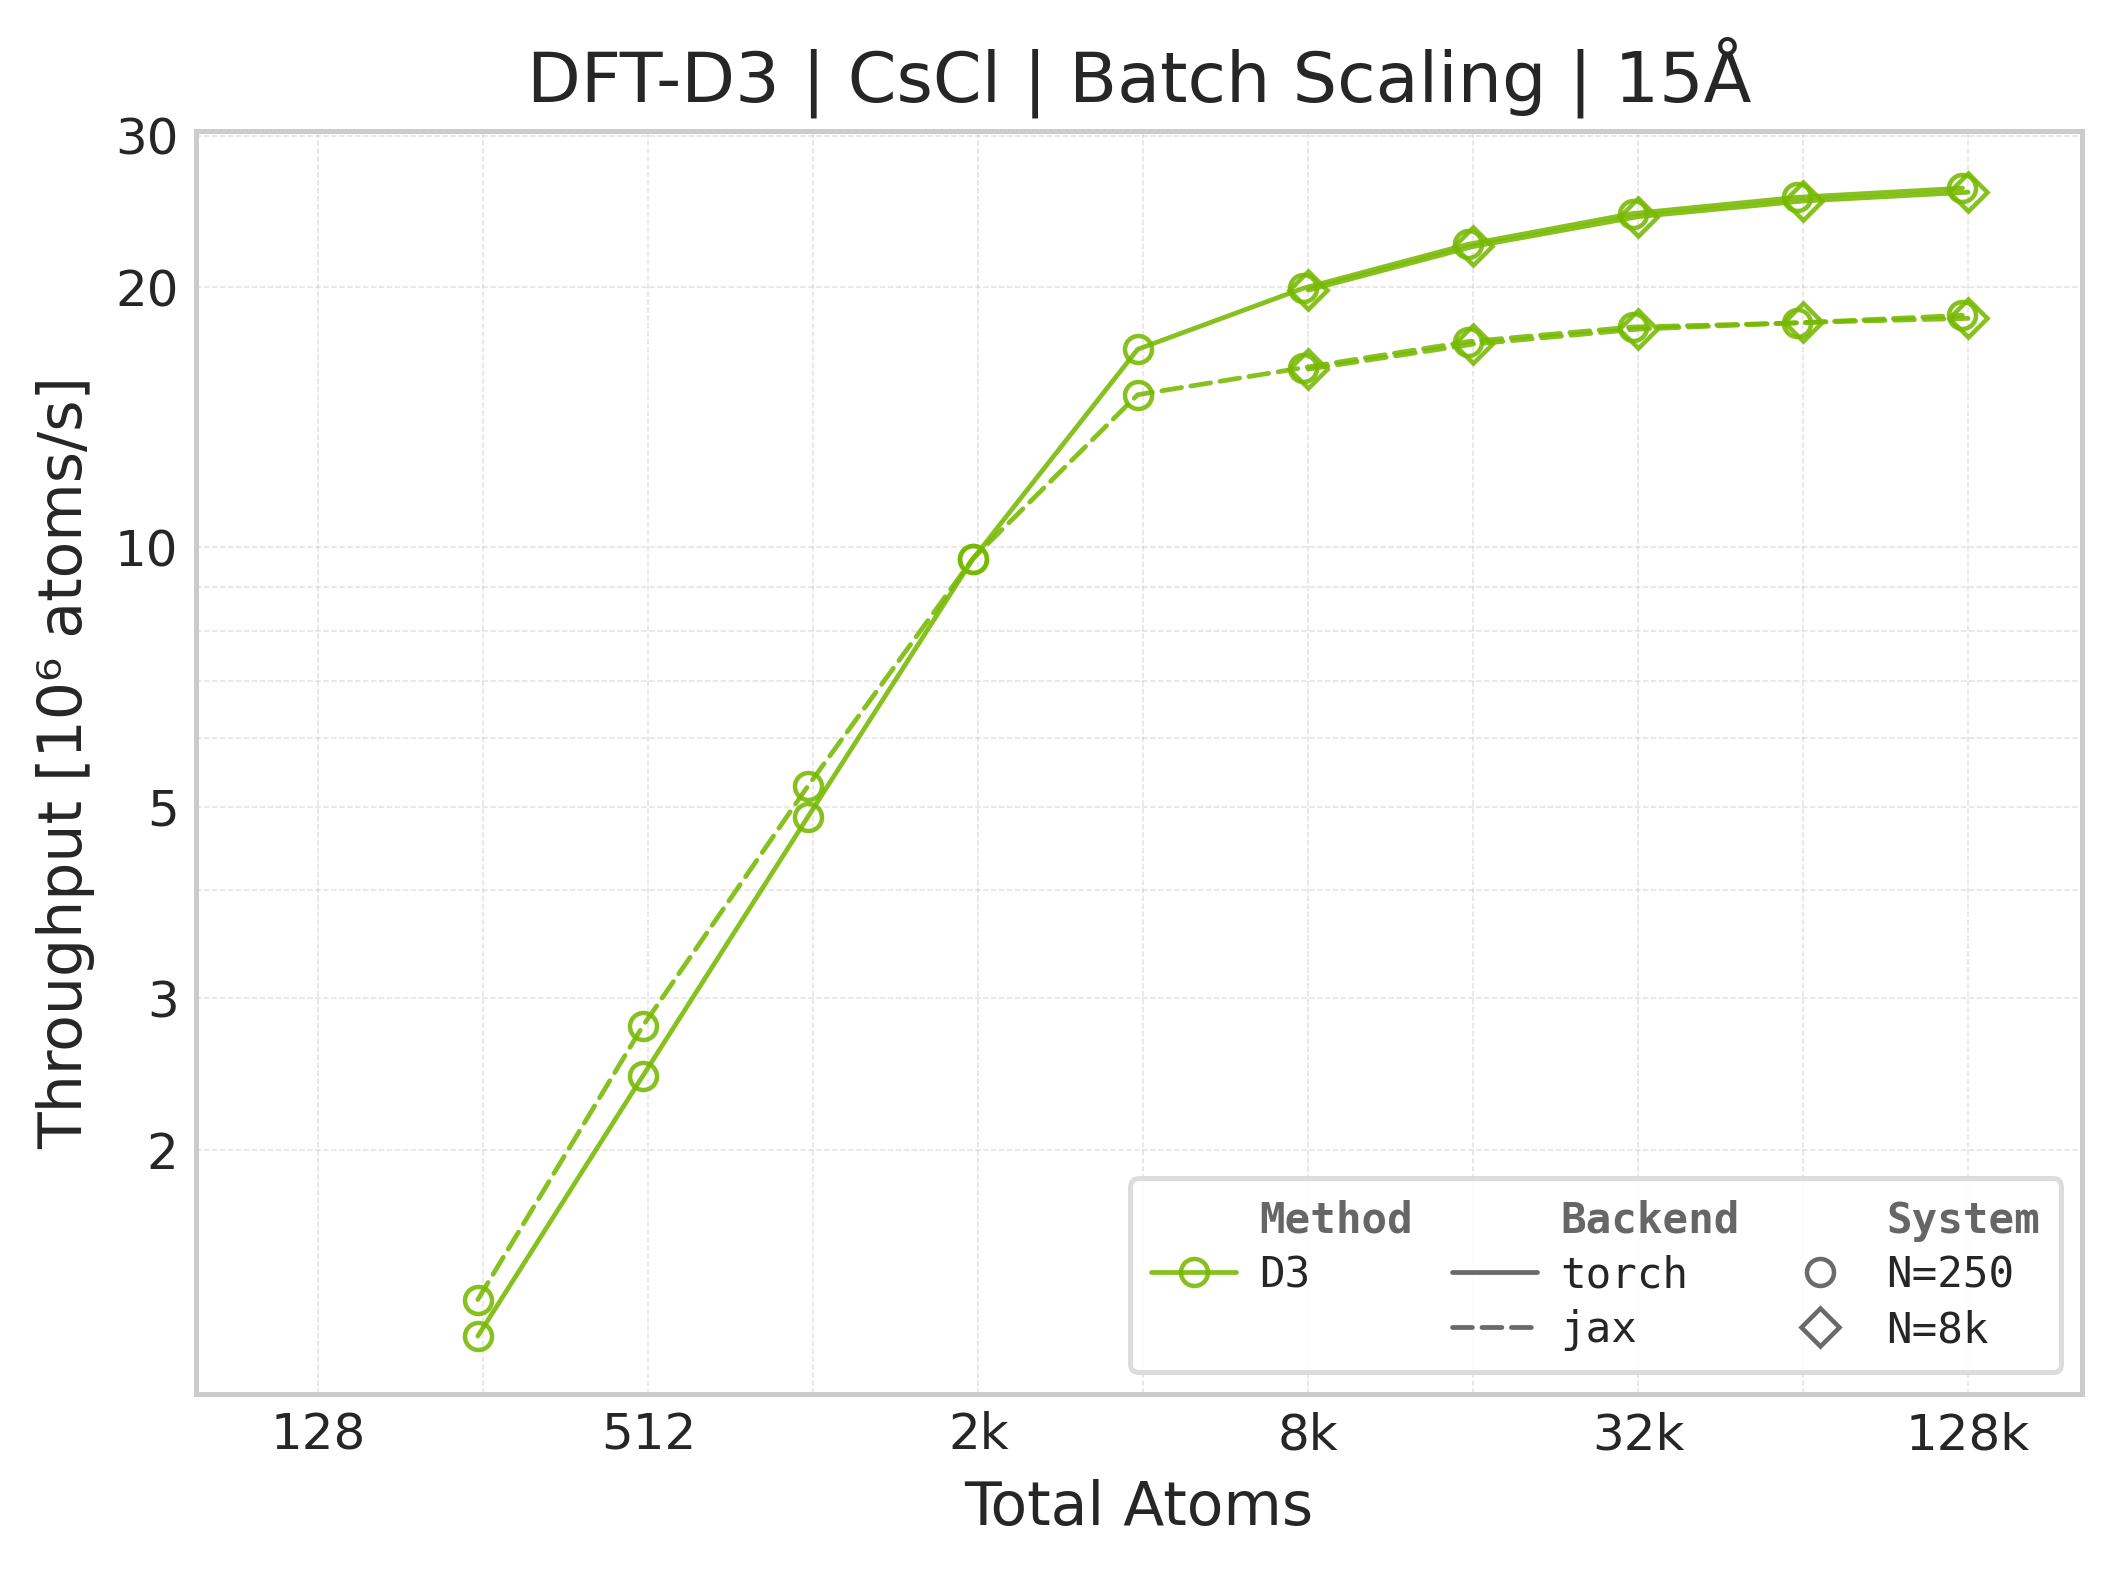
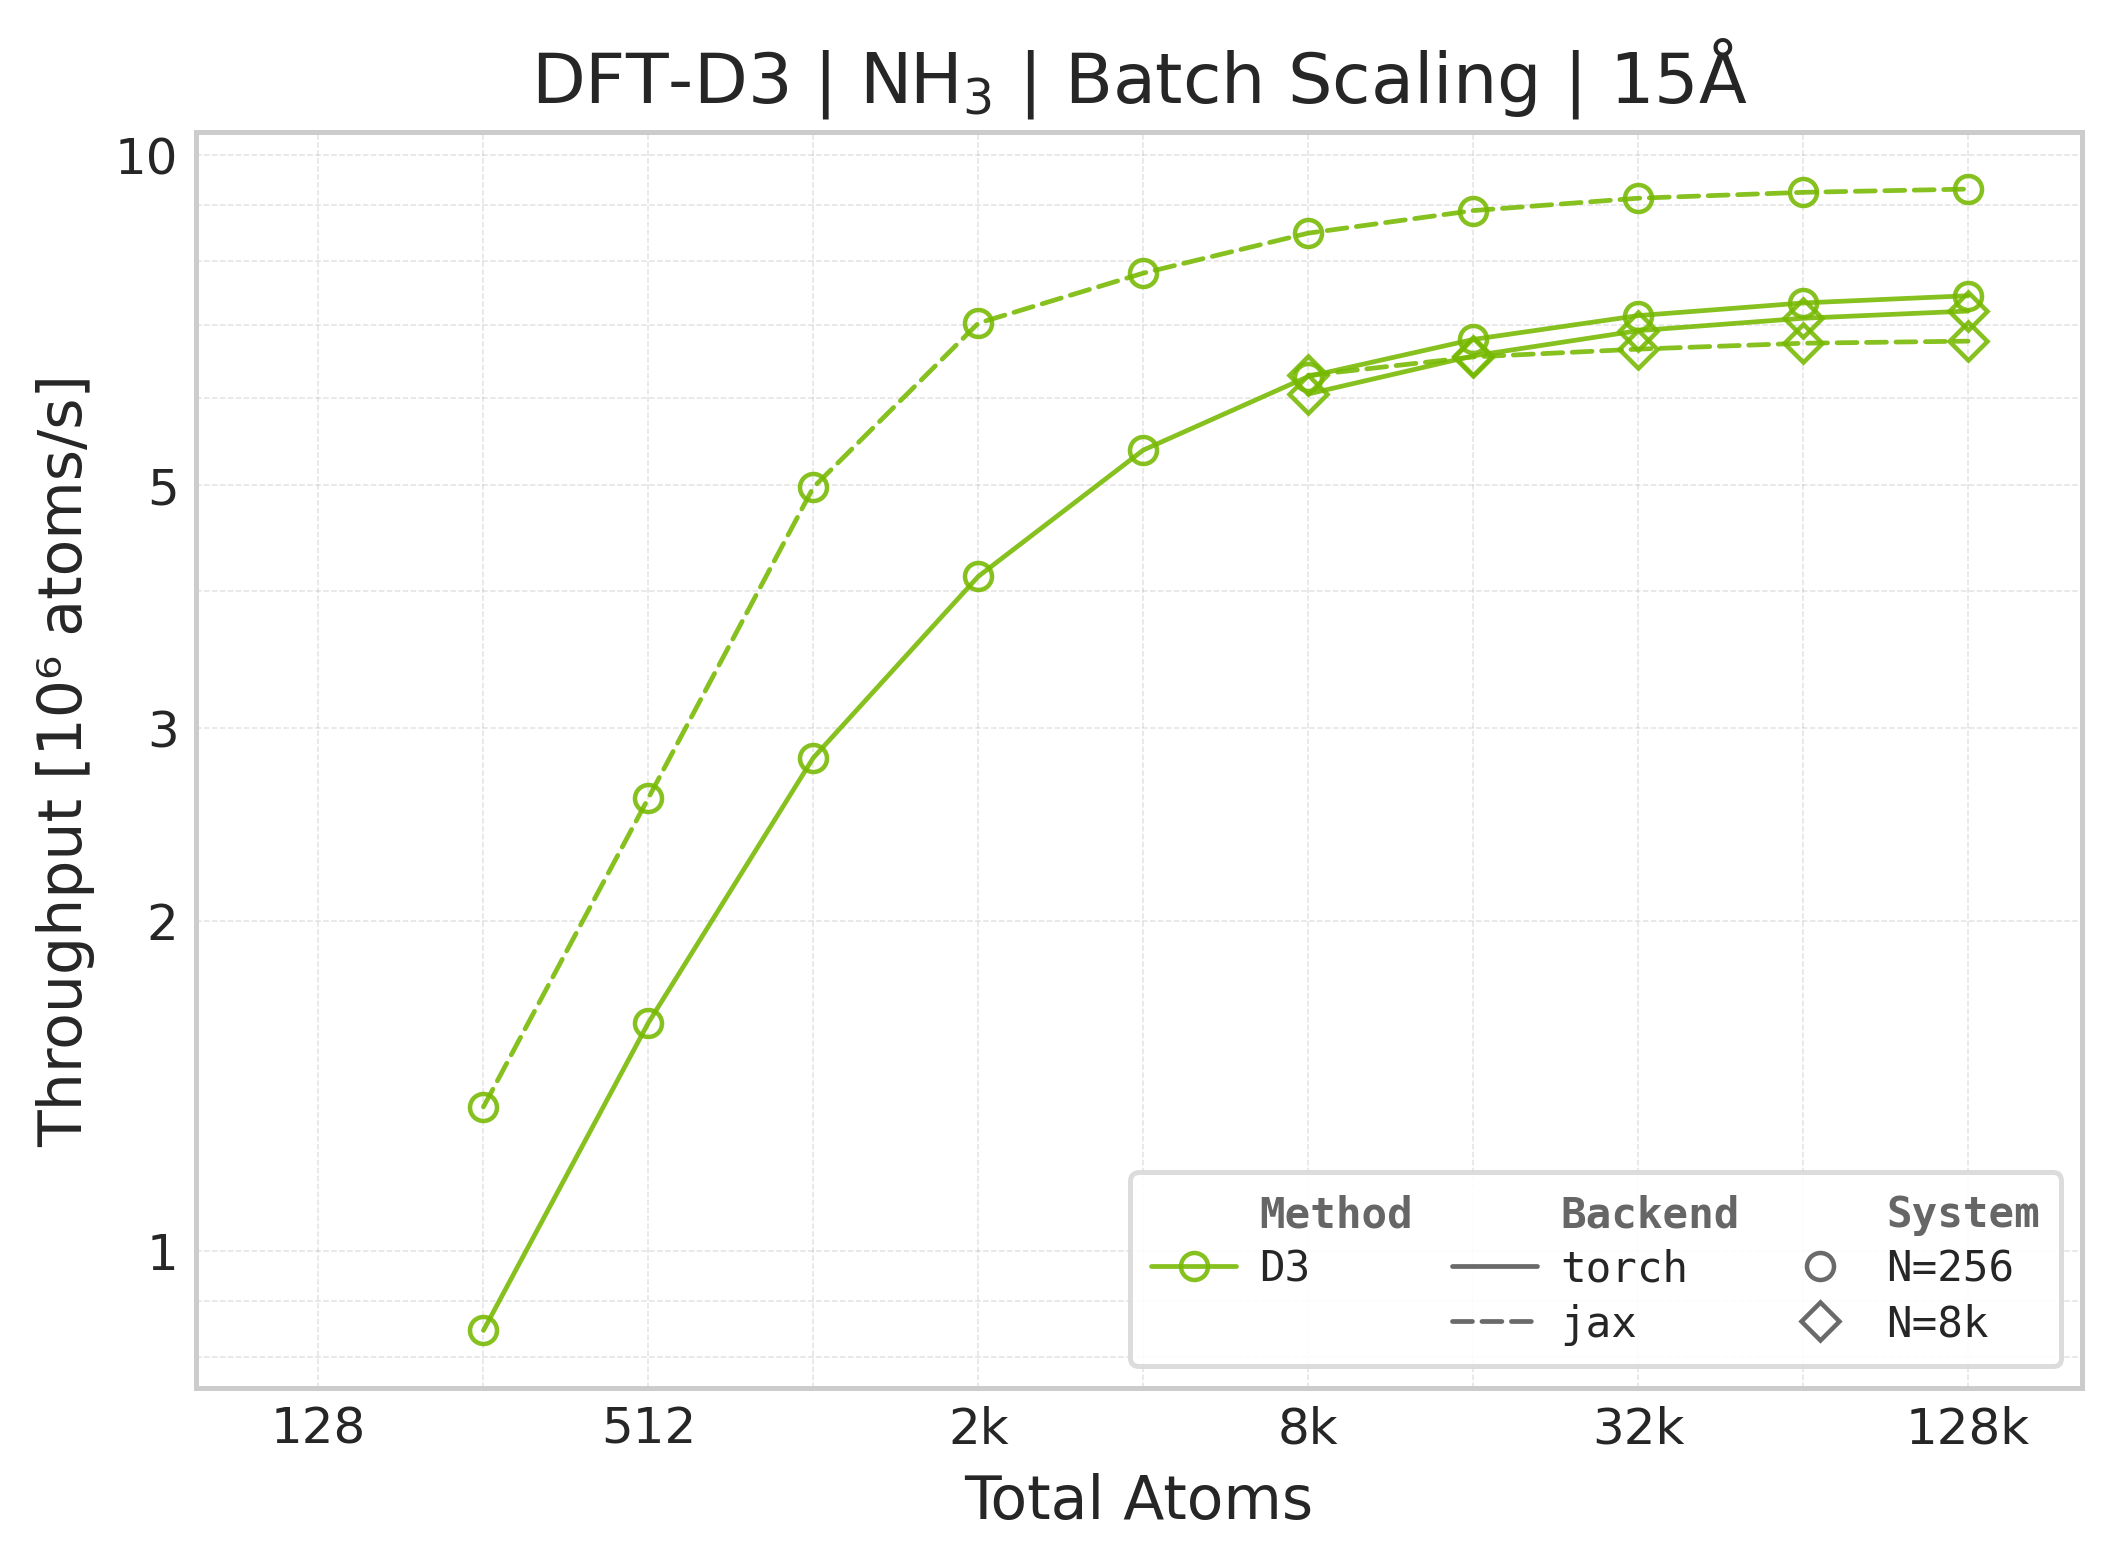
Throughput : Atoms processed per second (plotted as \(10^6\) atoms/s). Higher is better. This indicates the scaling point where the GPU saturates.
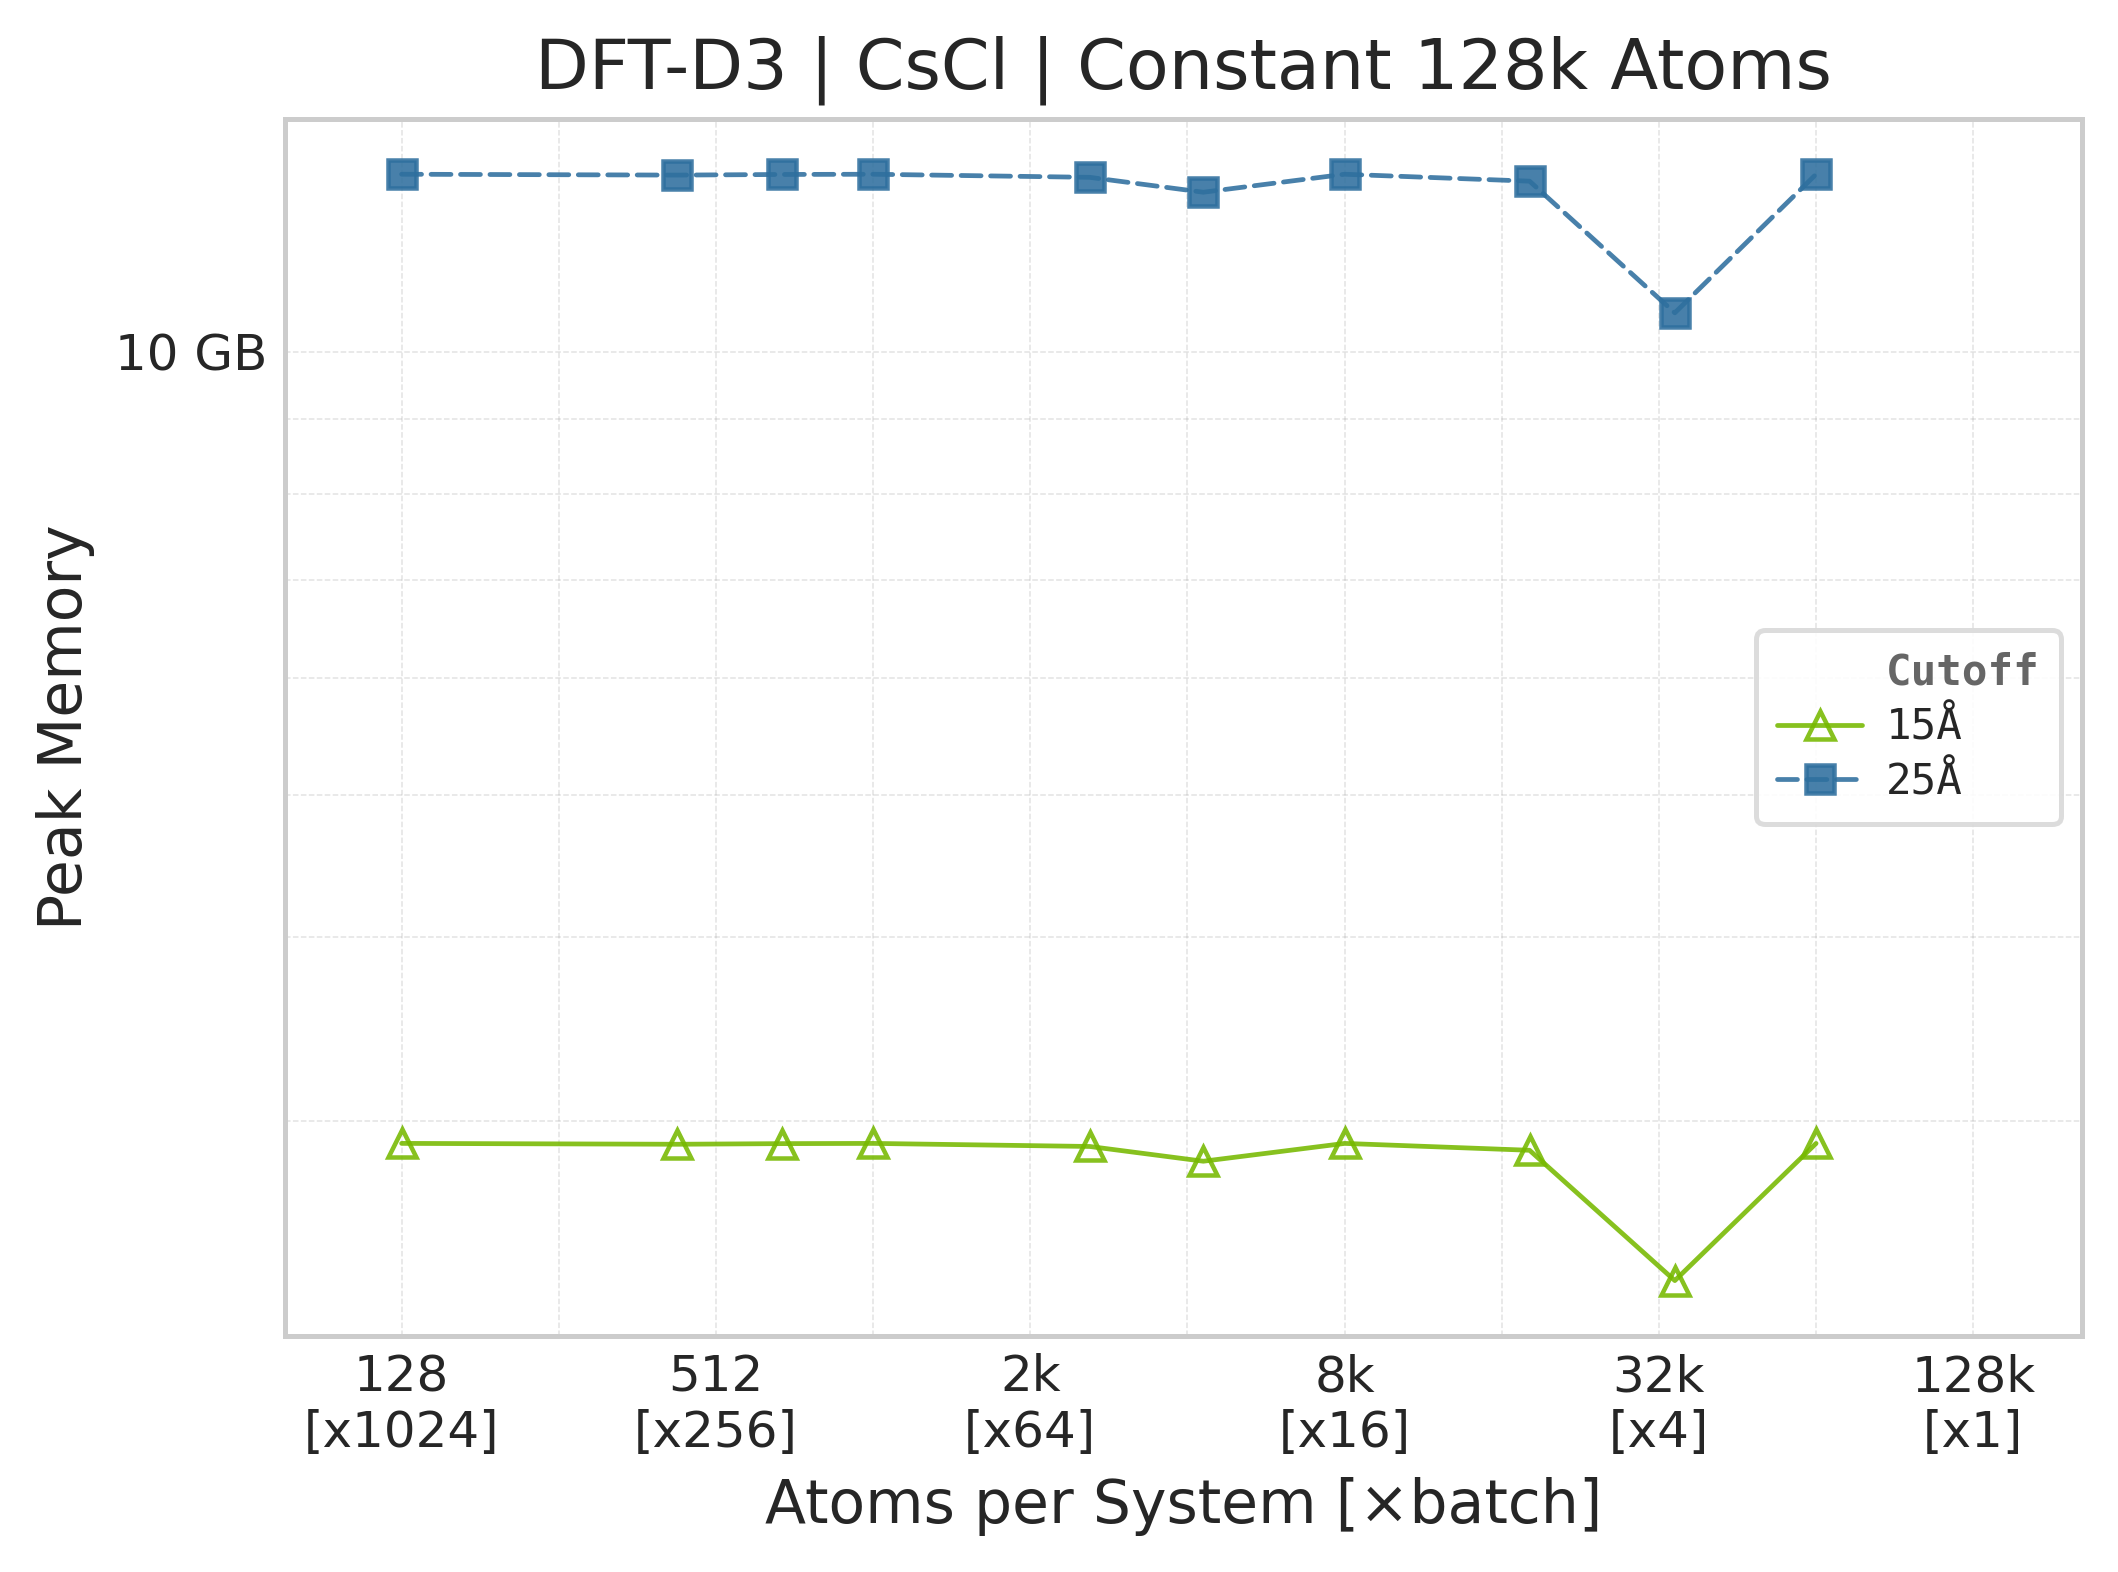
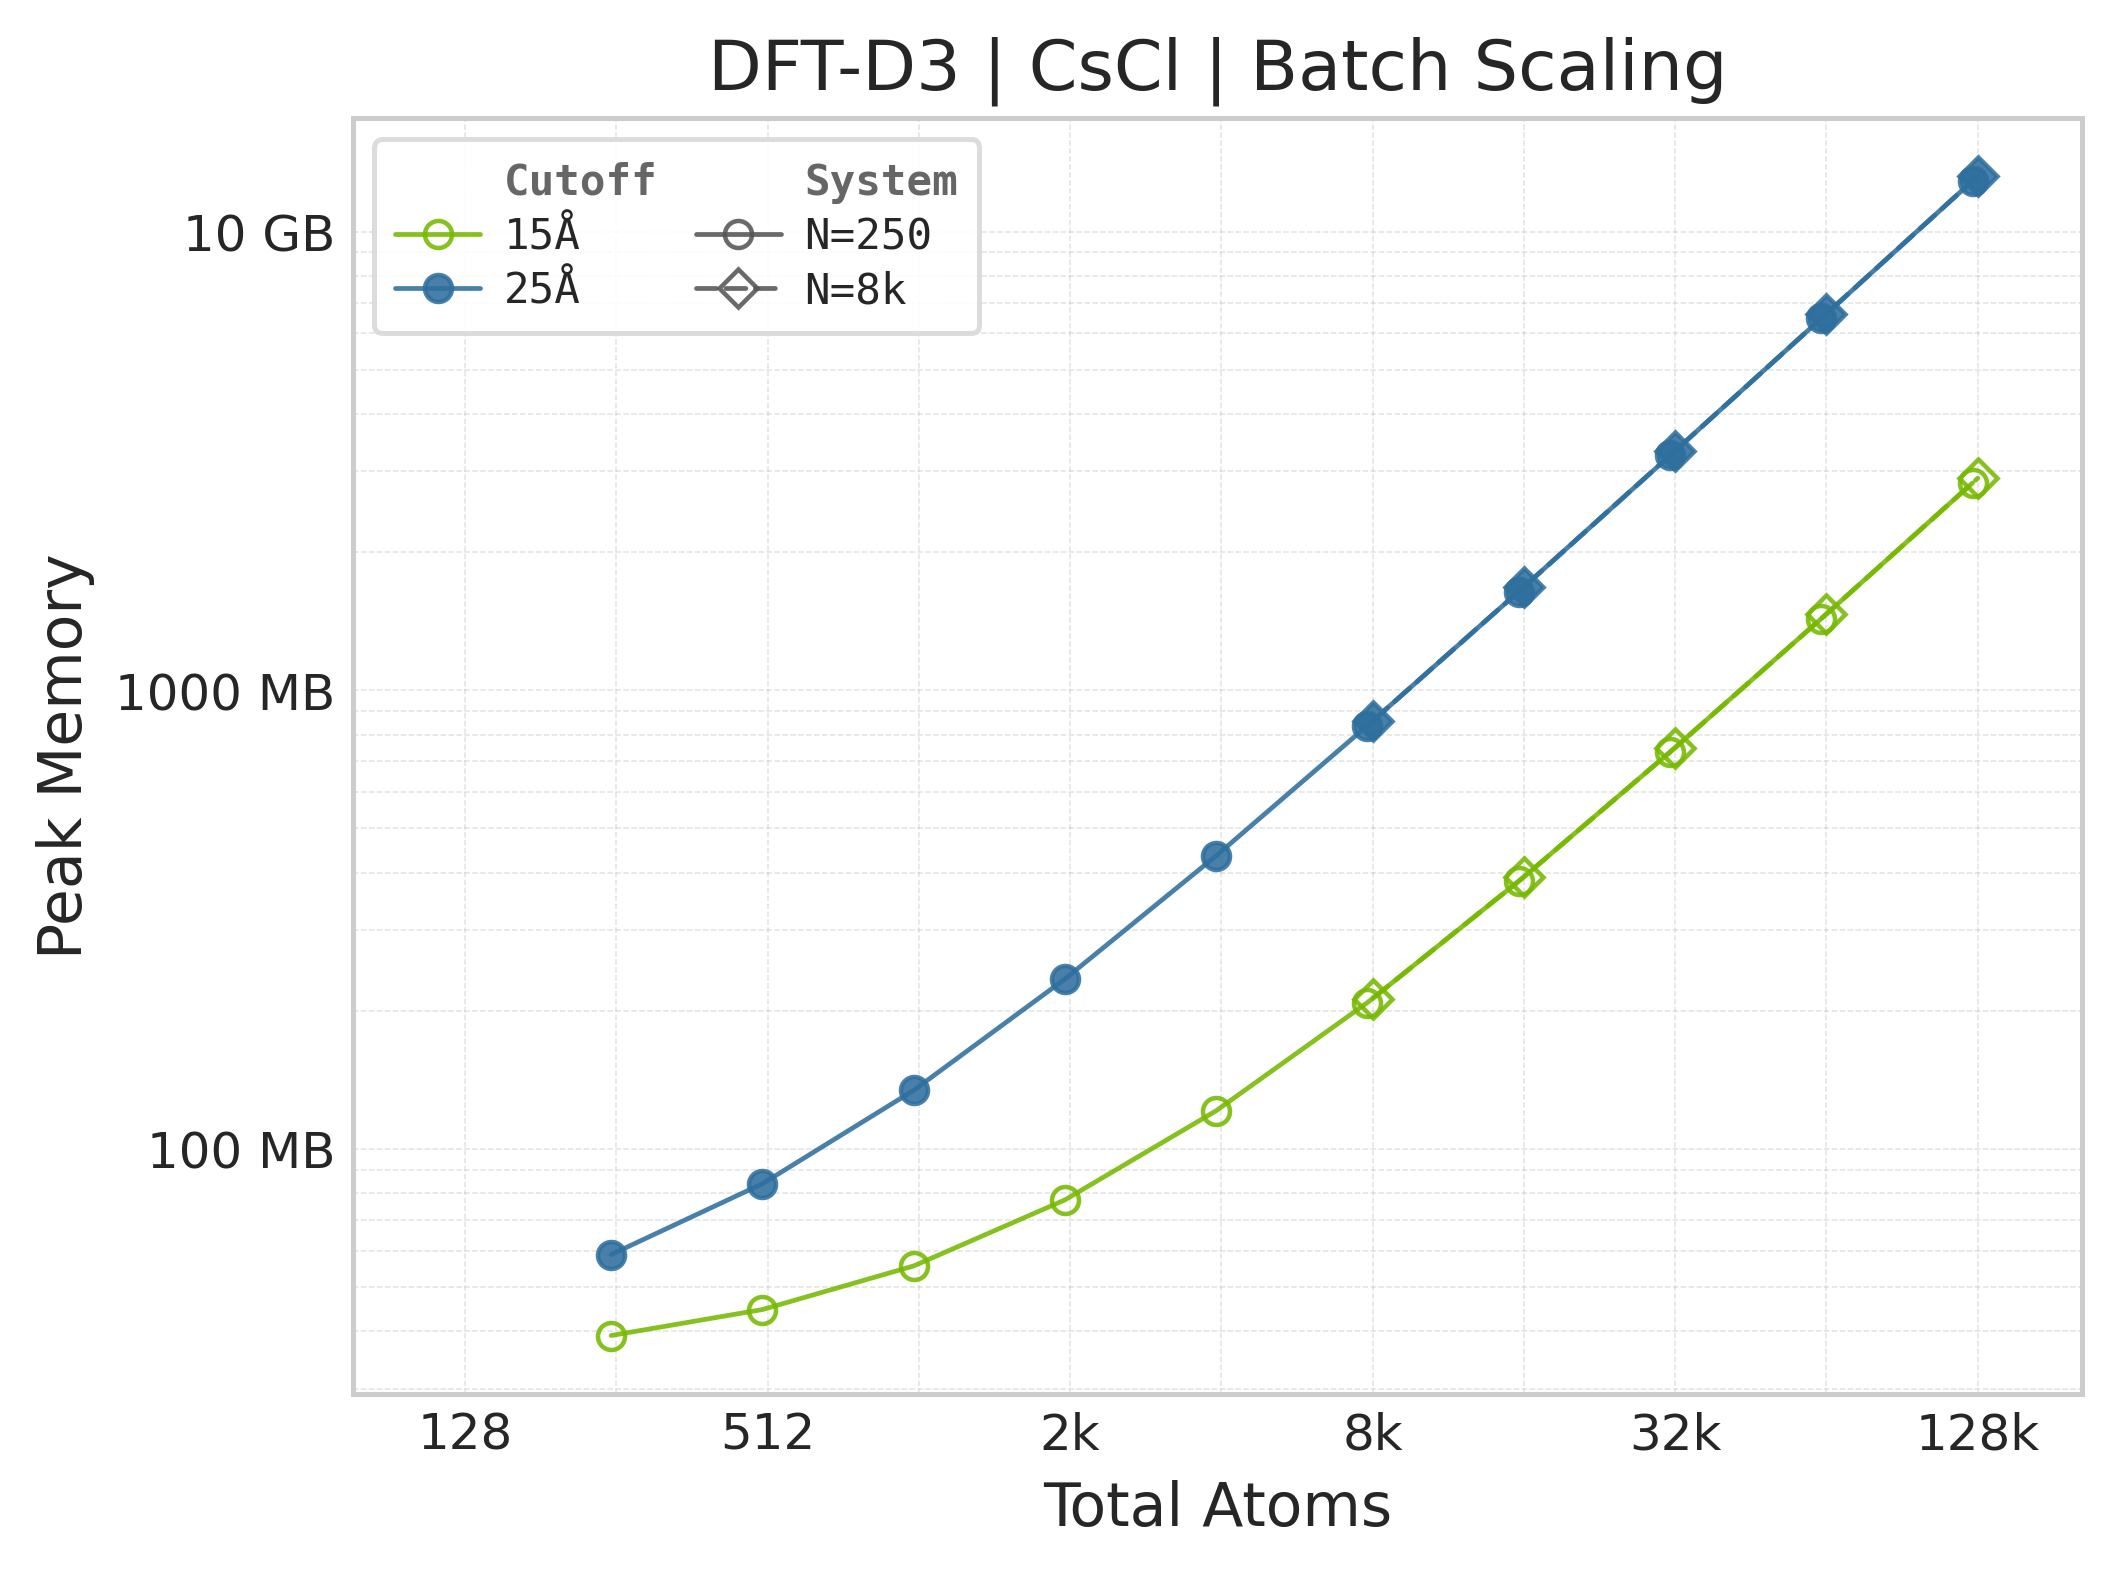
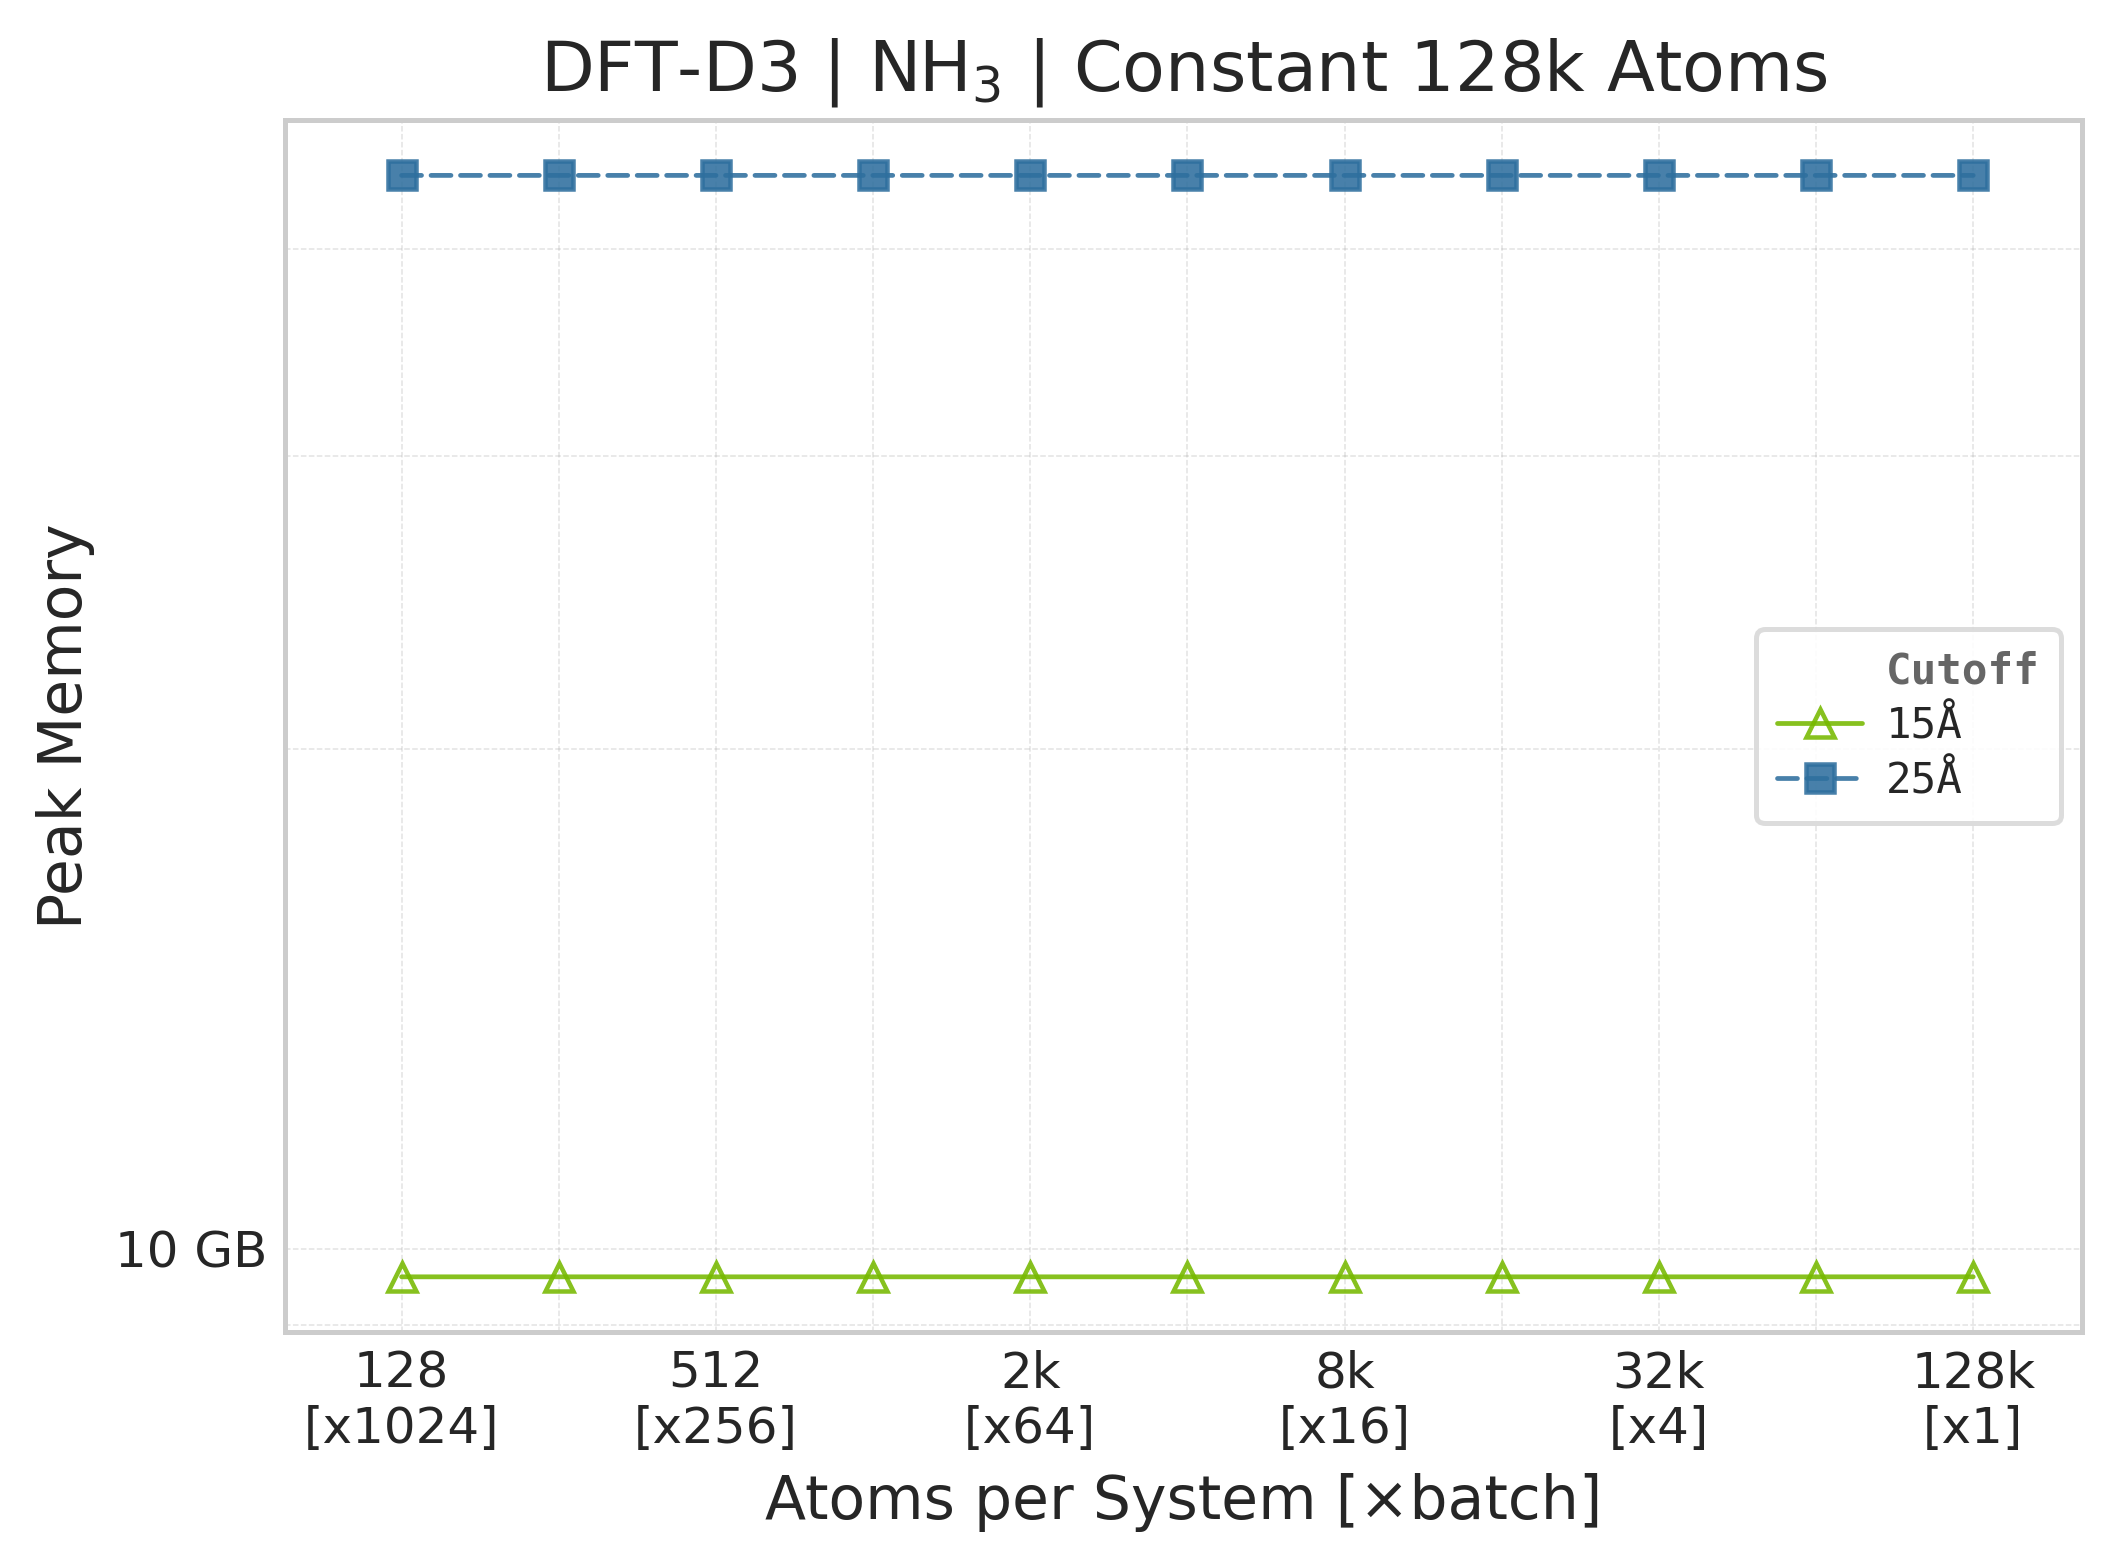
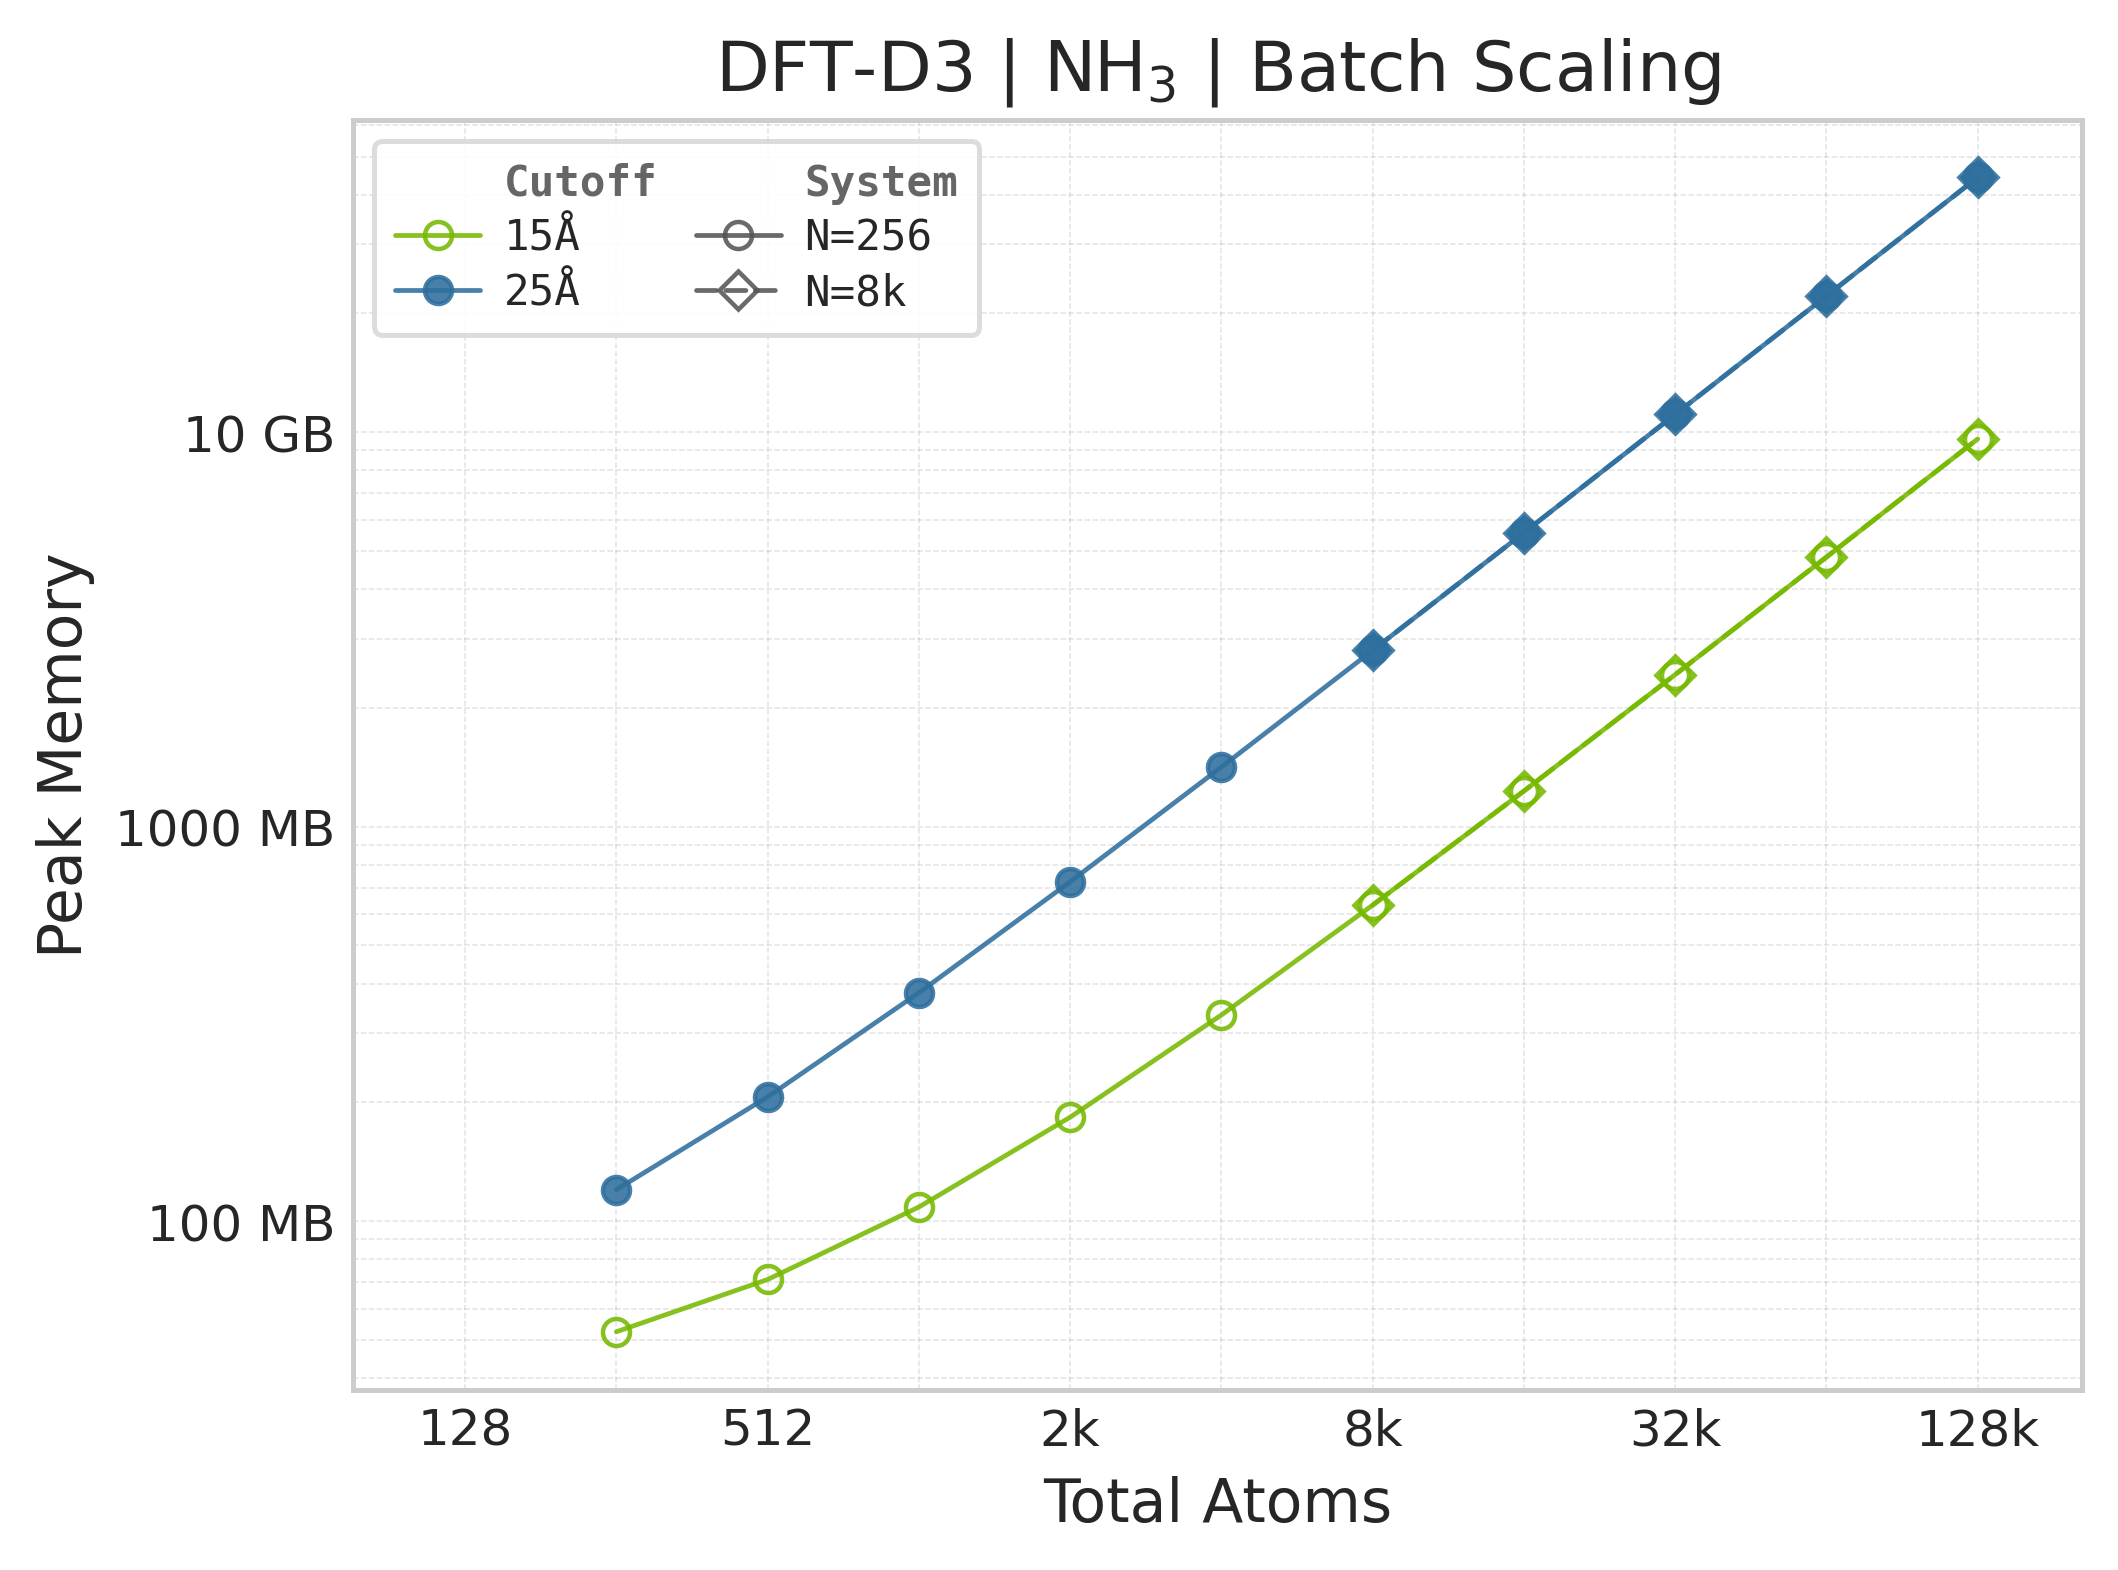
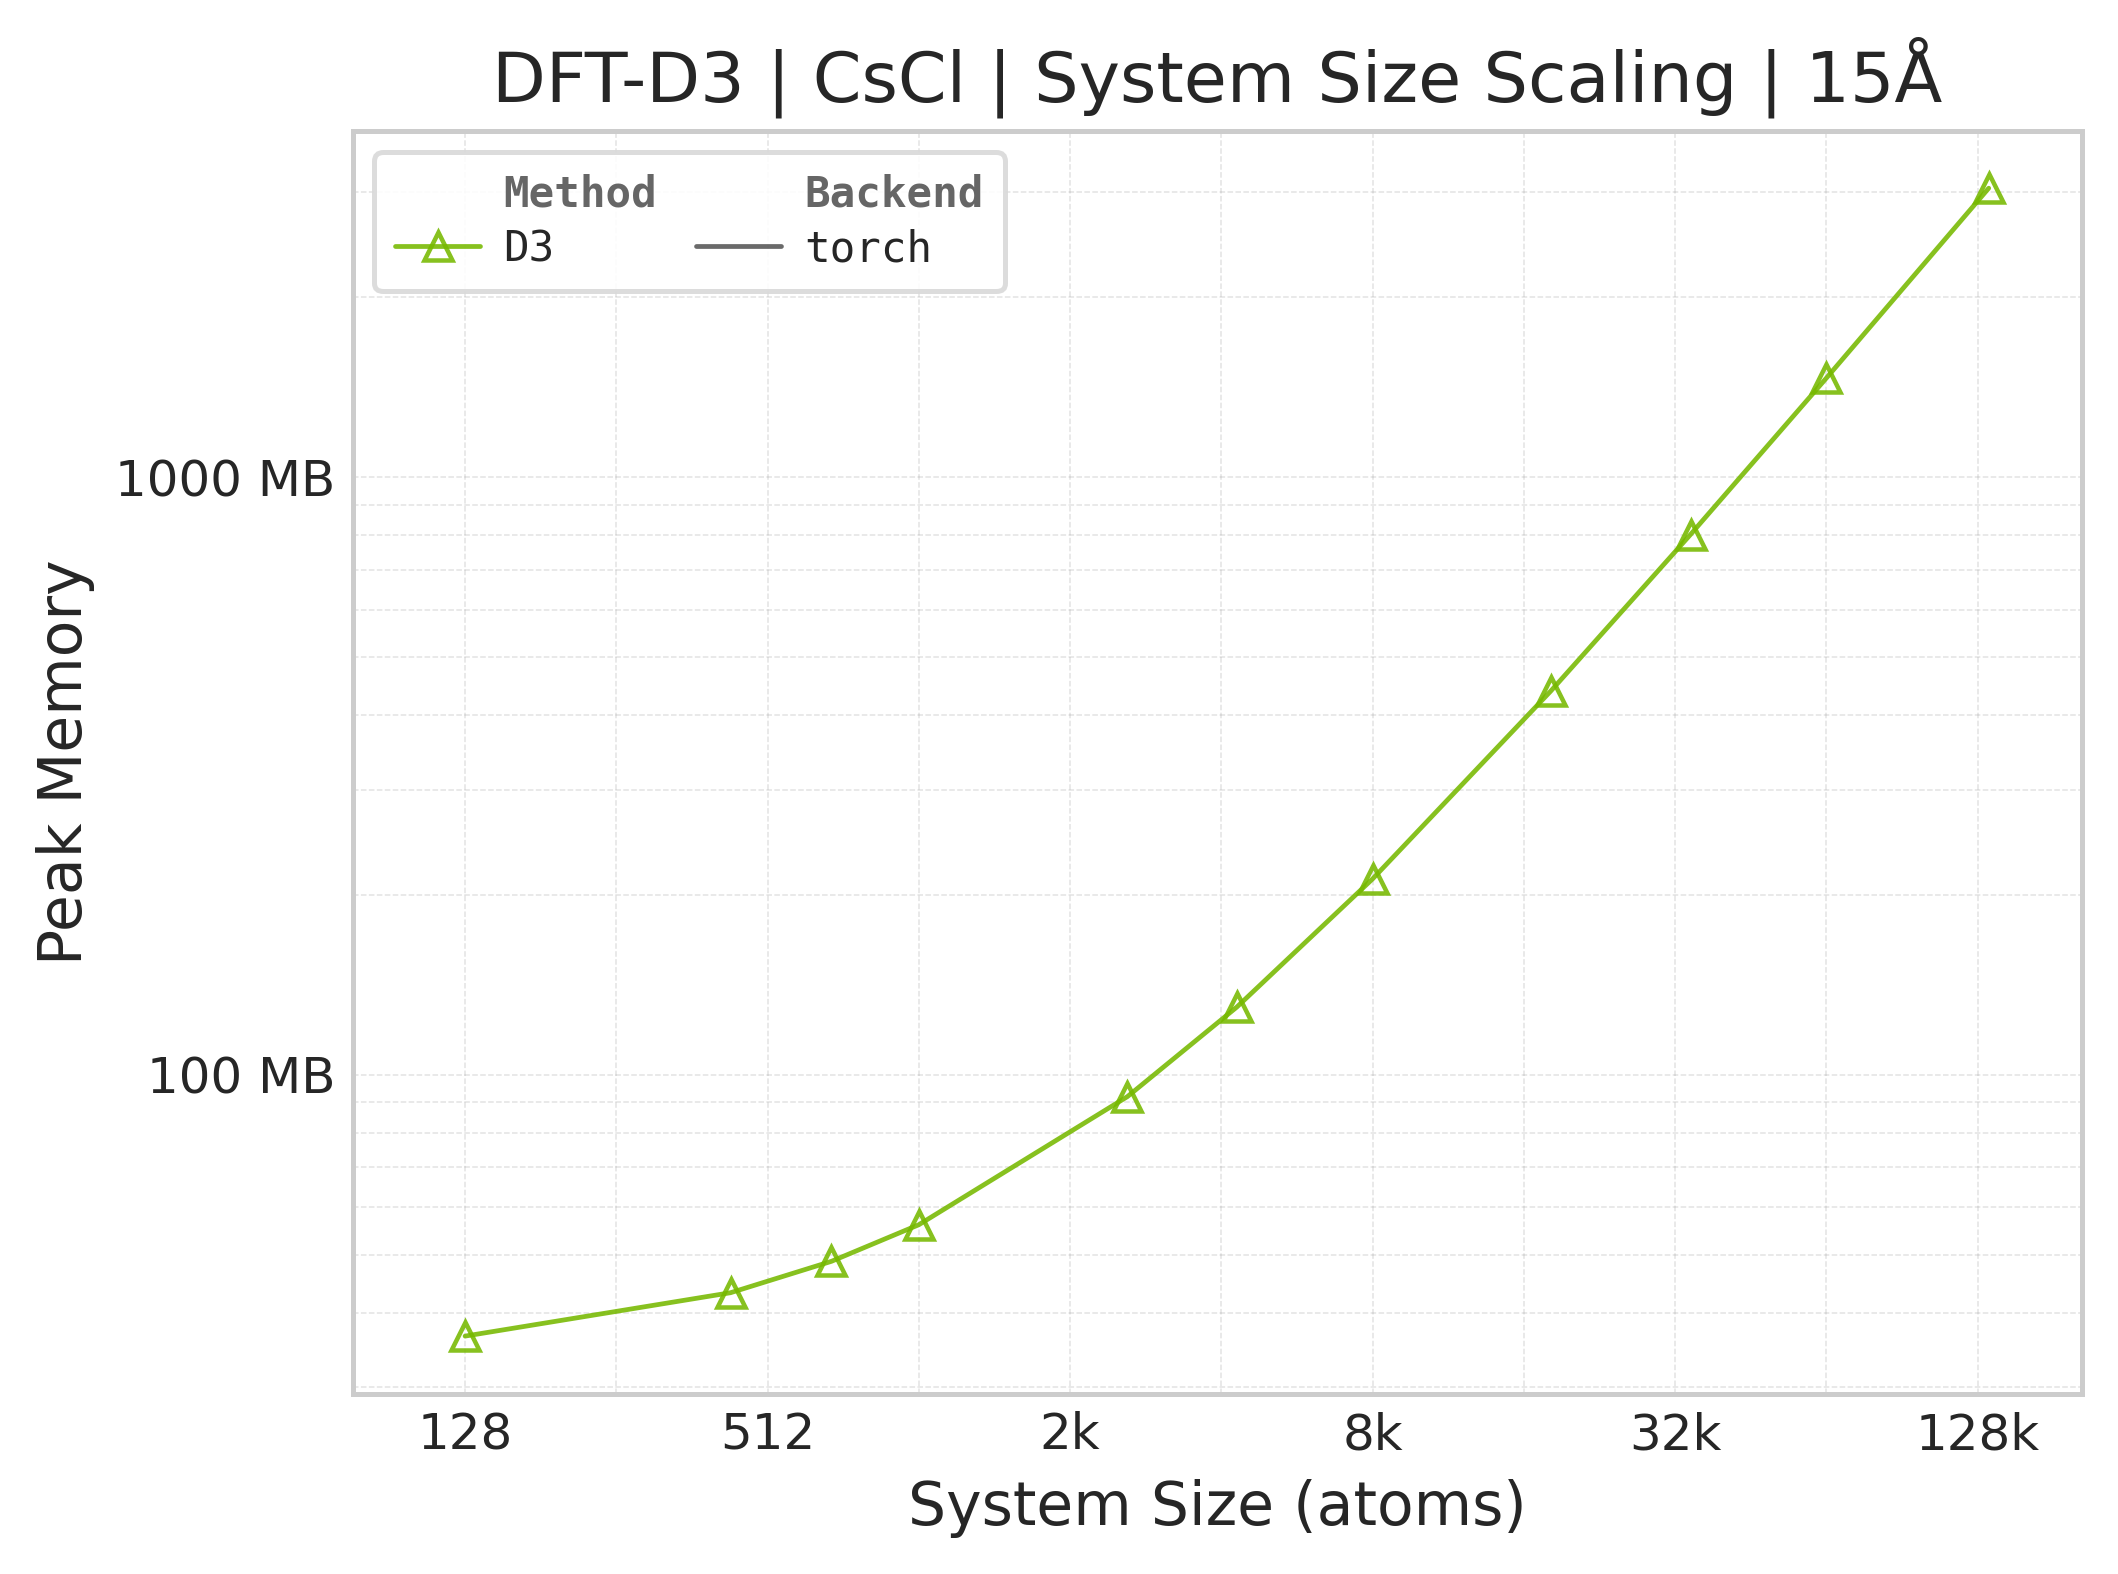
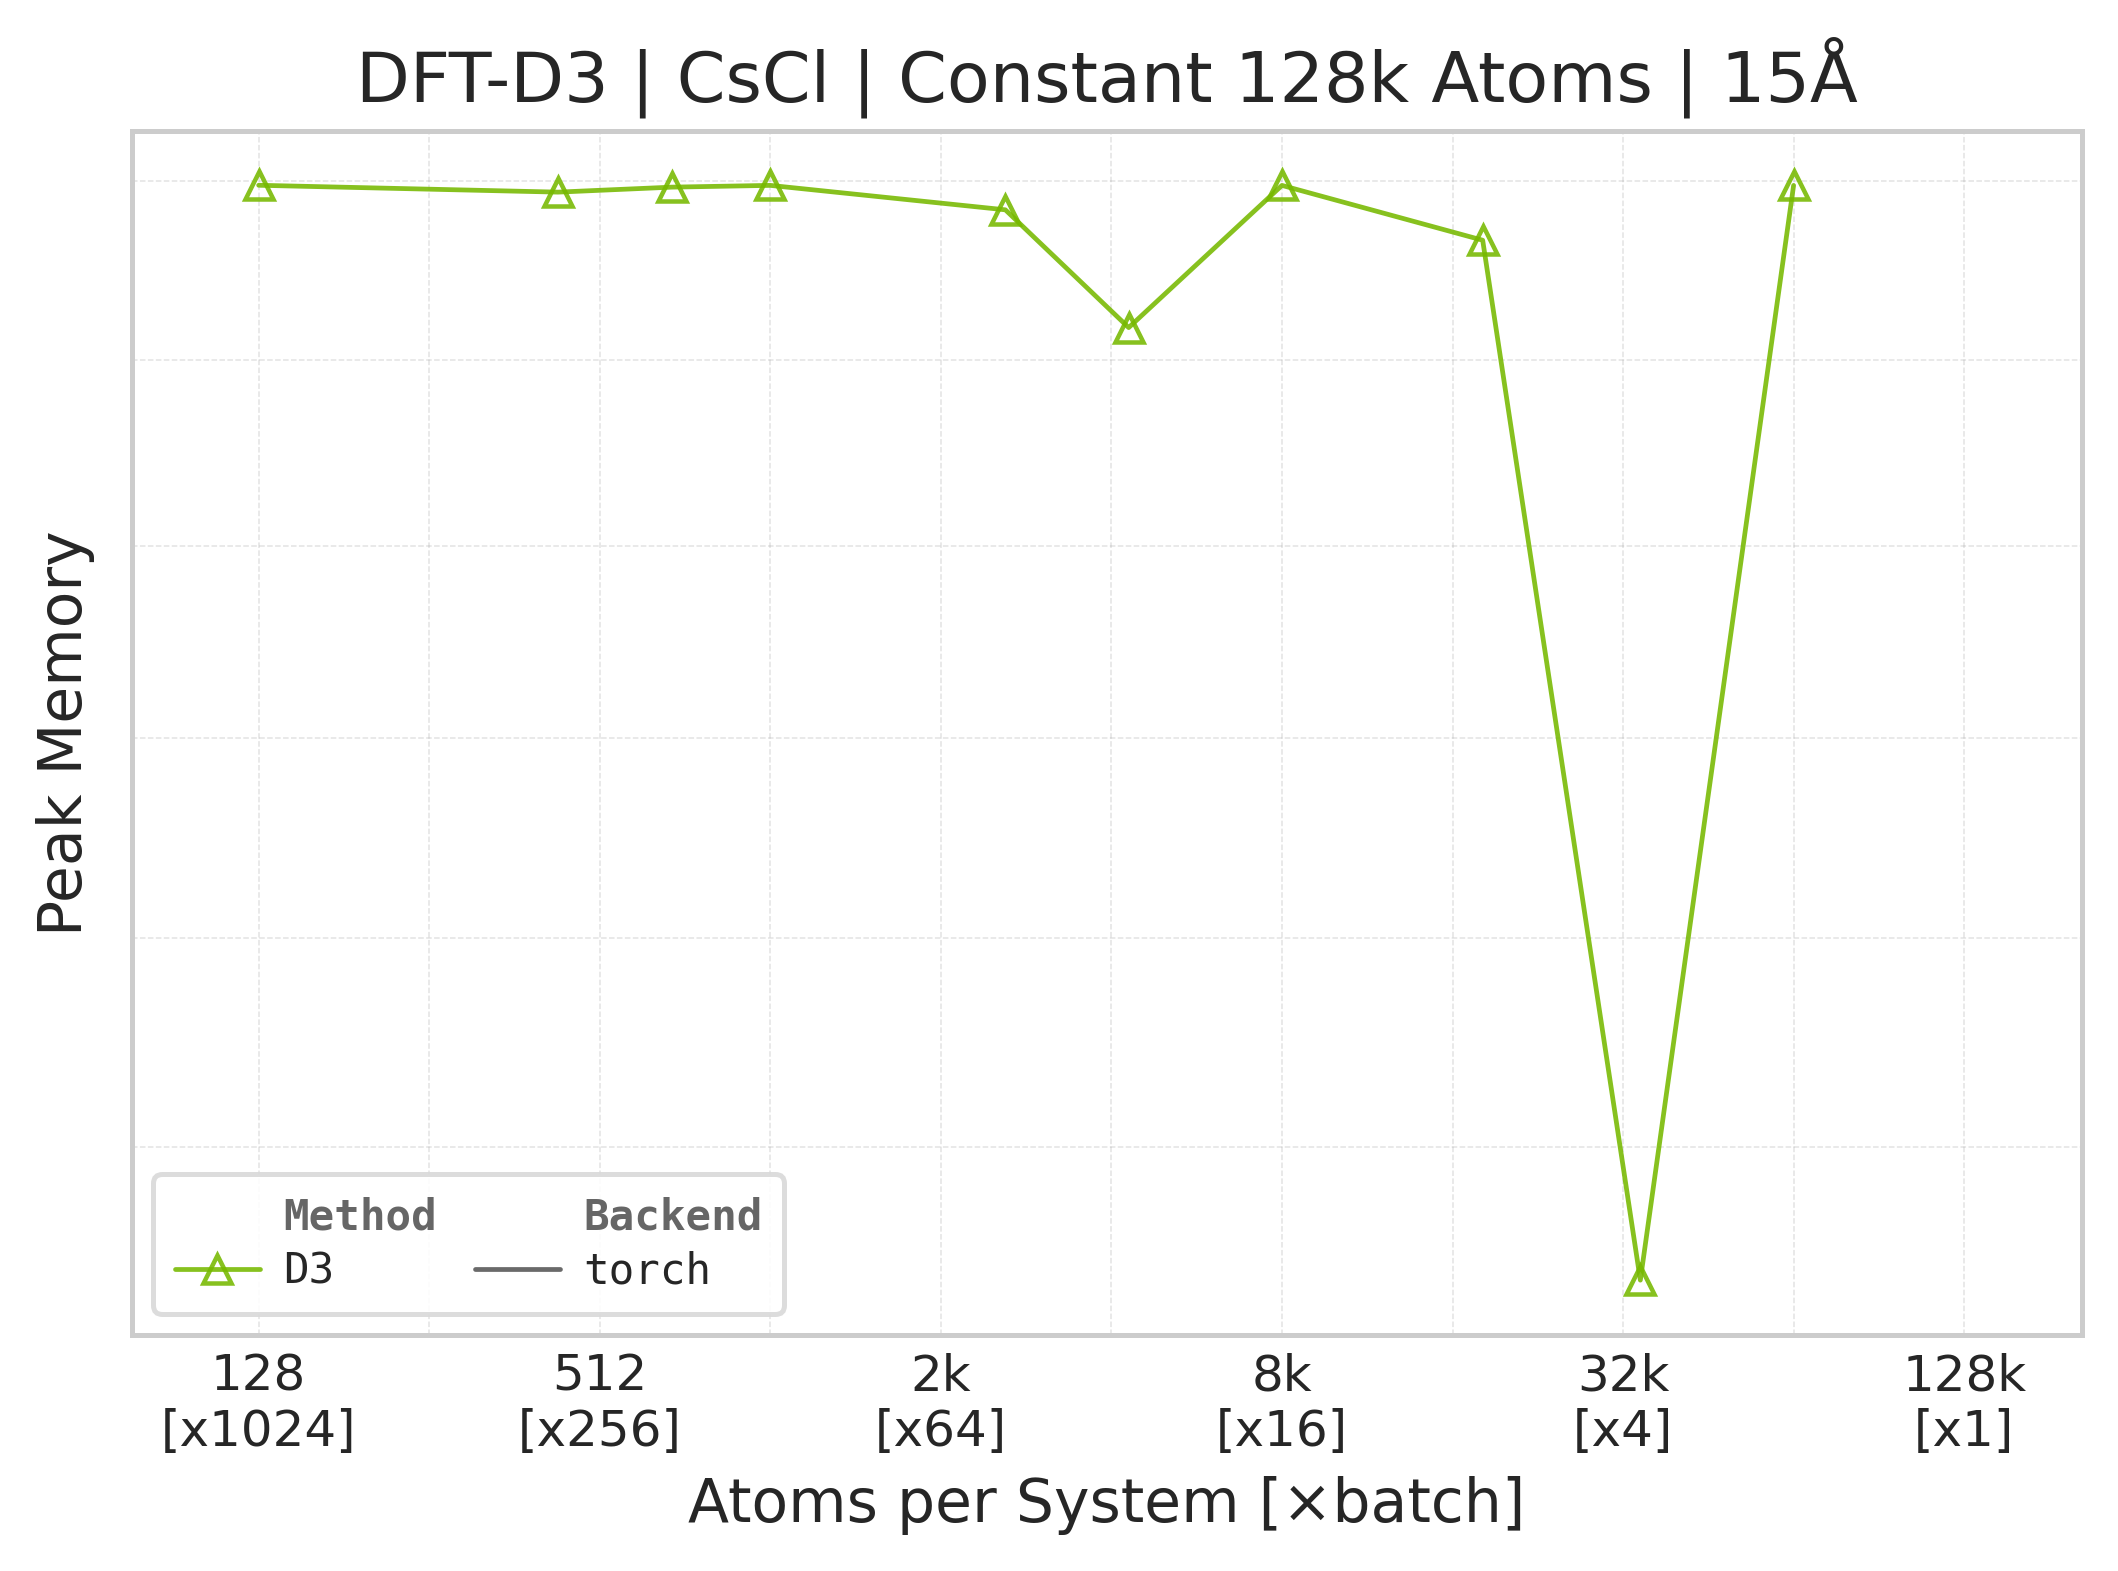
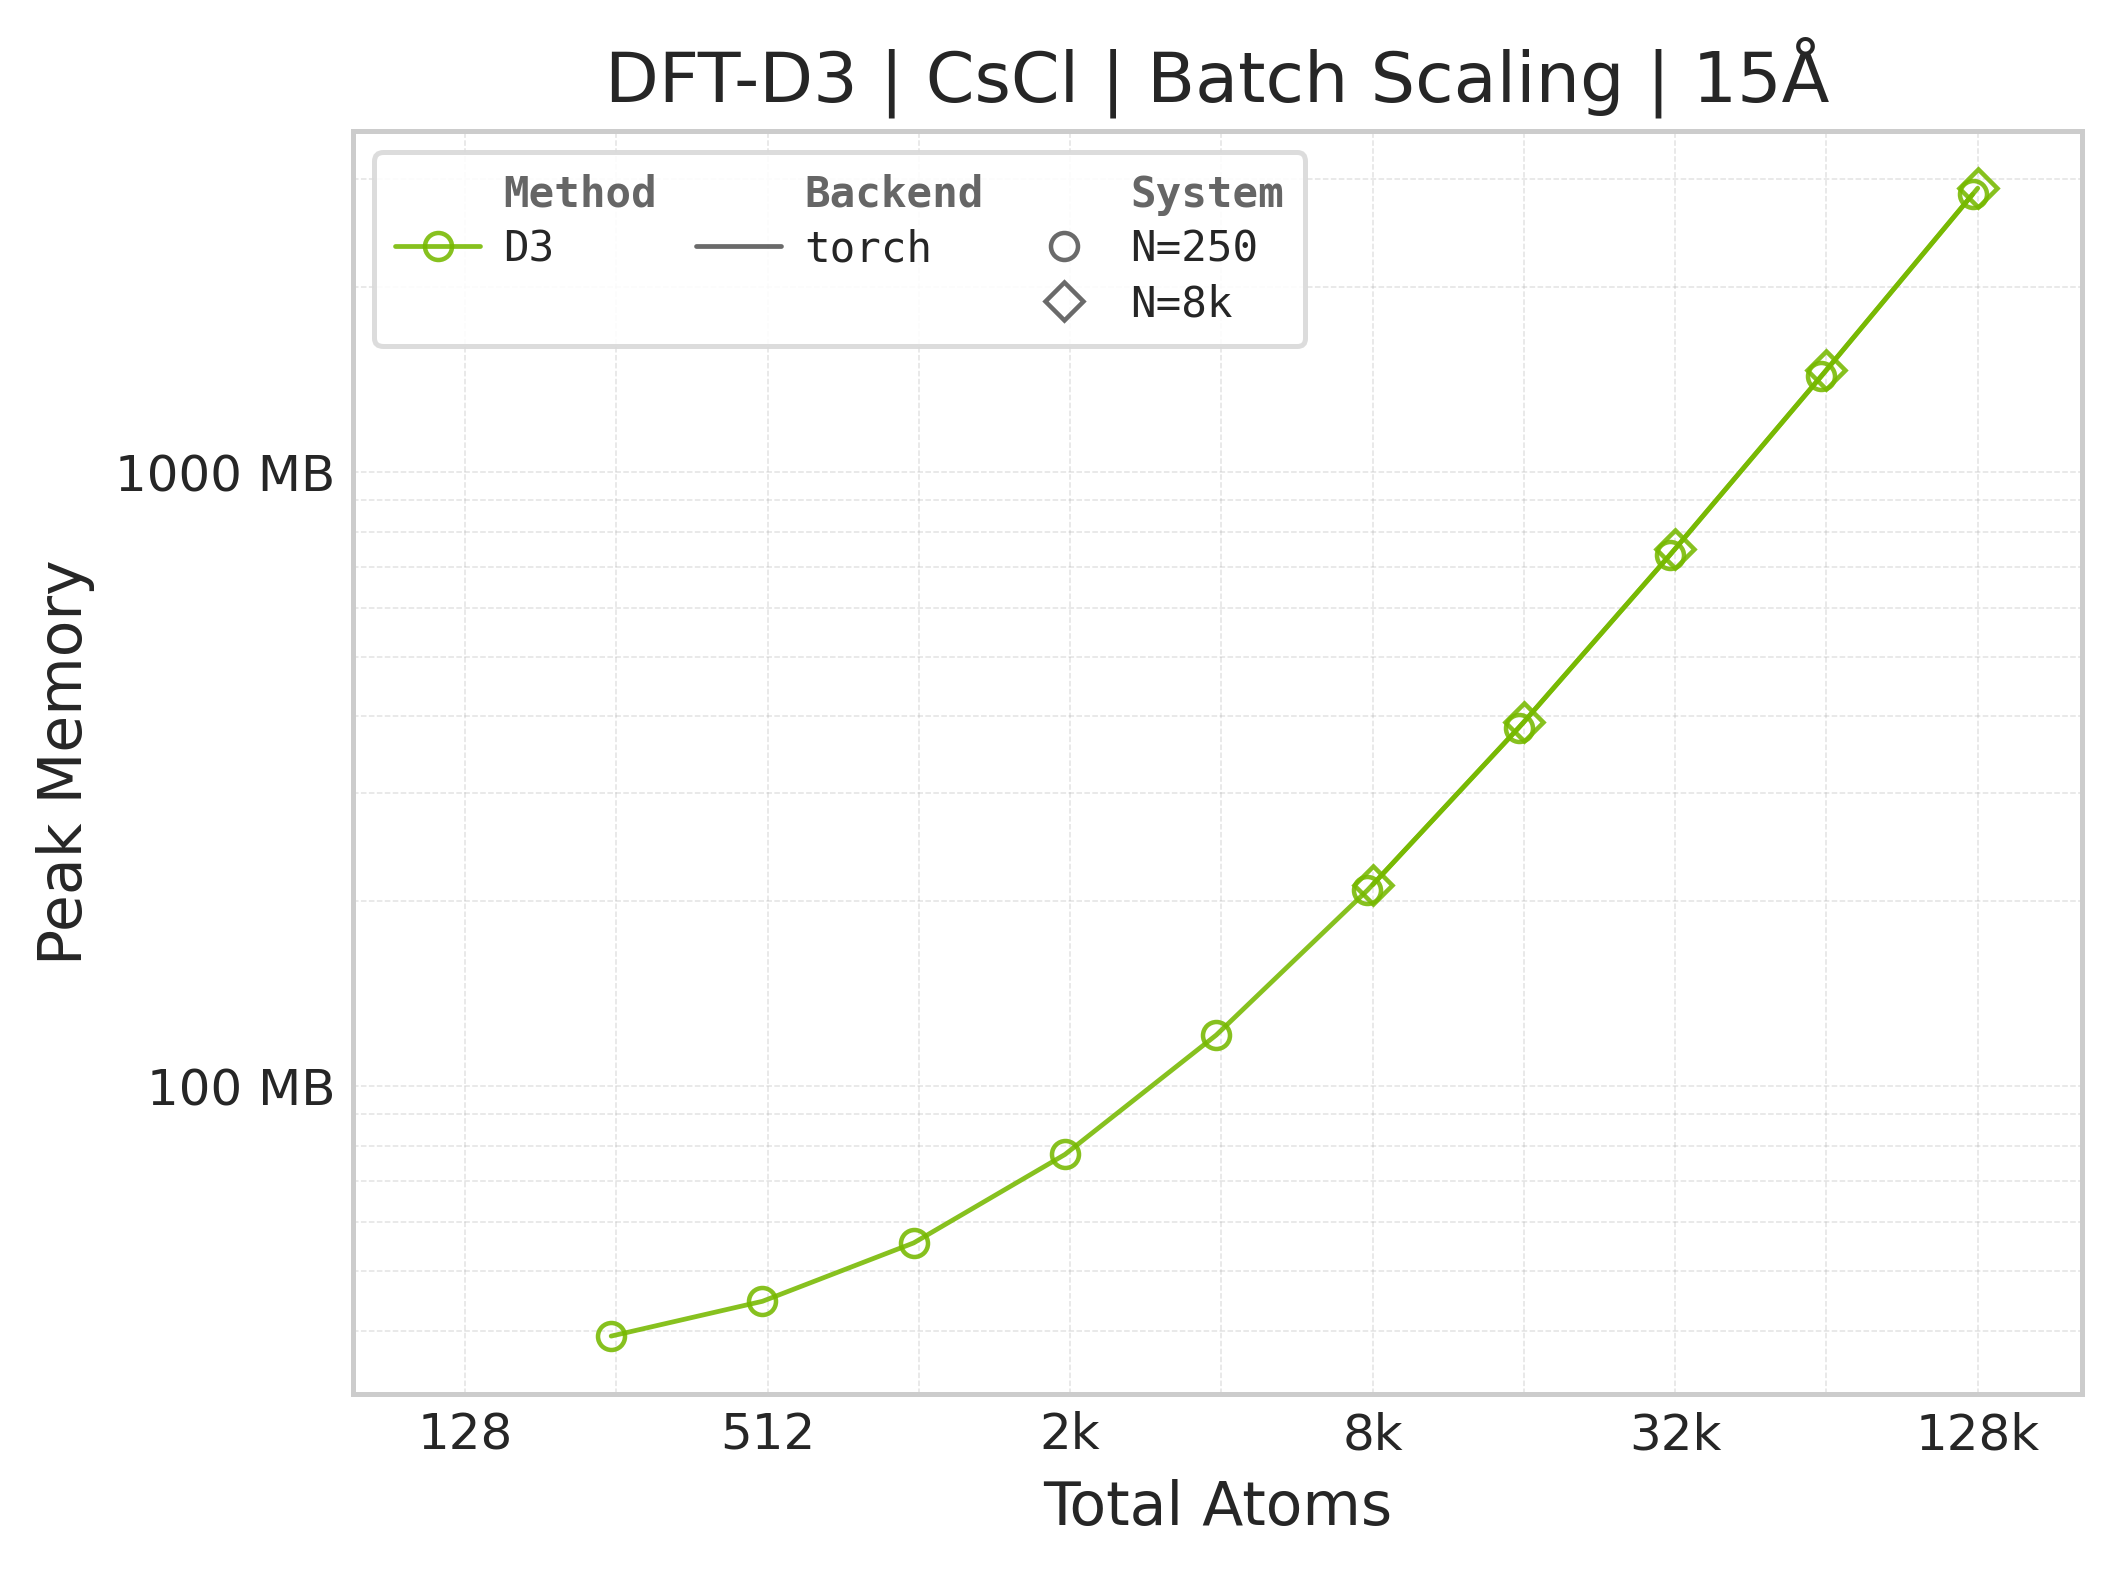
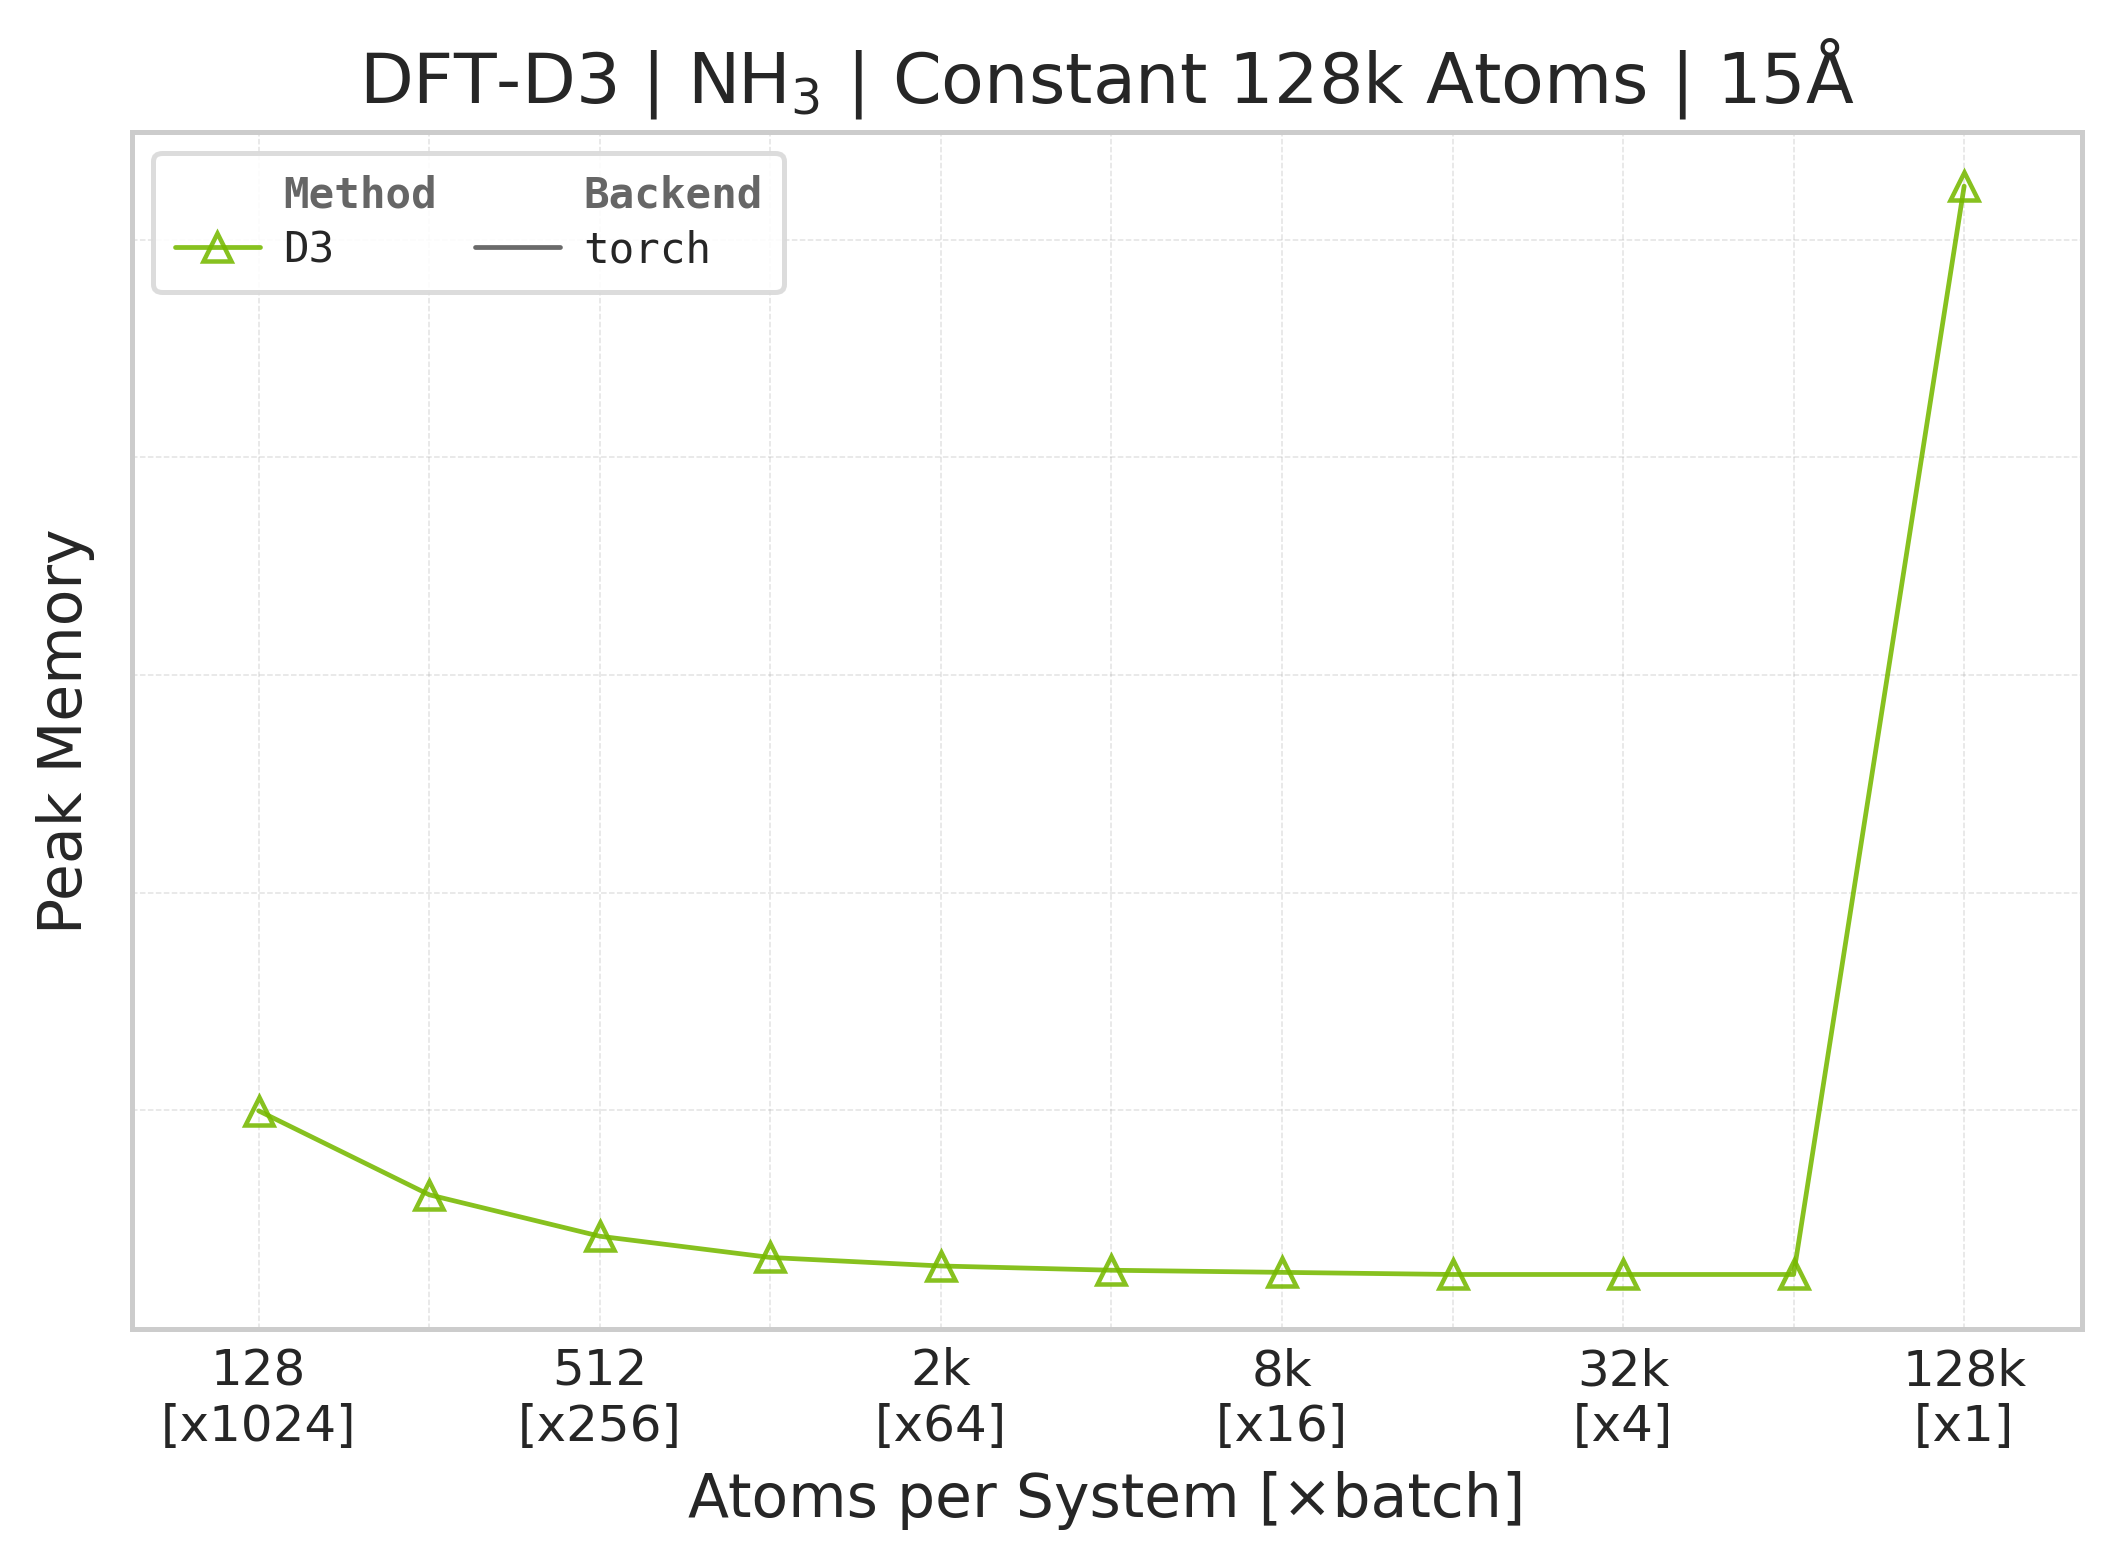
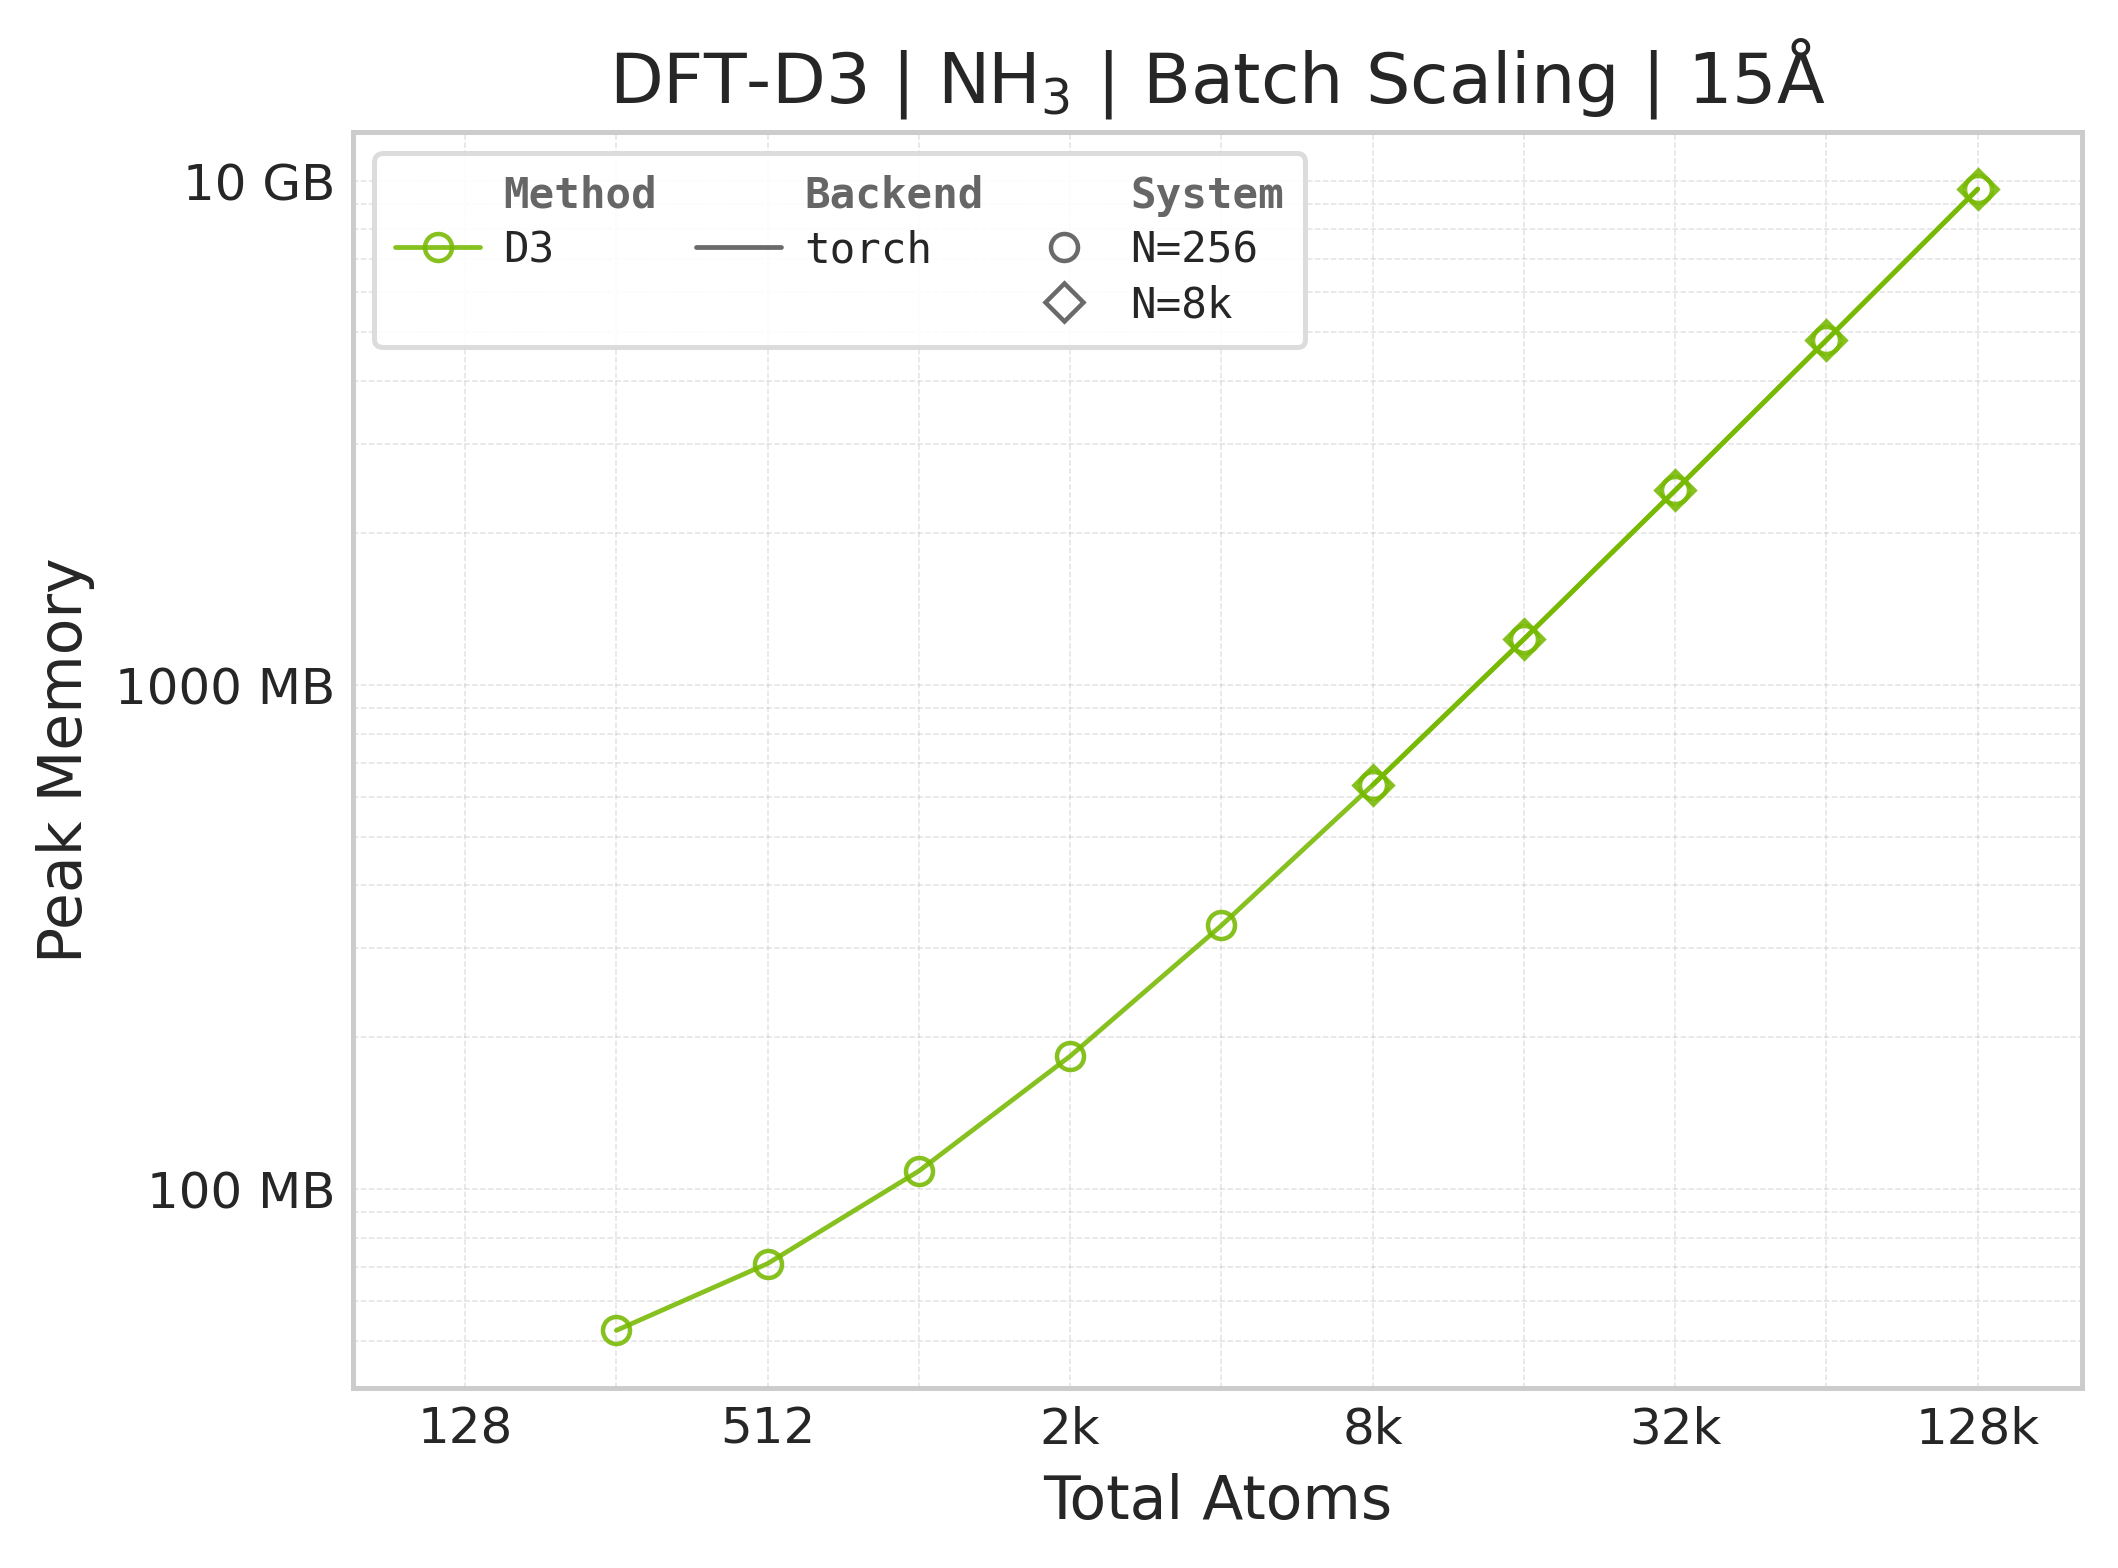
Memory : Peak memory reported by the Torch CUDA allocator vs. system size. Units switch between MB and GB automatically on the y-axis. JAX memory is not measured by this suite.
Performance Results#
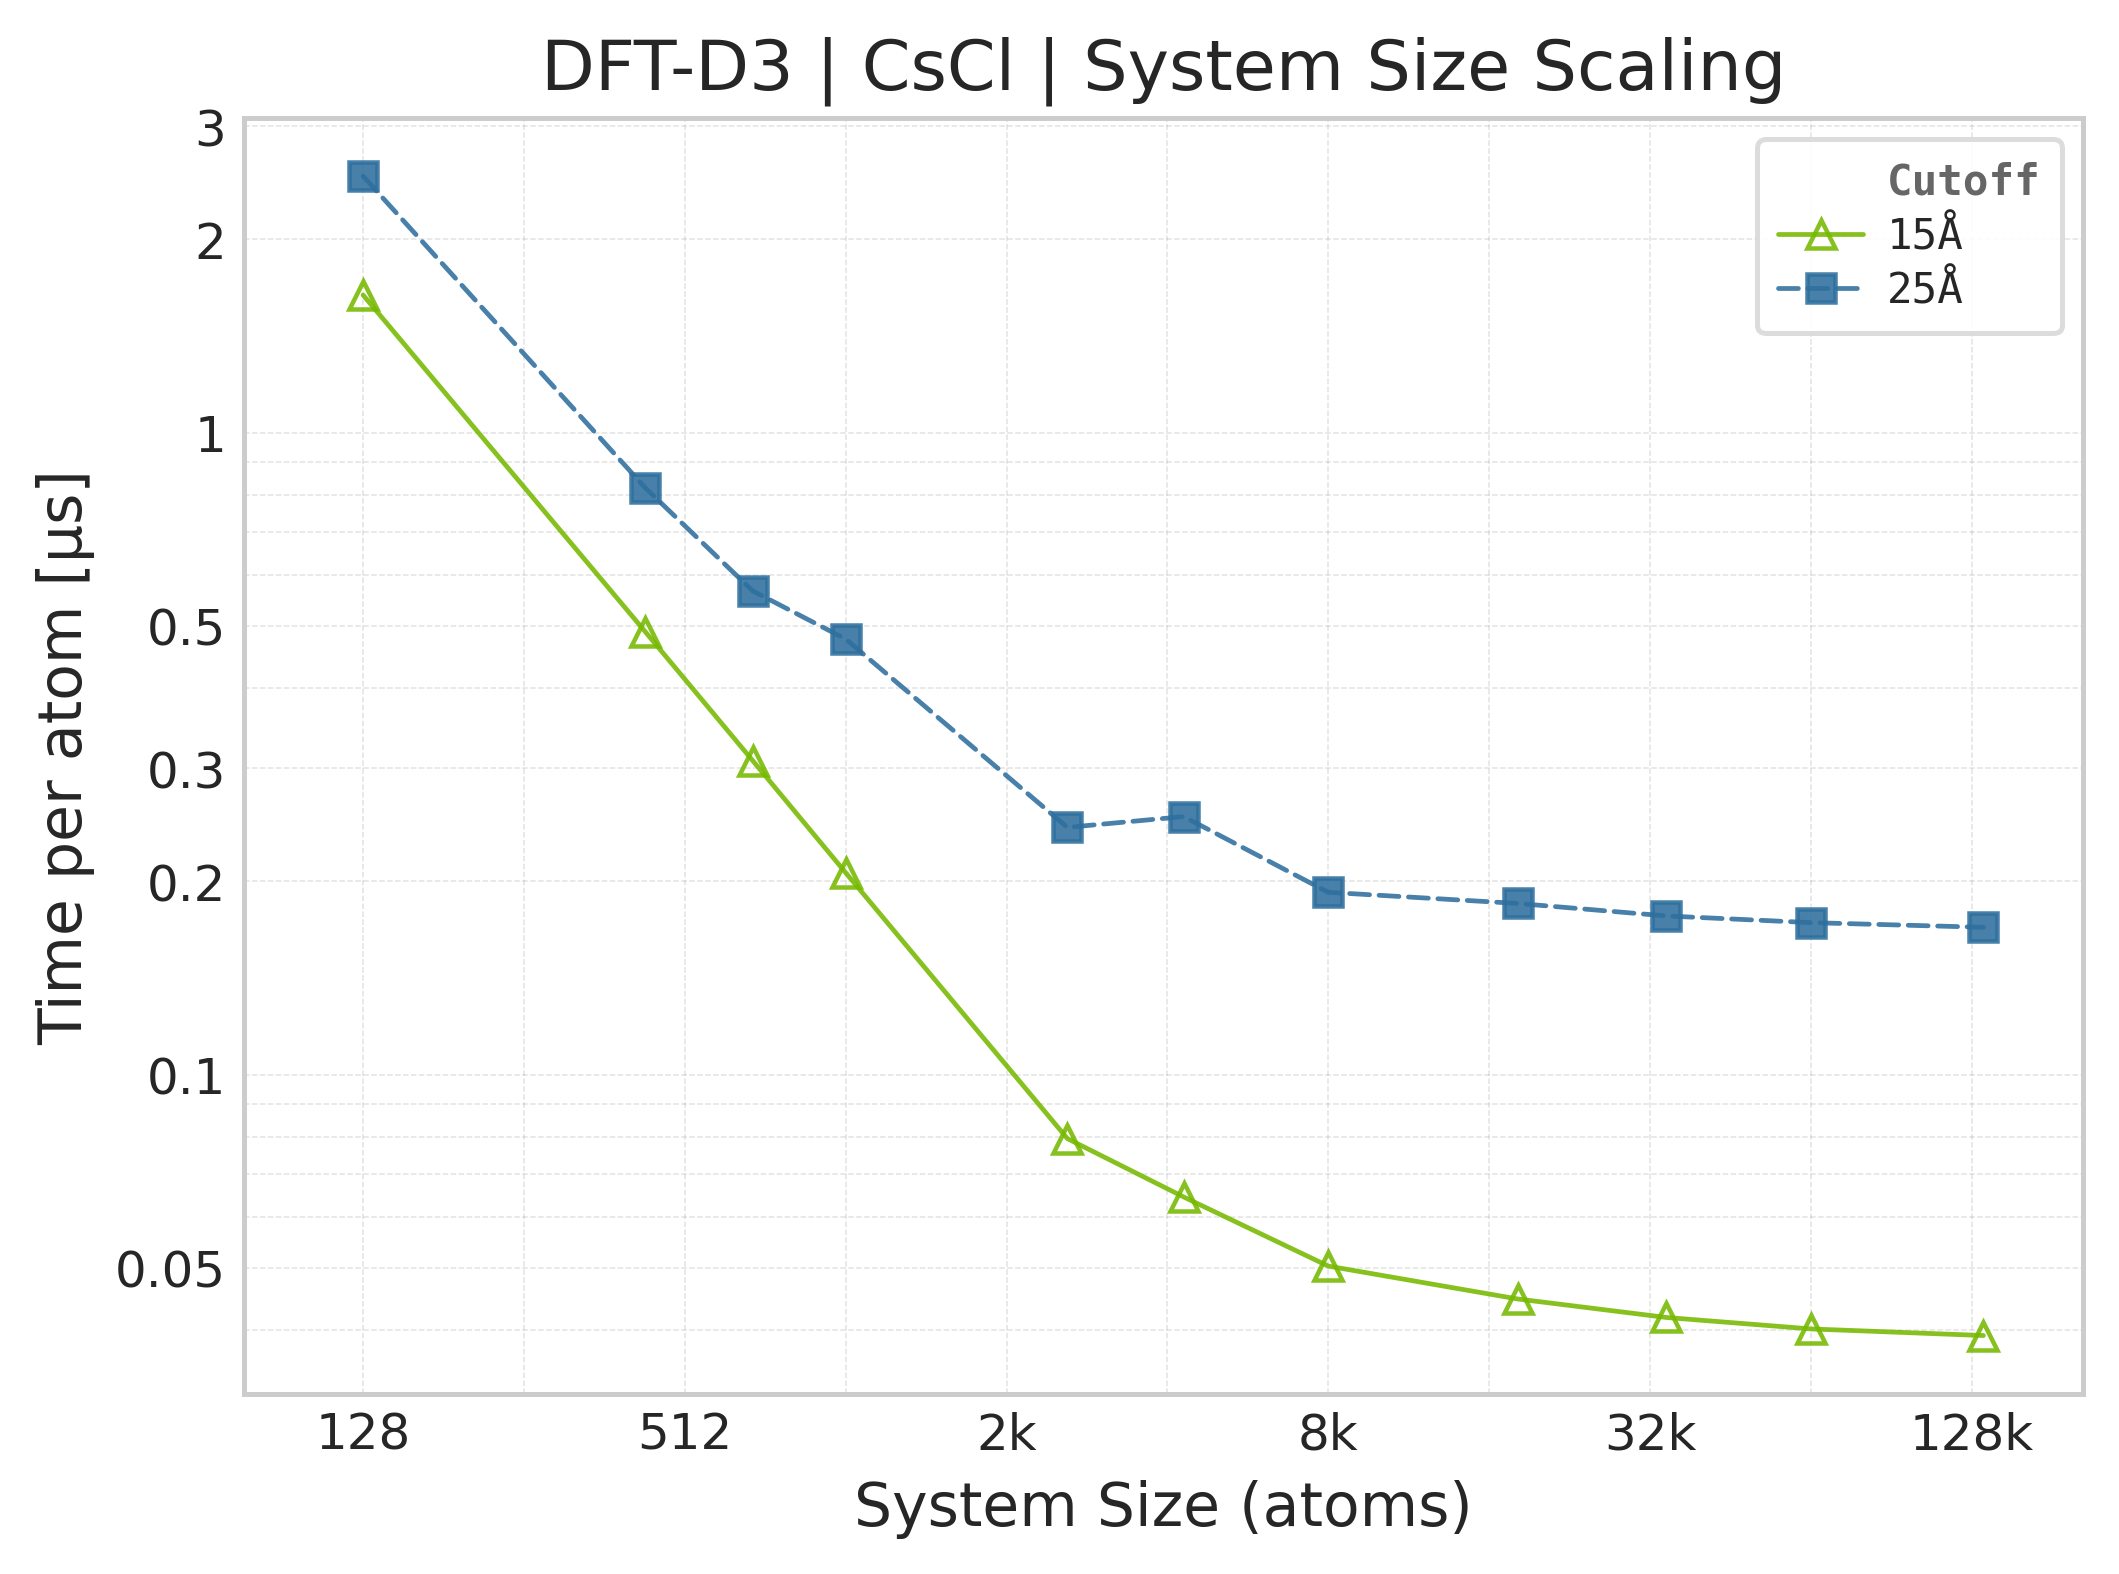
Mean execution time vs. system size (Torch, CsCl).#
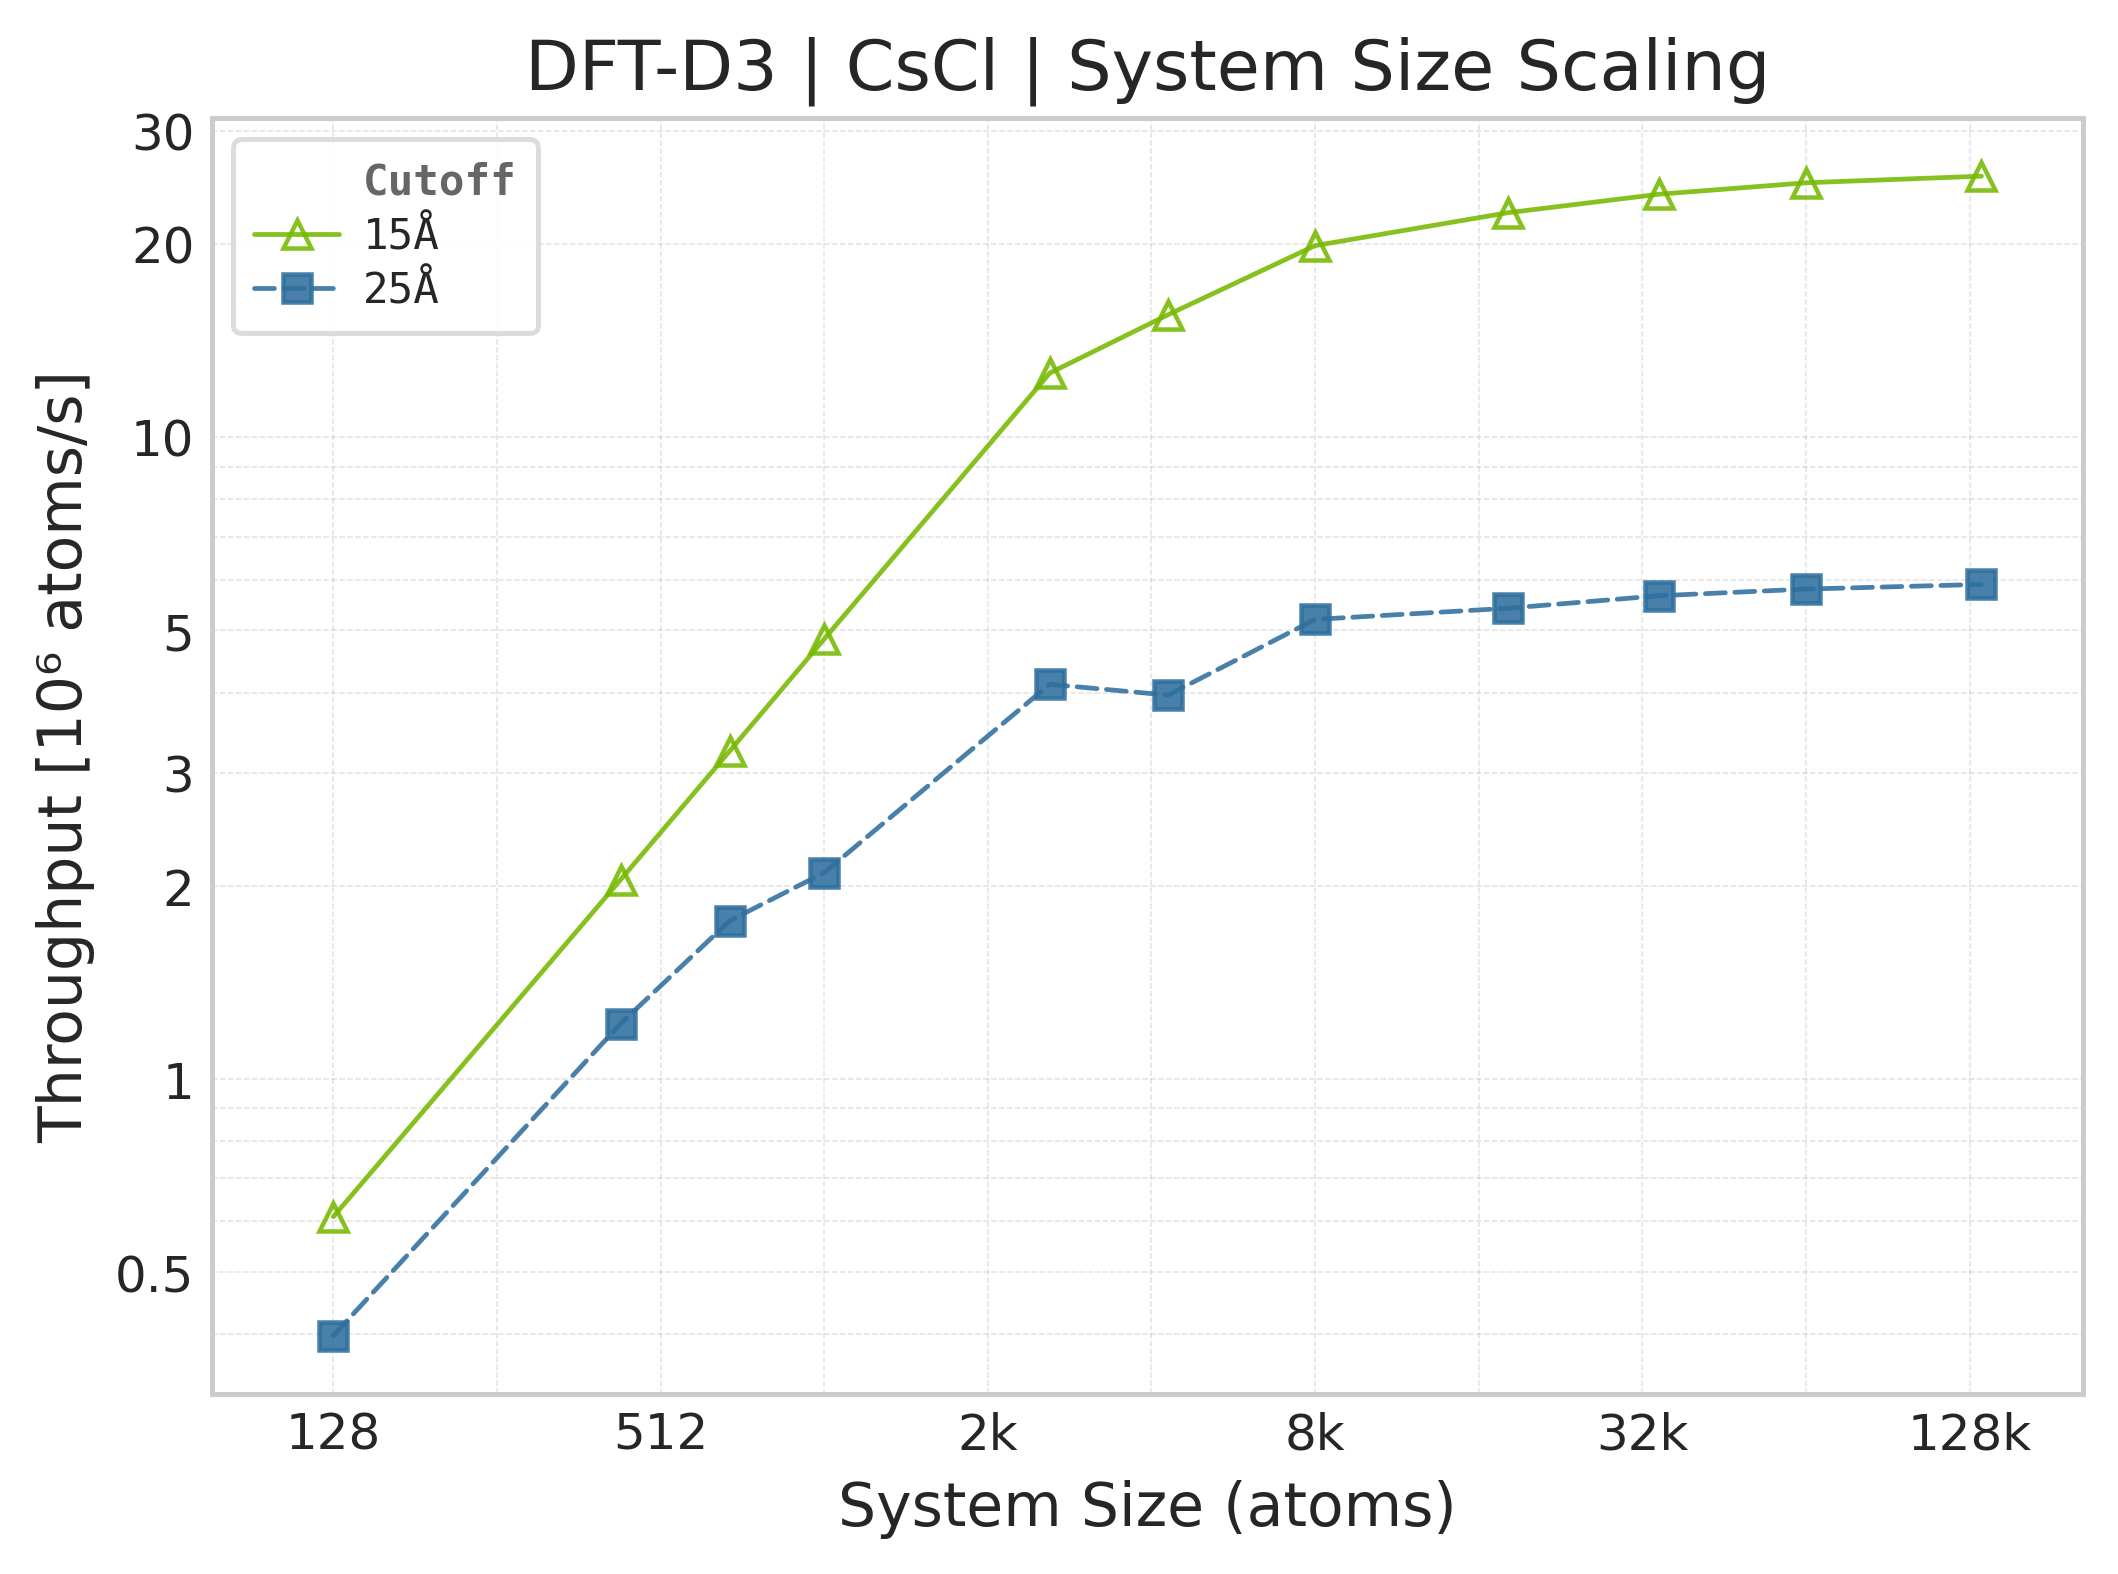
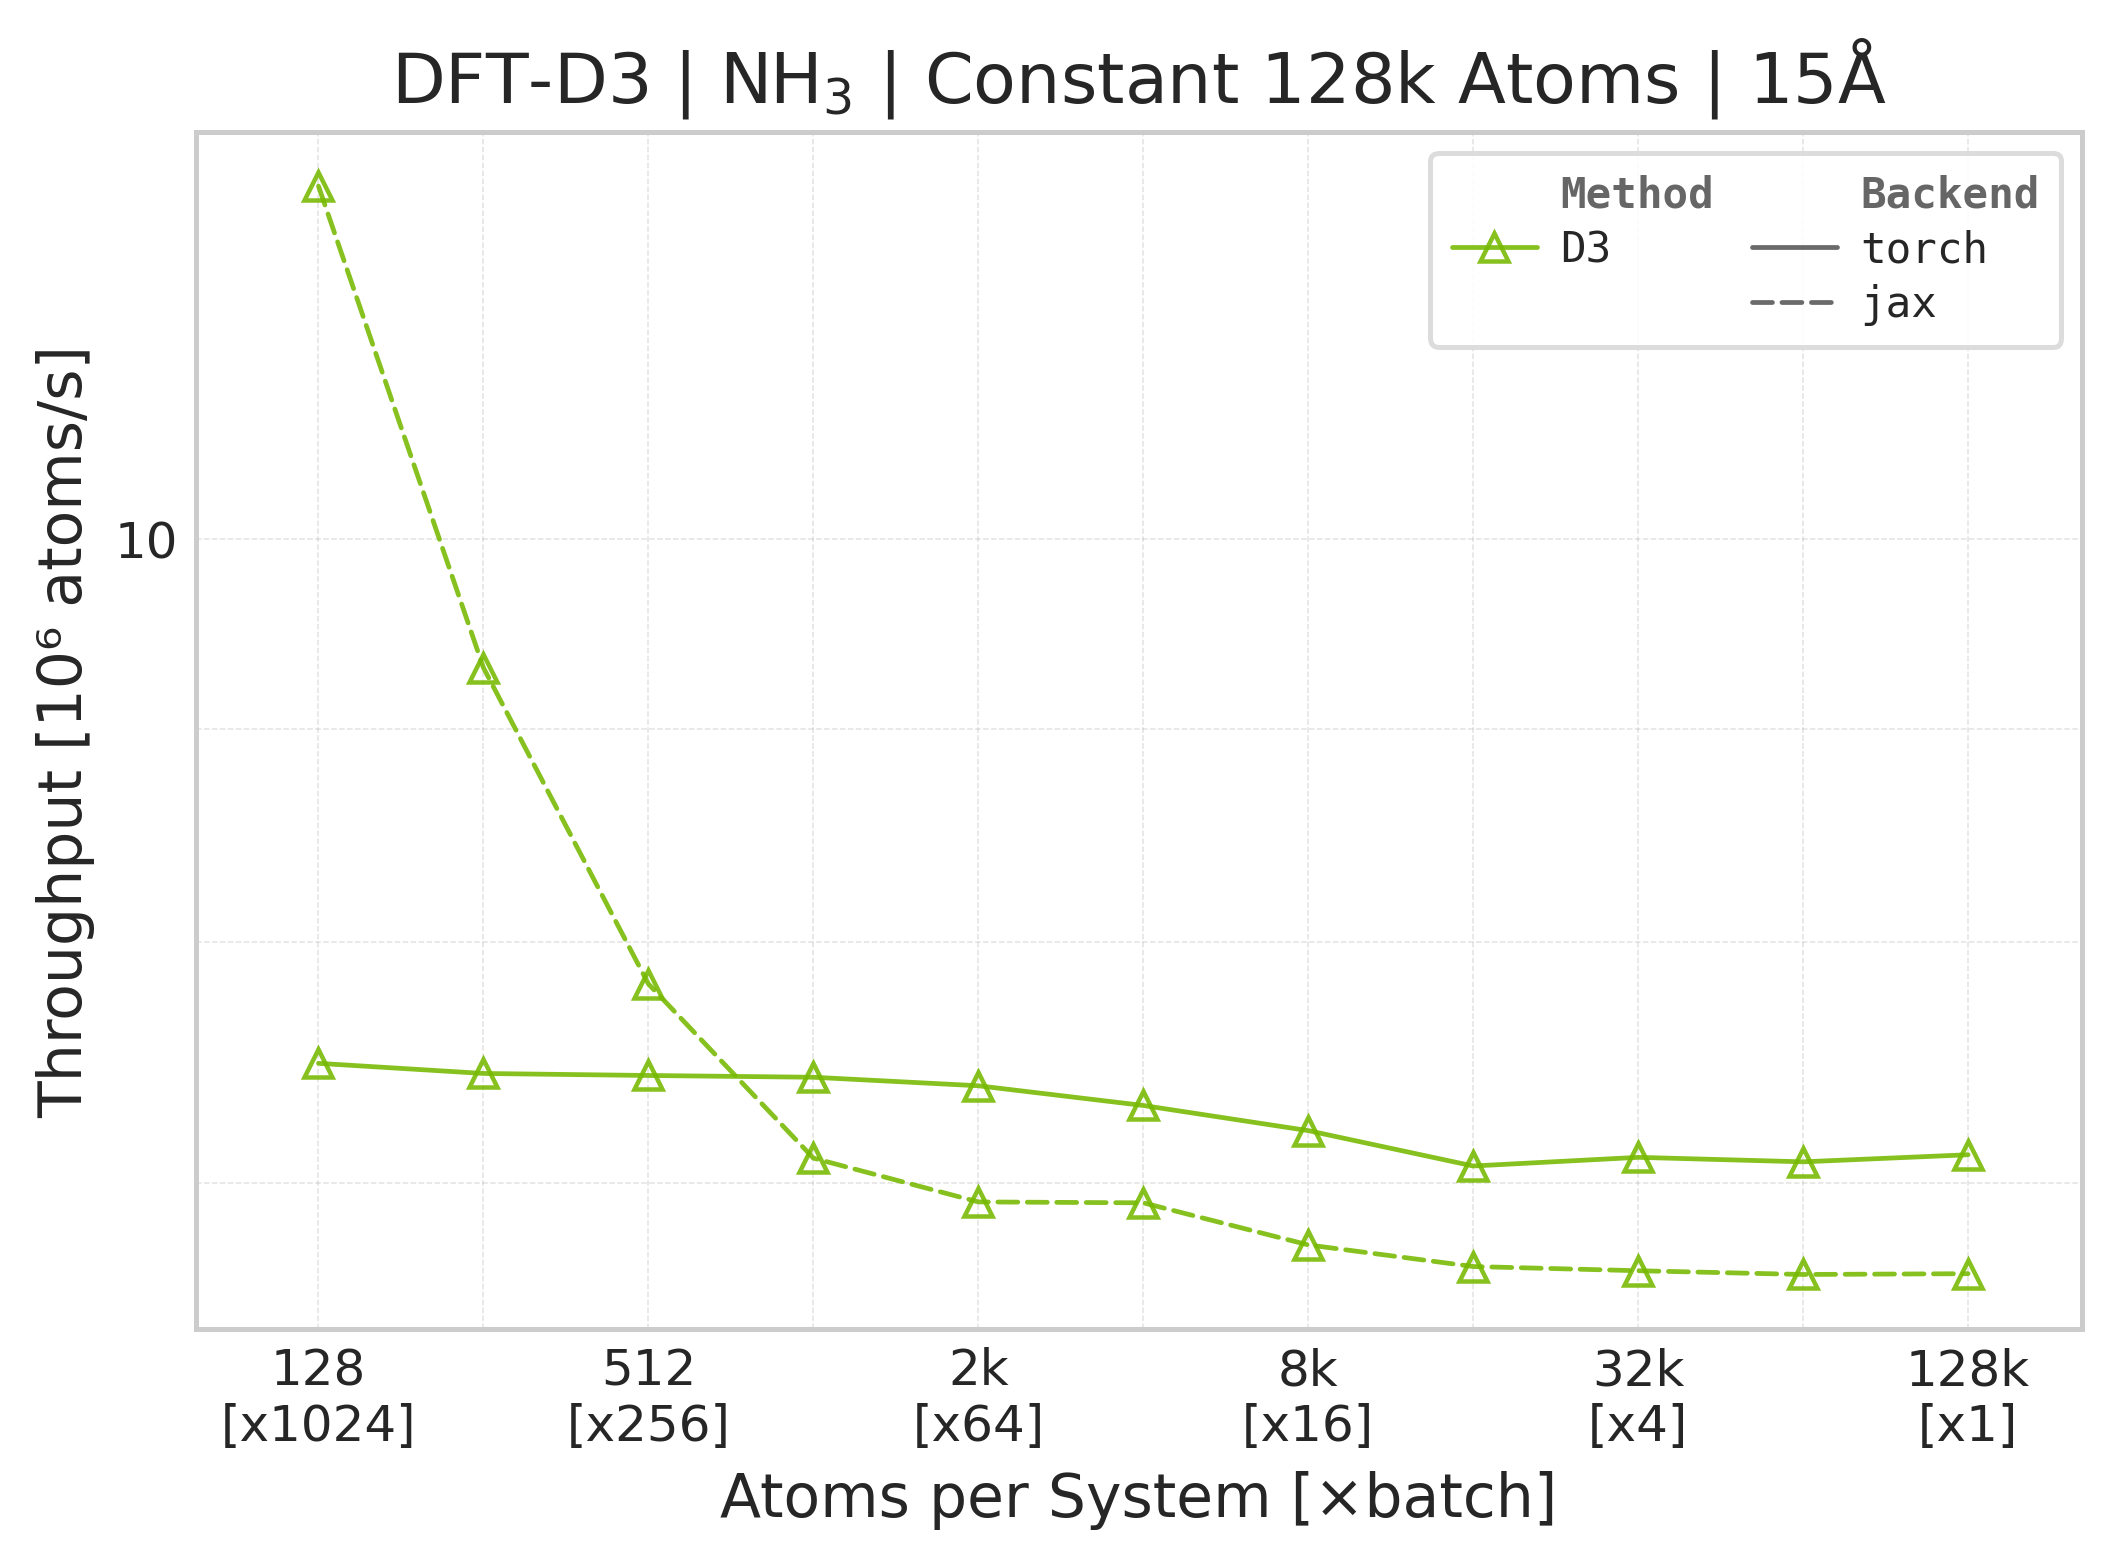
Throughput (\(10^6\) atoms/s) vs. system size.#
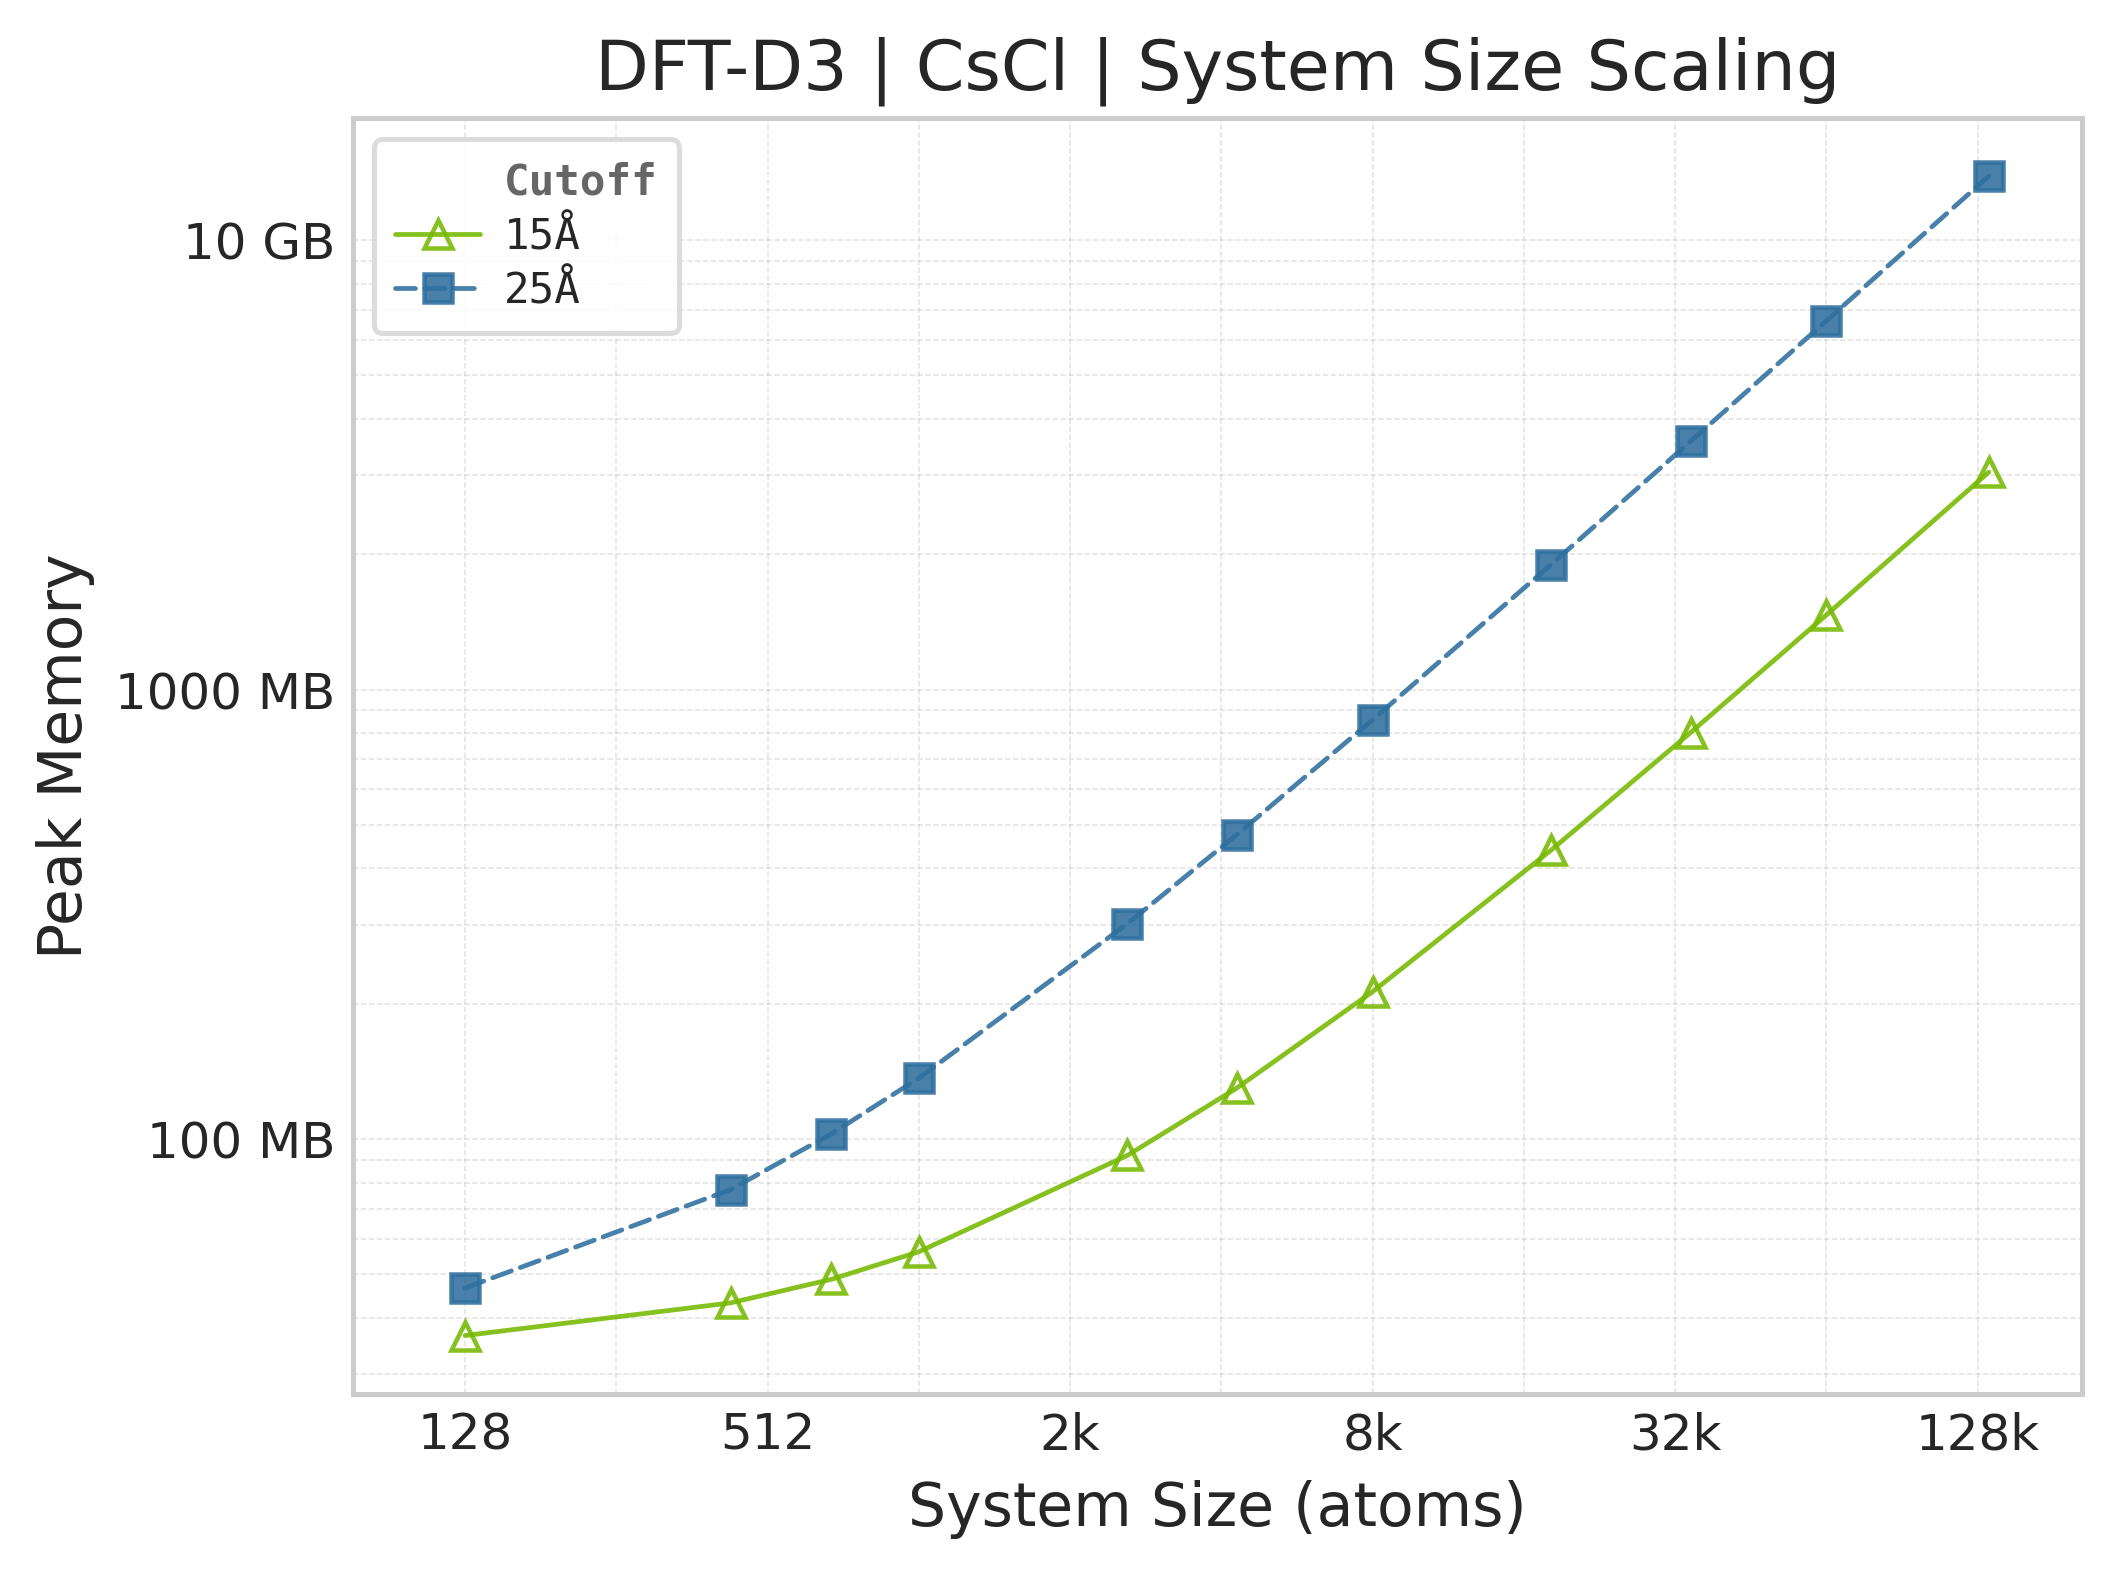
Peak GPU memory vs. system size.#
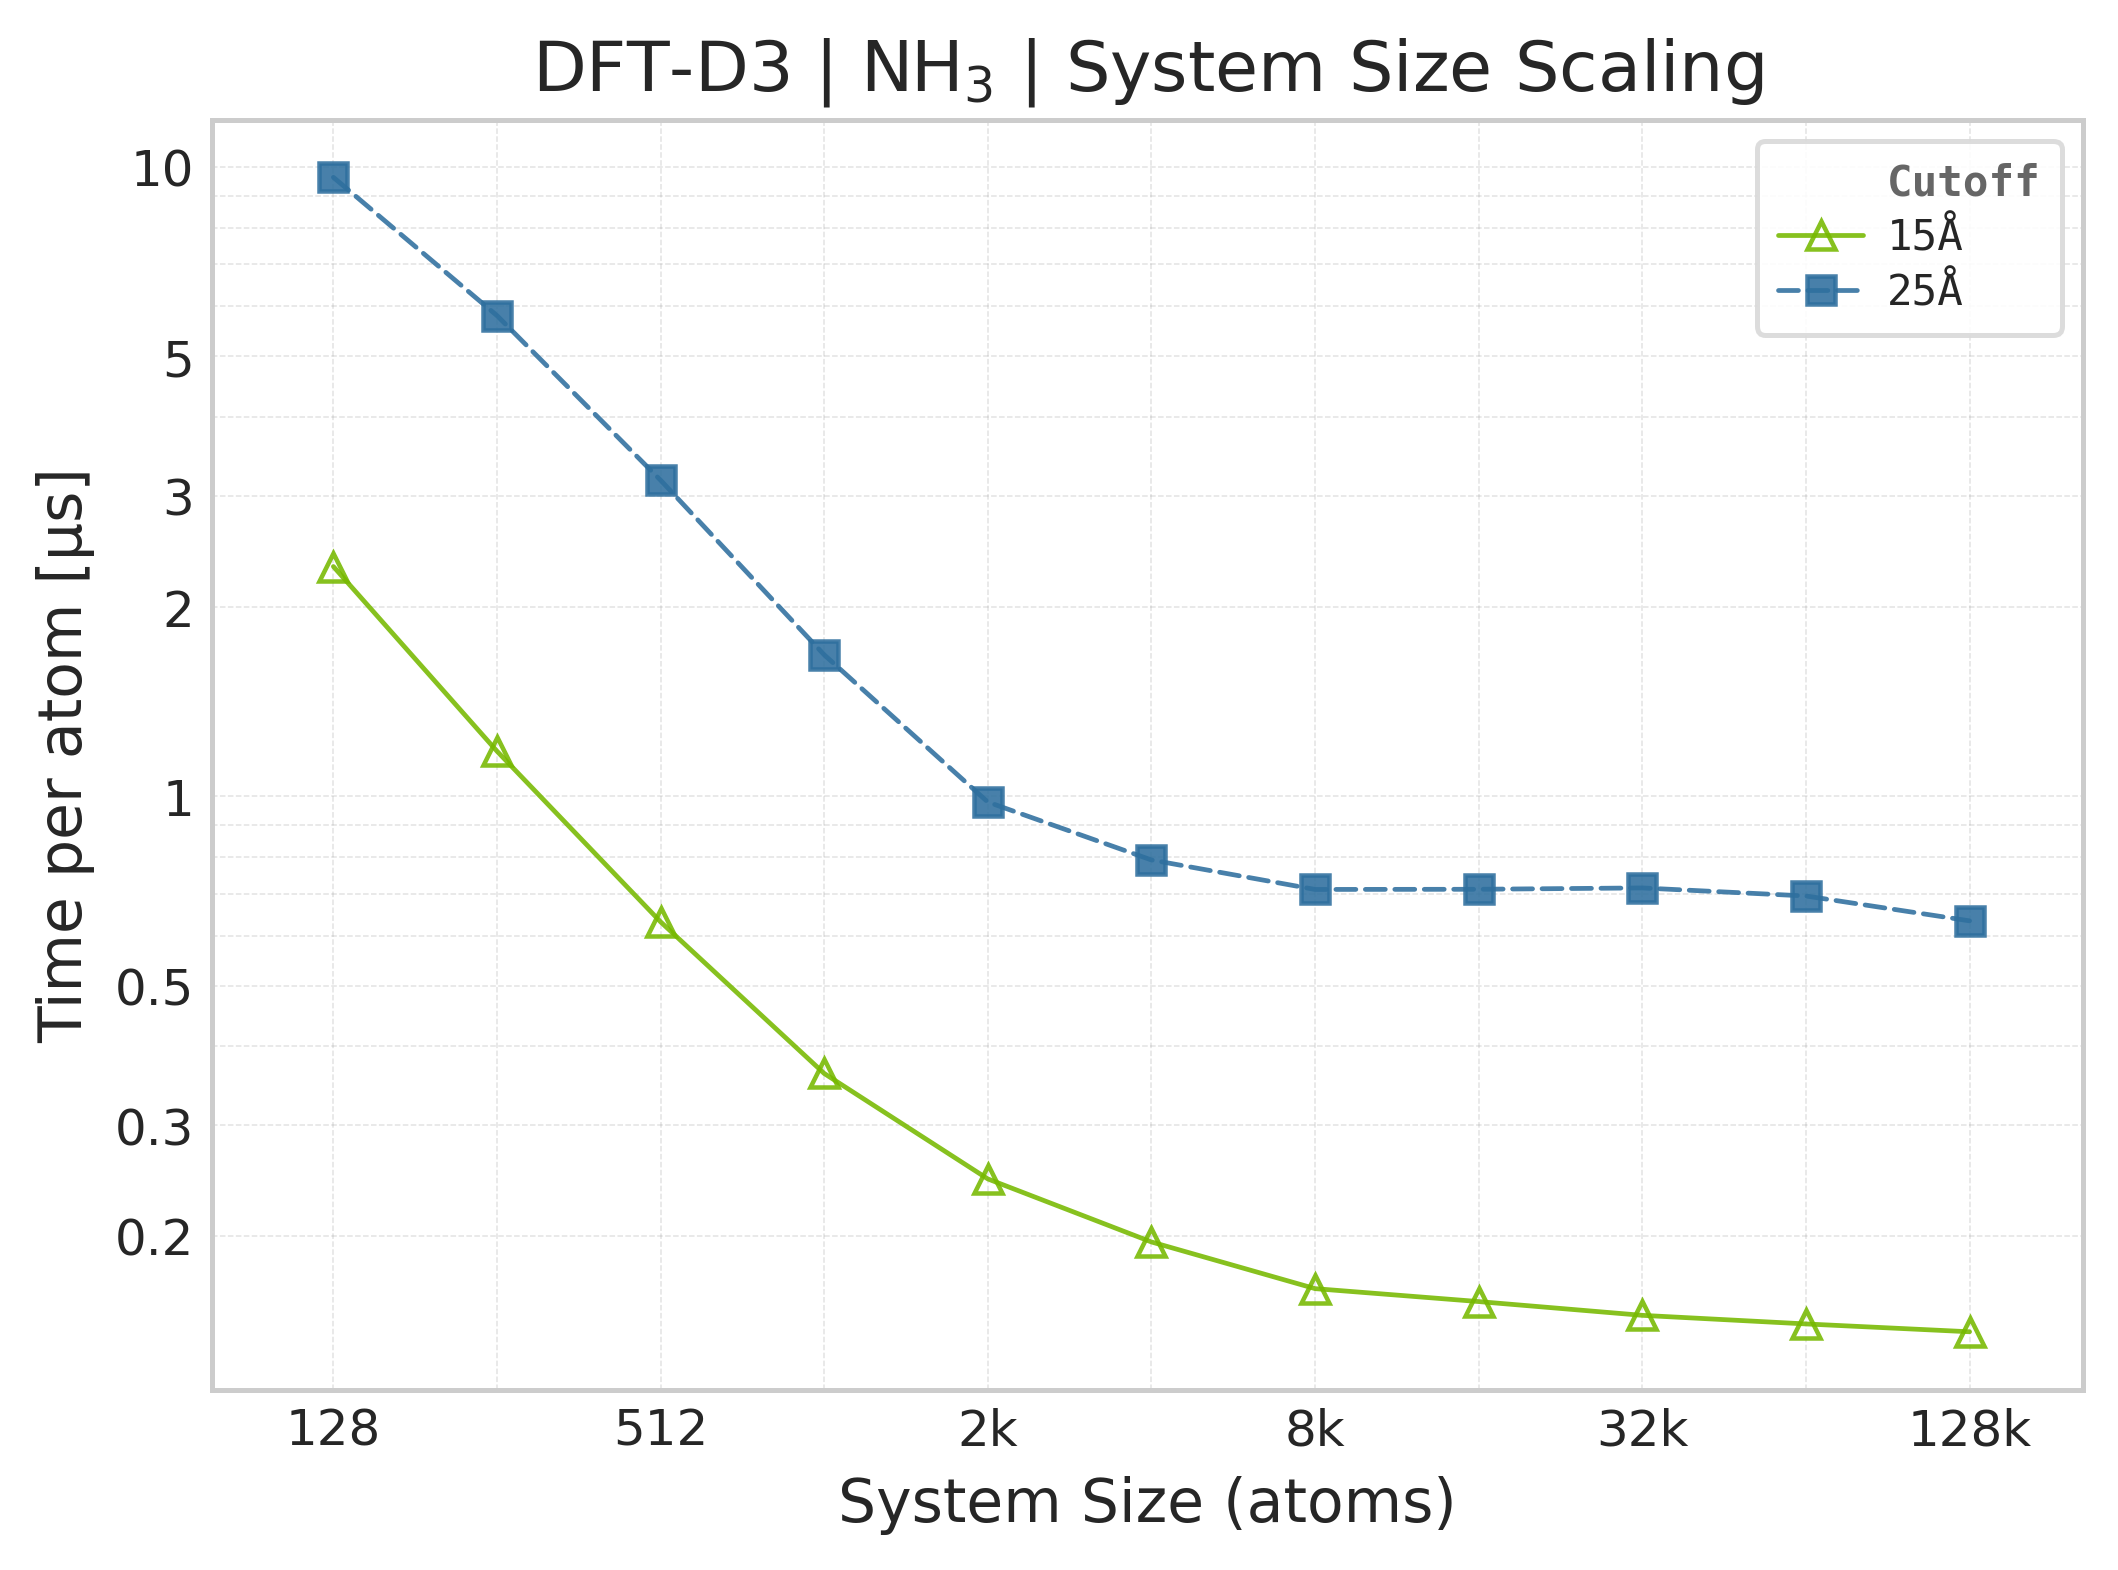
Mean execution time vs. system size (Torch, NH₃).#
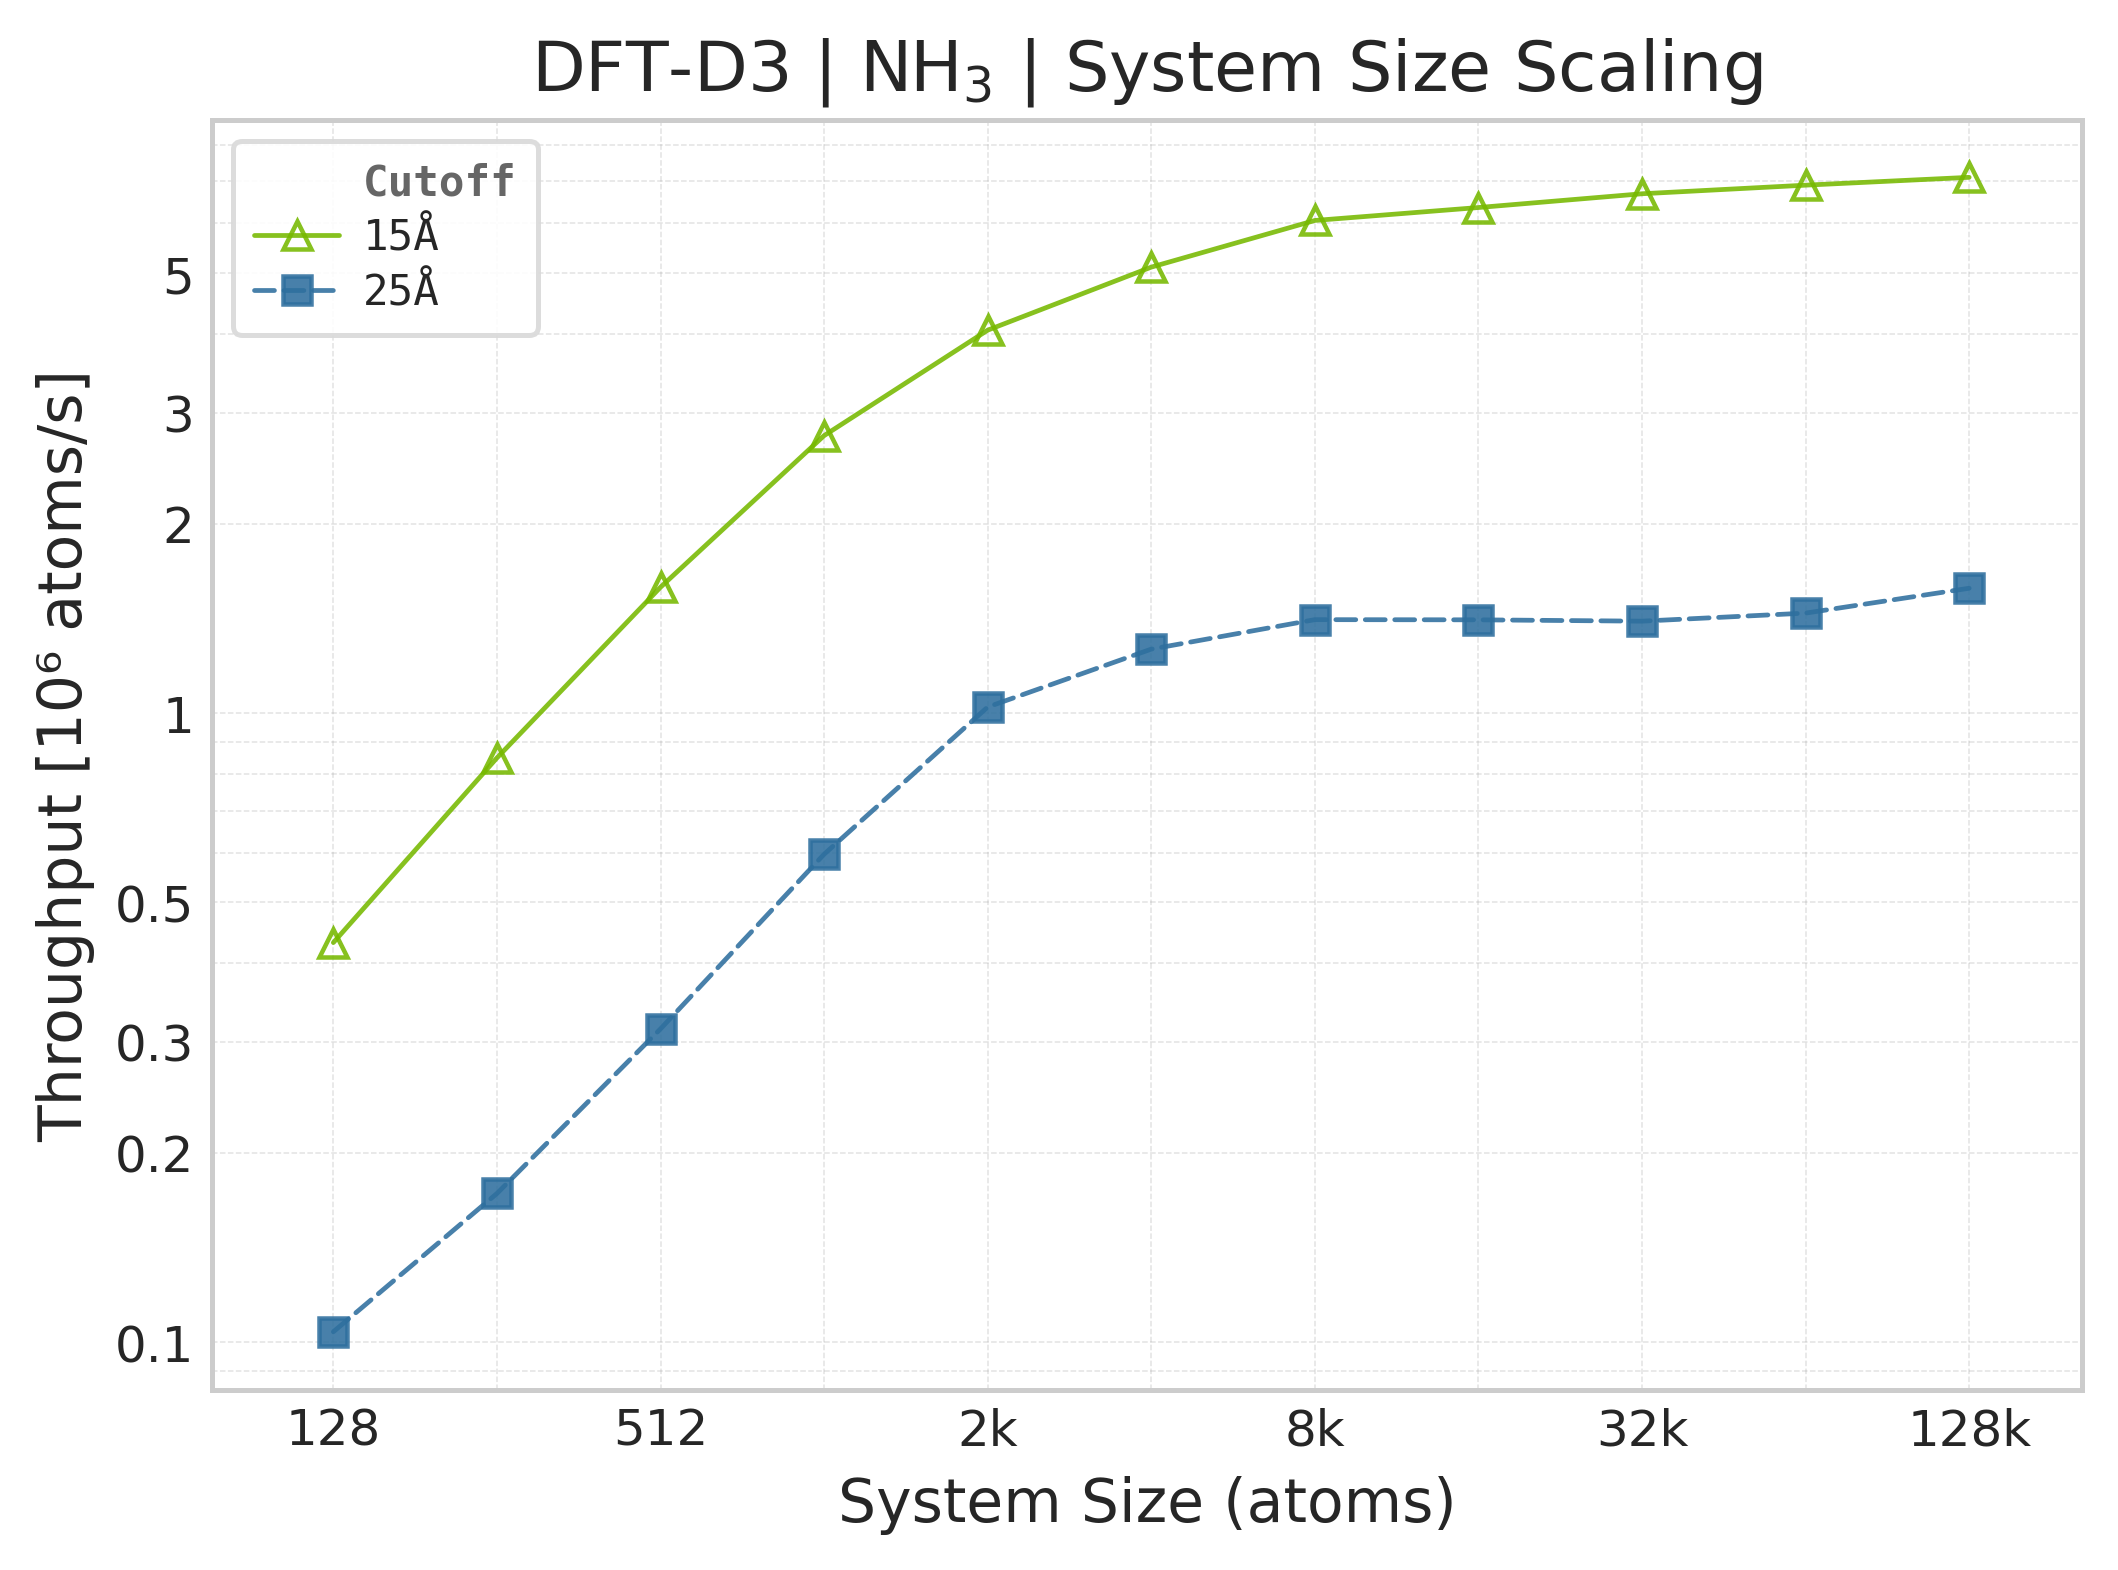
Throughput (\(10^6\) atoms/s) vs. system size (NH₃).#
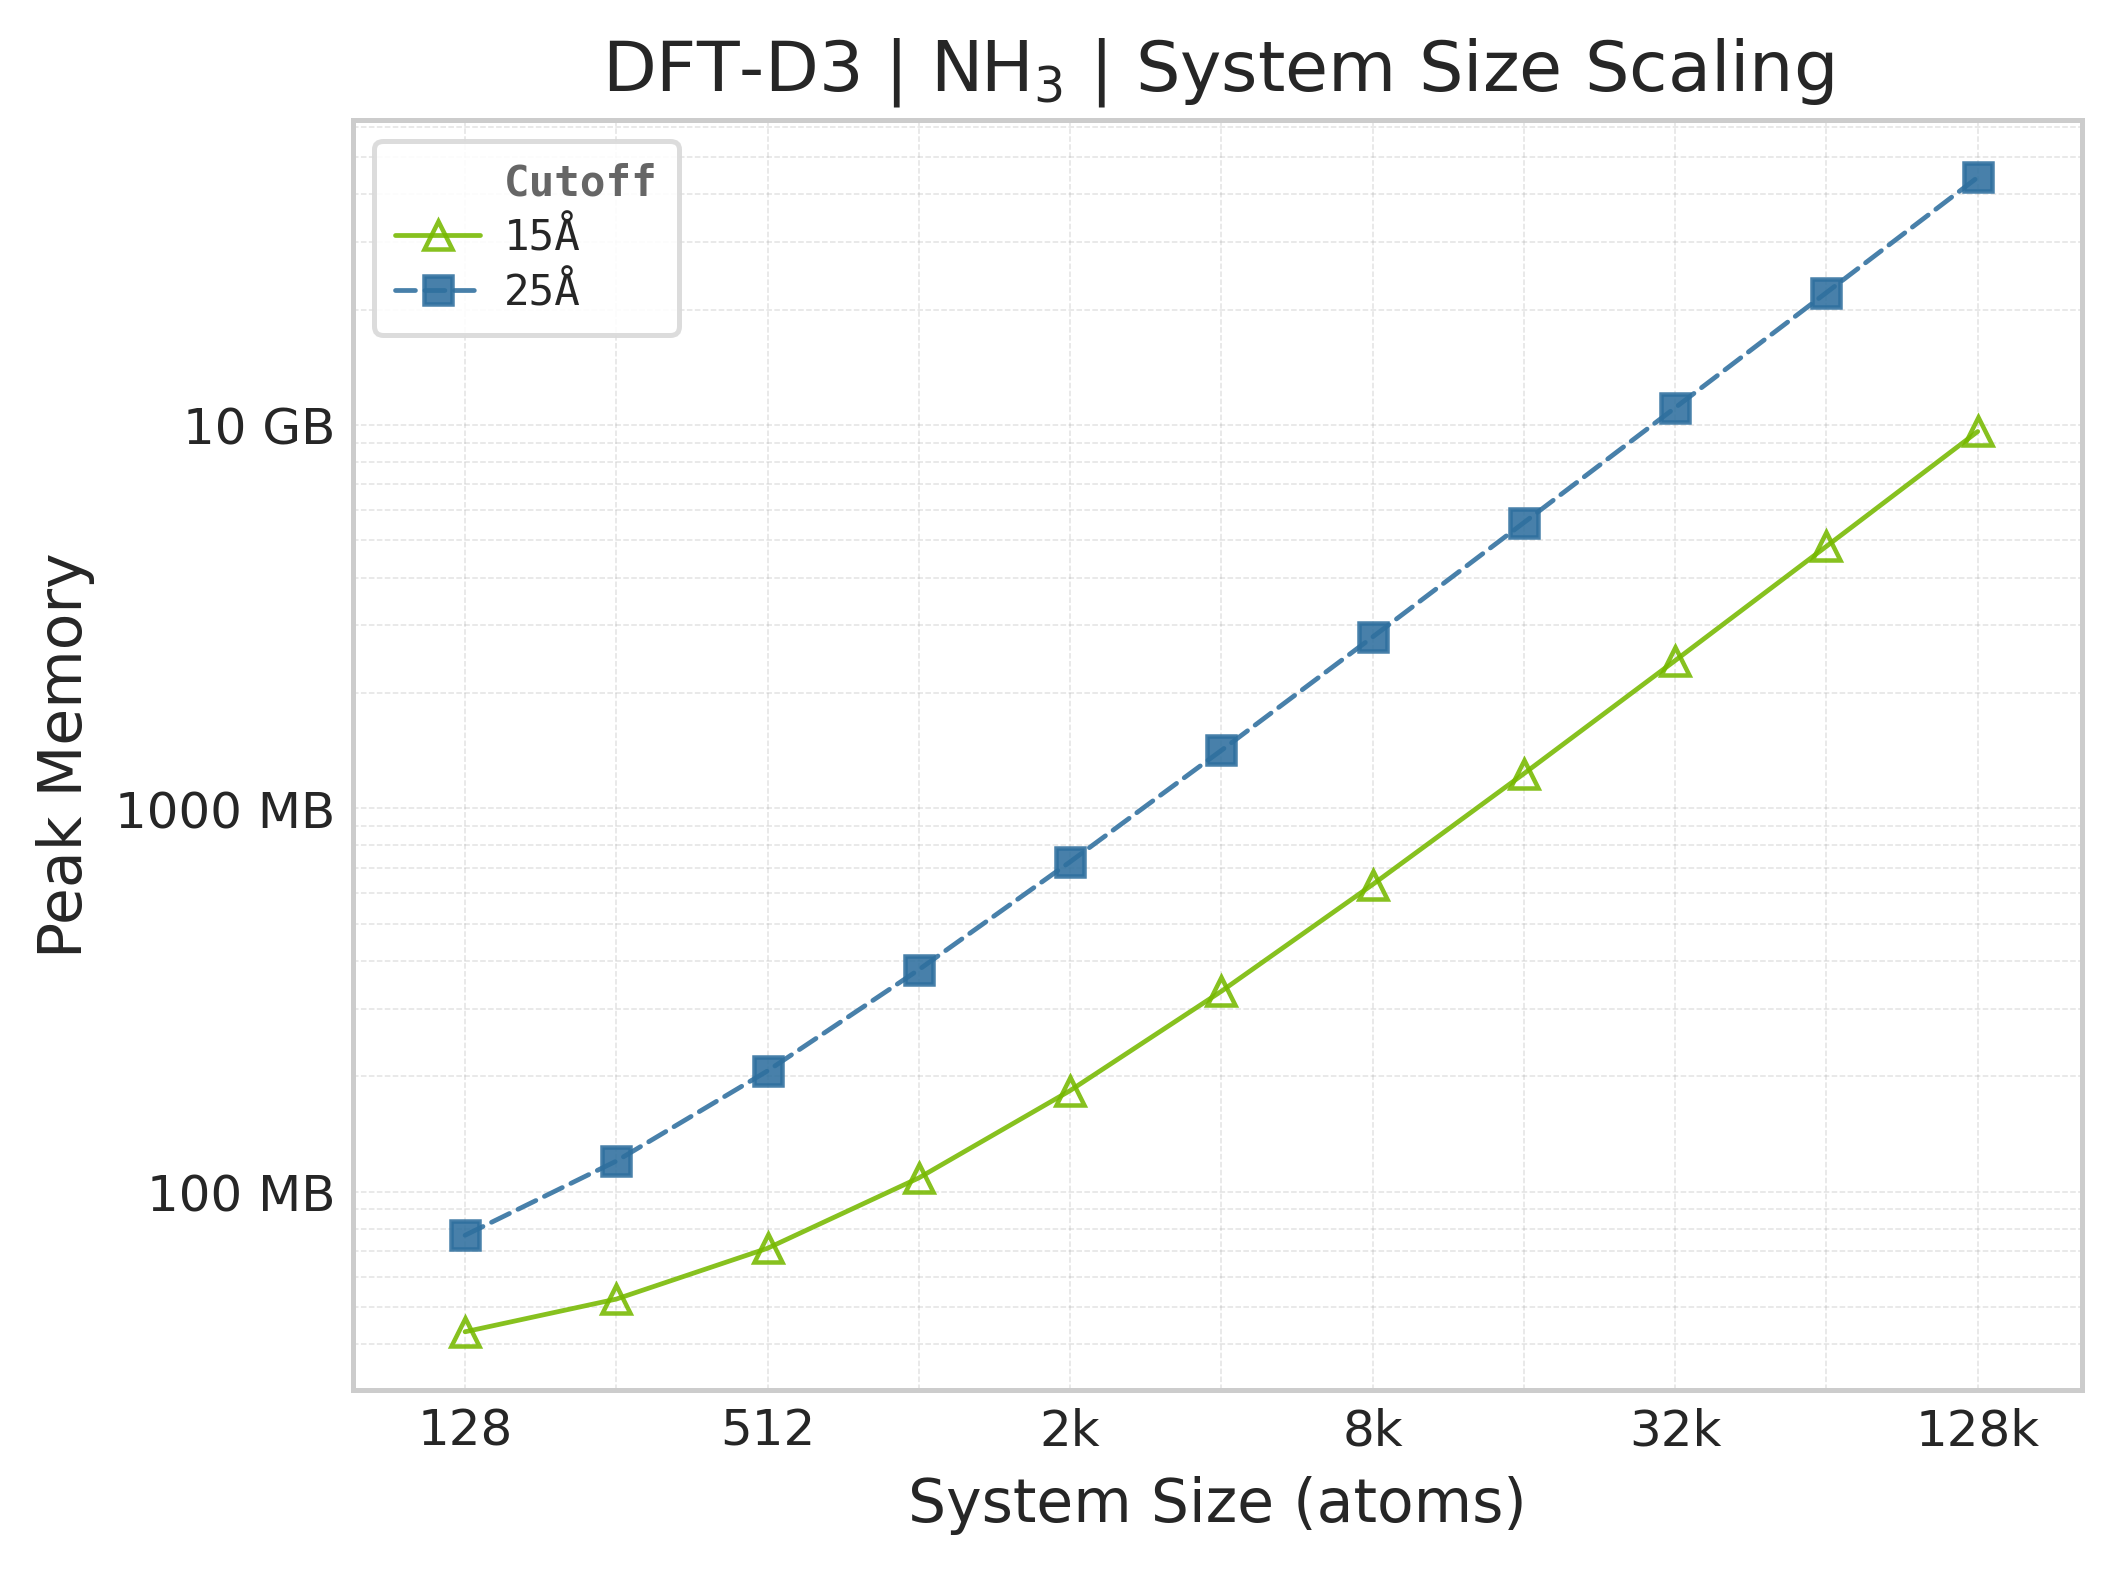
Peak GPU memory vs. system size (NH₃).#
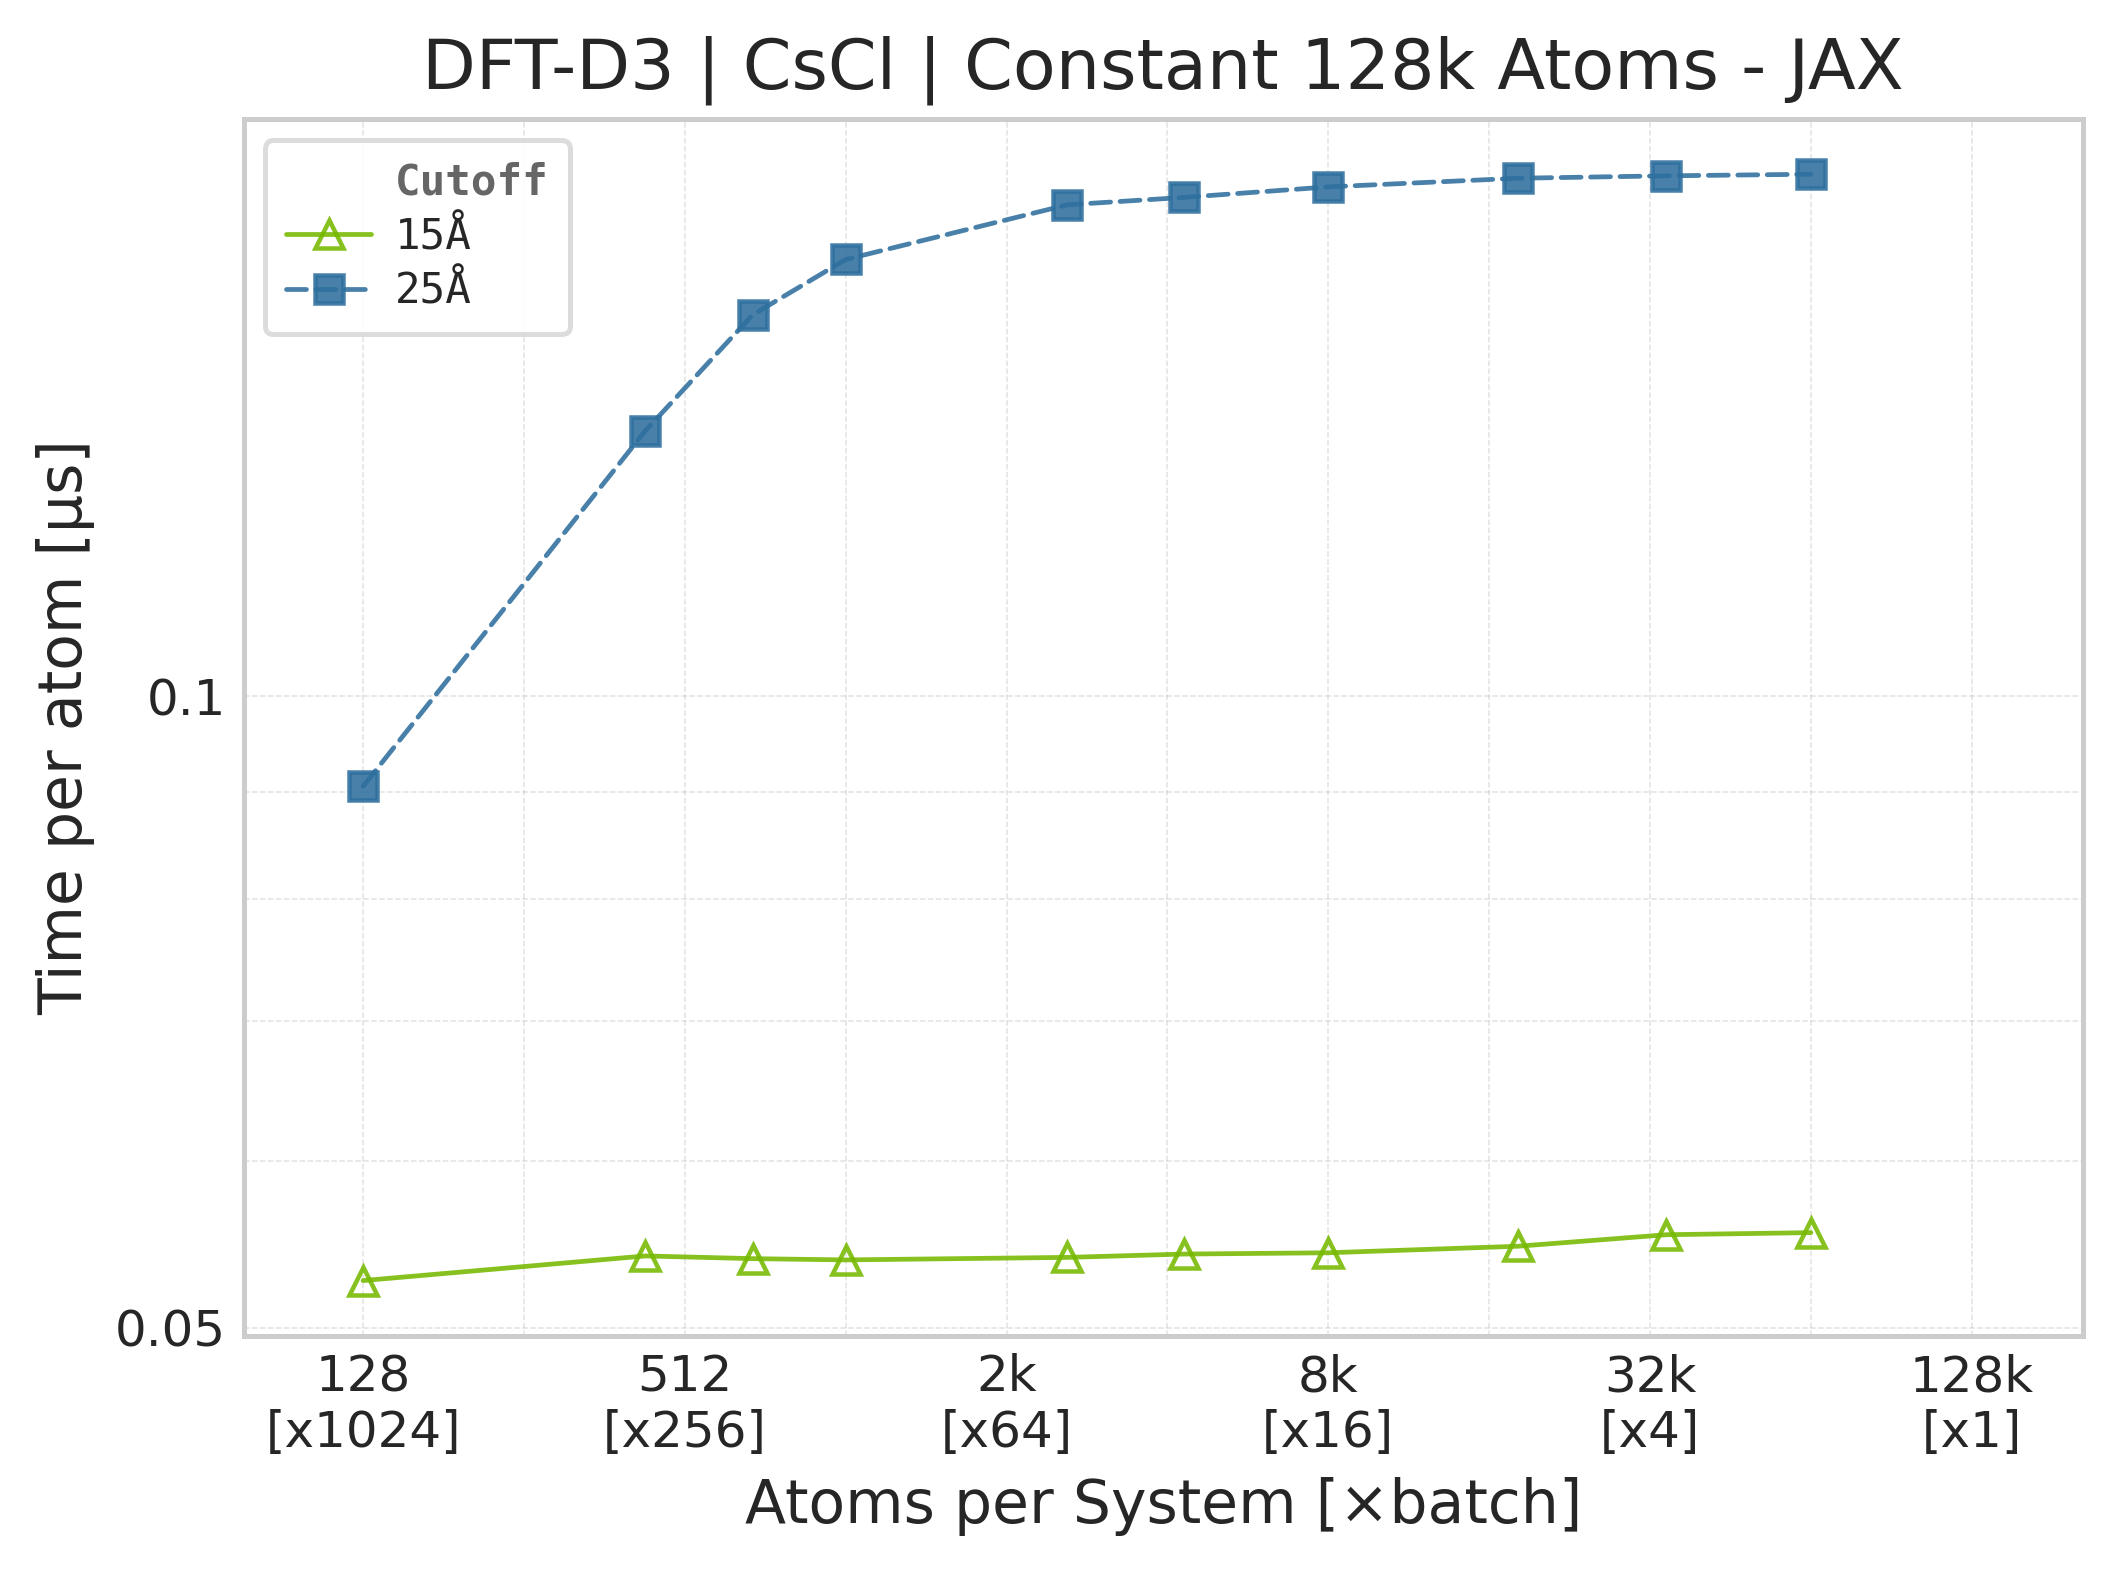
Mean execution time vs. system size (JAX, CsCl).#
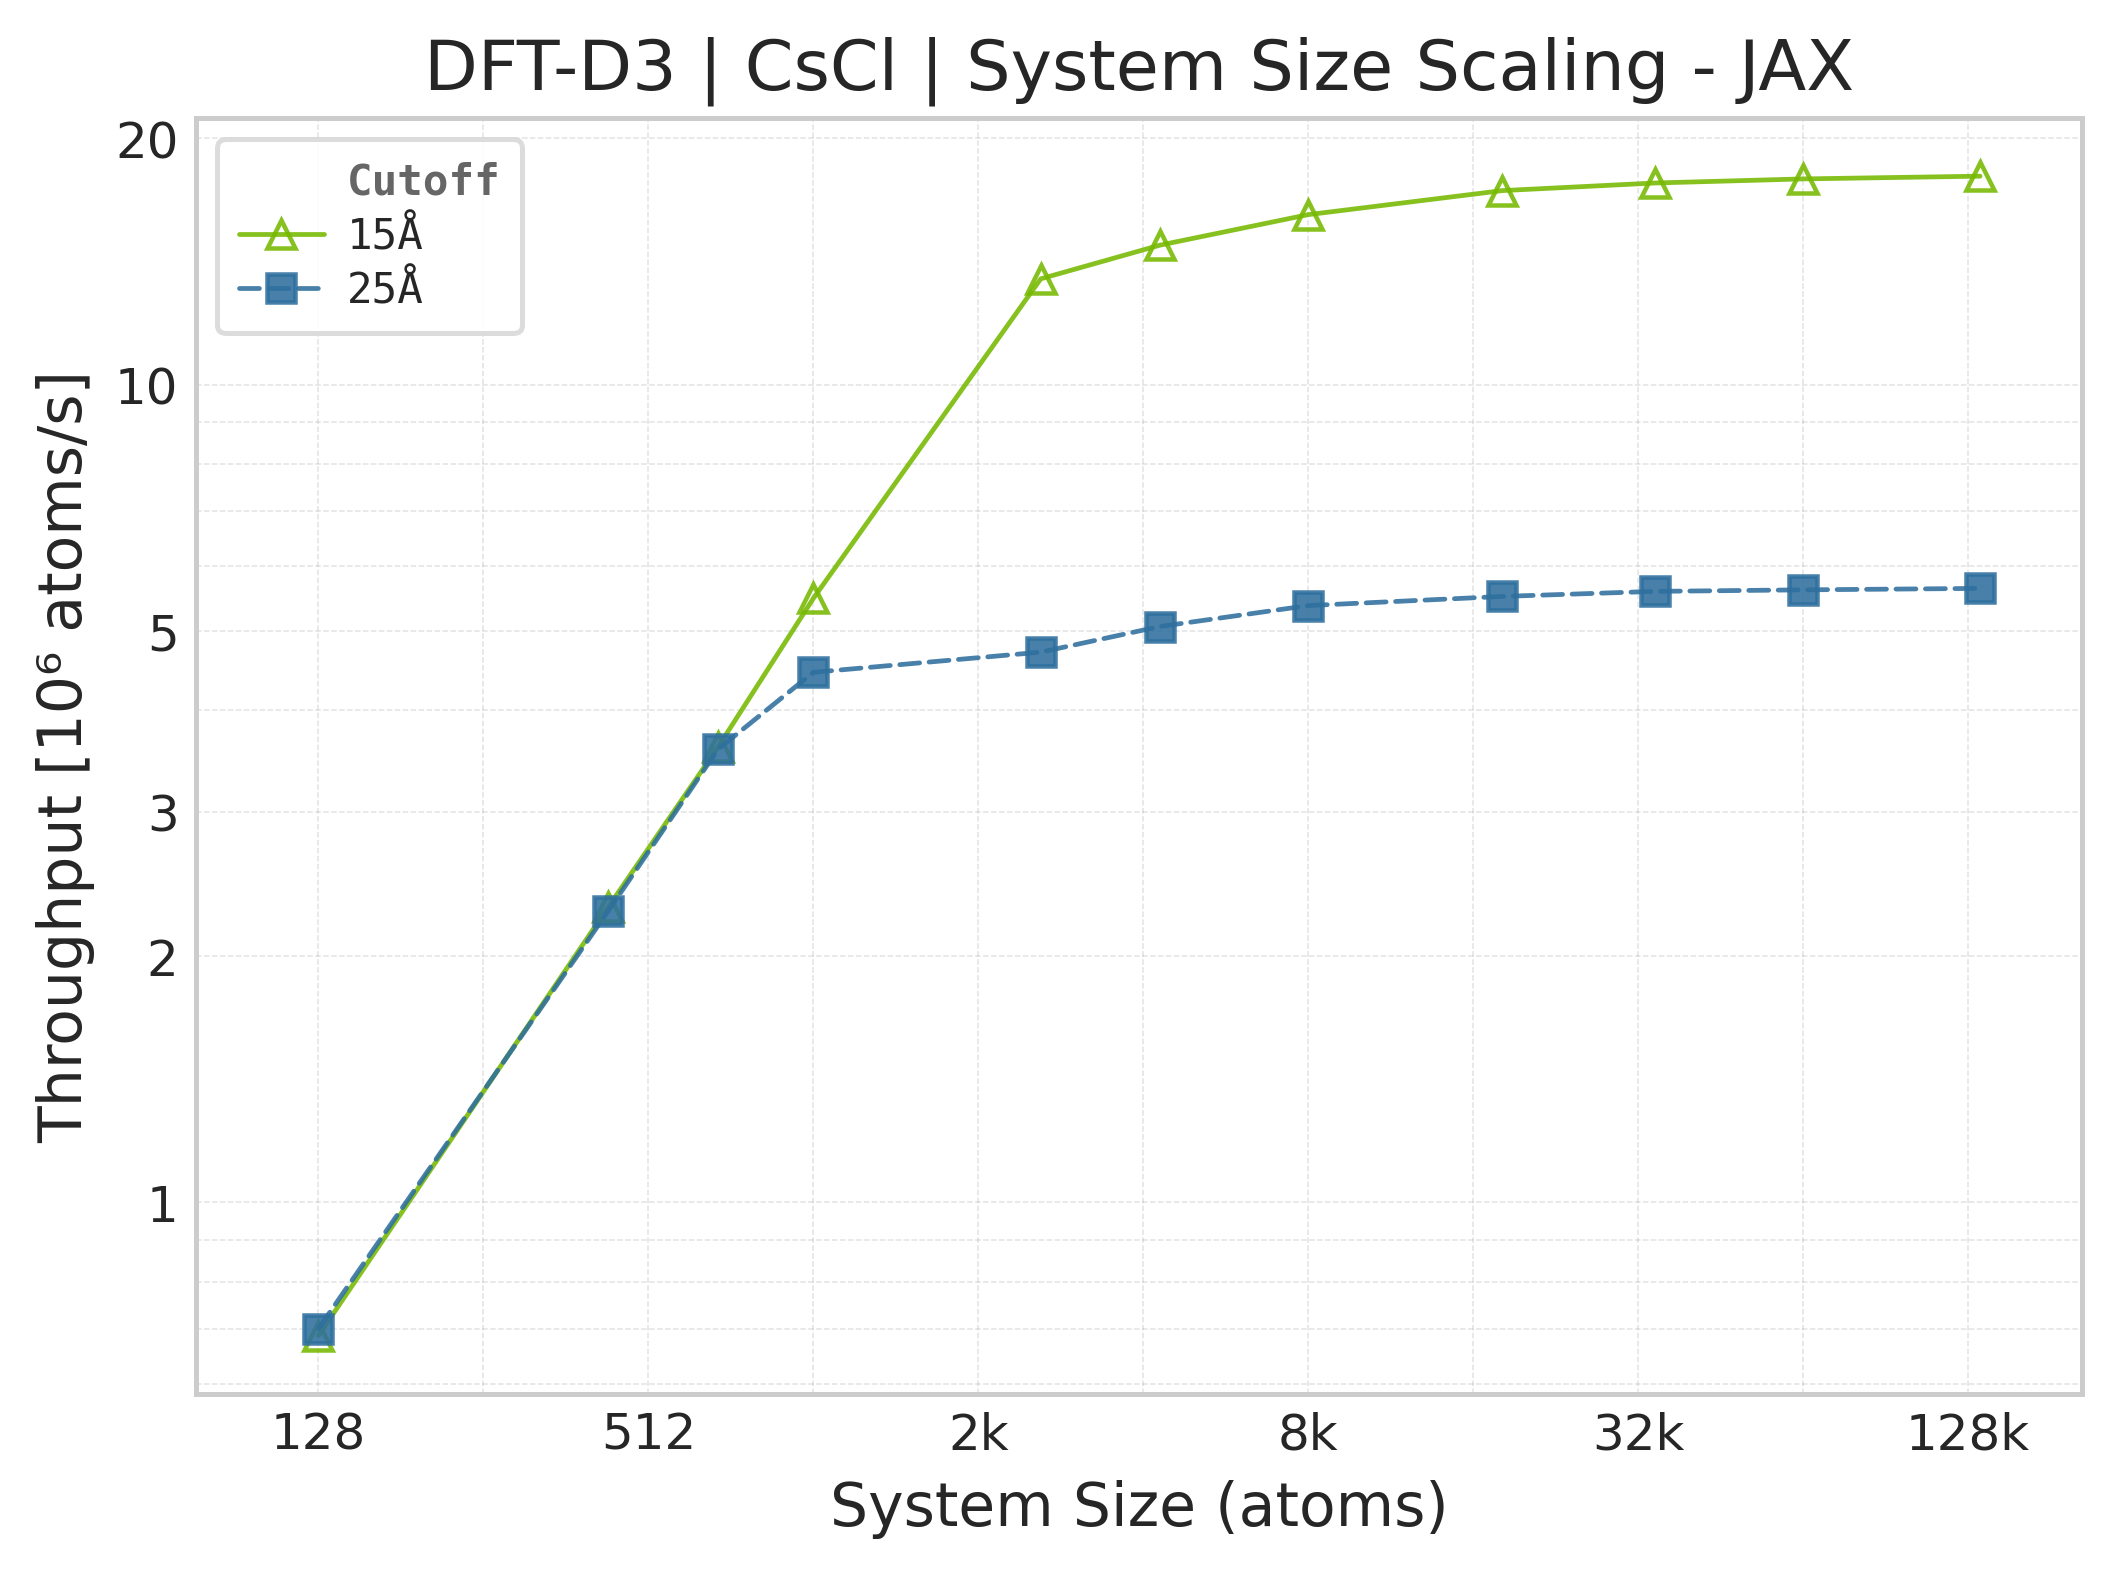
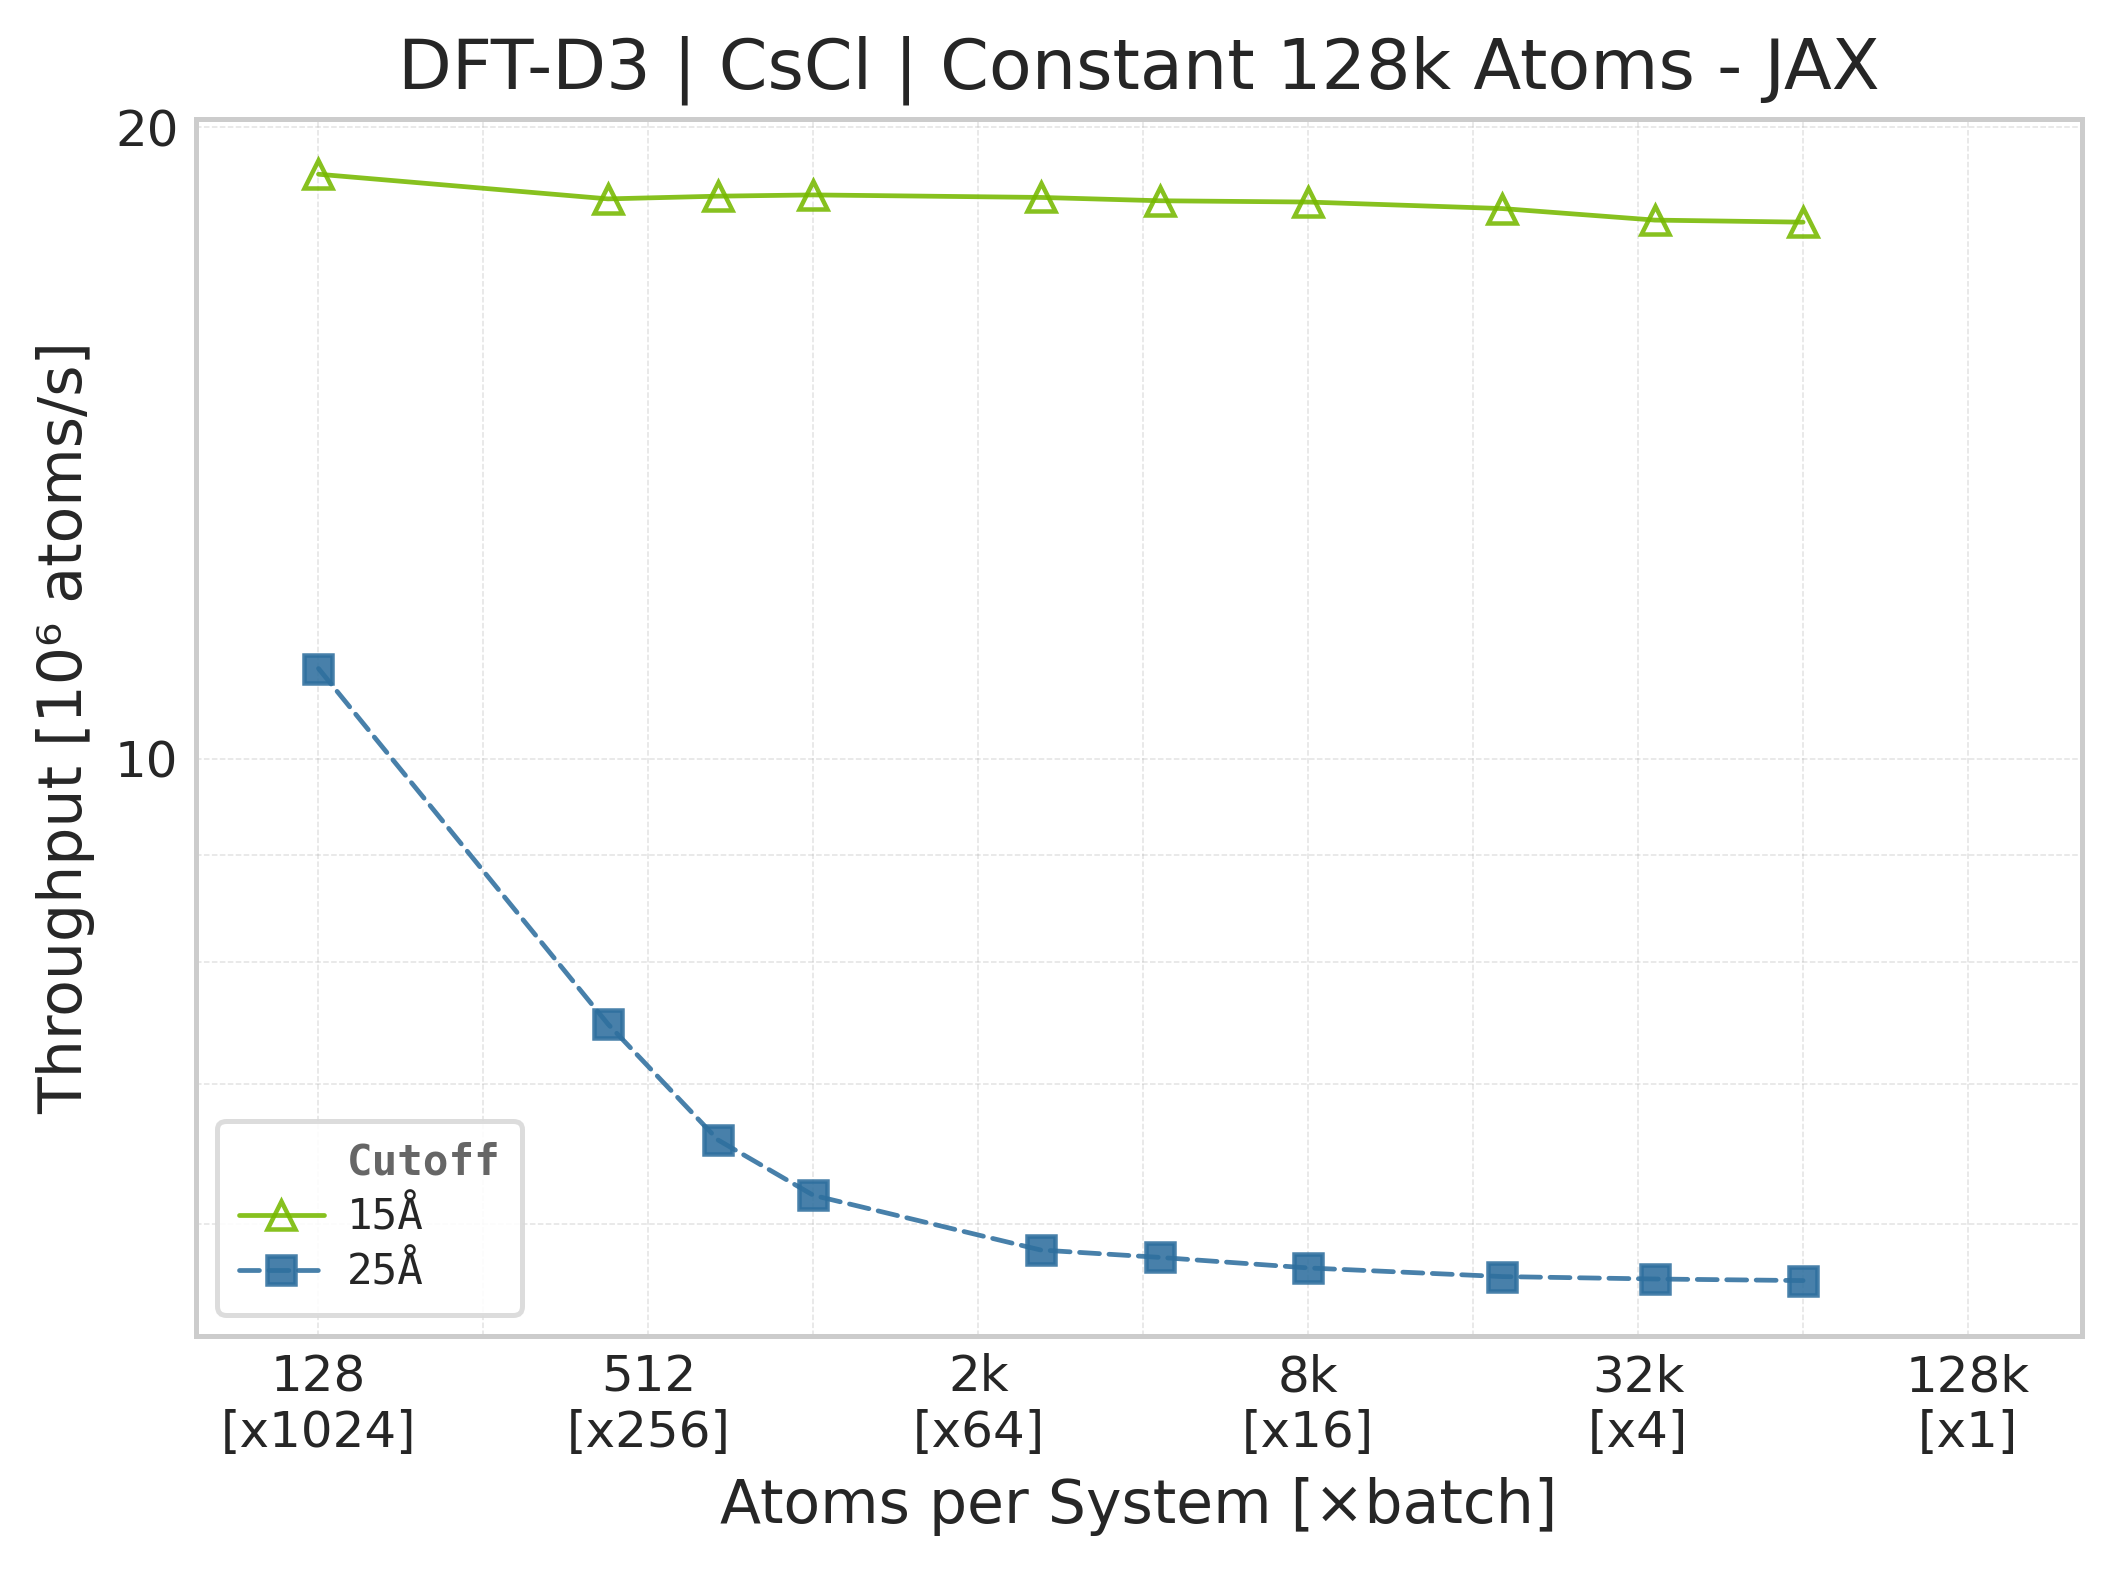
Throughput (\(10^6\) atoms/s) vs. system size (JAX).#
Note
JAX memory plots are omitted. The suite does not measure JAX memory: XLA’s allocator pool and buffer reuse make per-call allocation deltas unreliable. The Torch panels report the Torch allocator only; they are not a proxy for JAX memory because the framework wrappers, buffer lifetimes, and allocators differ.
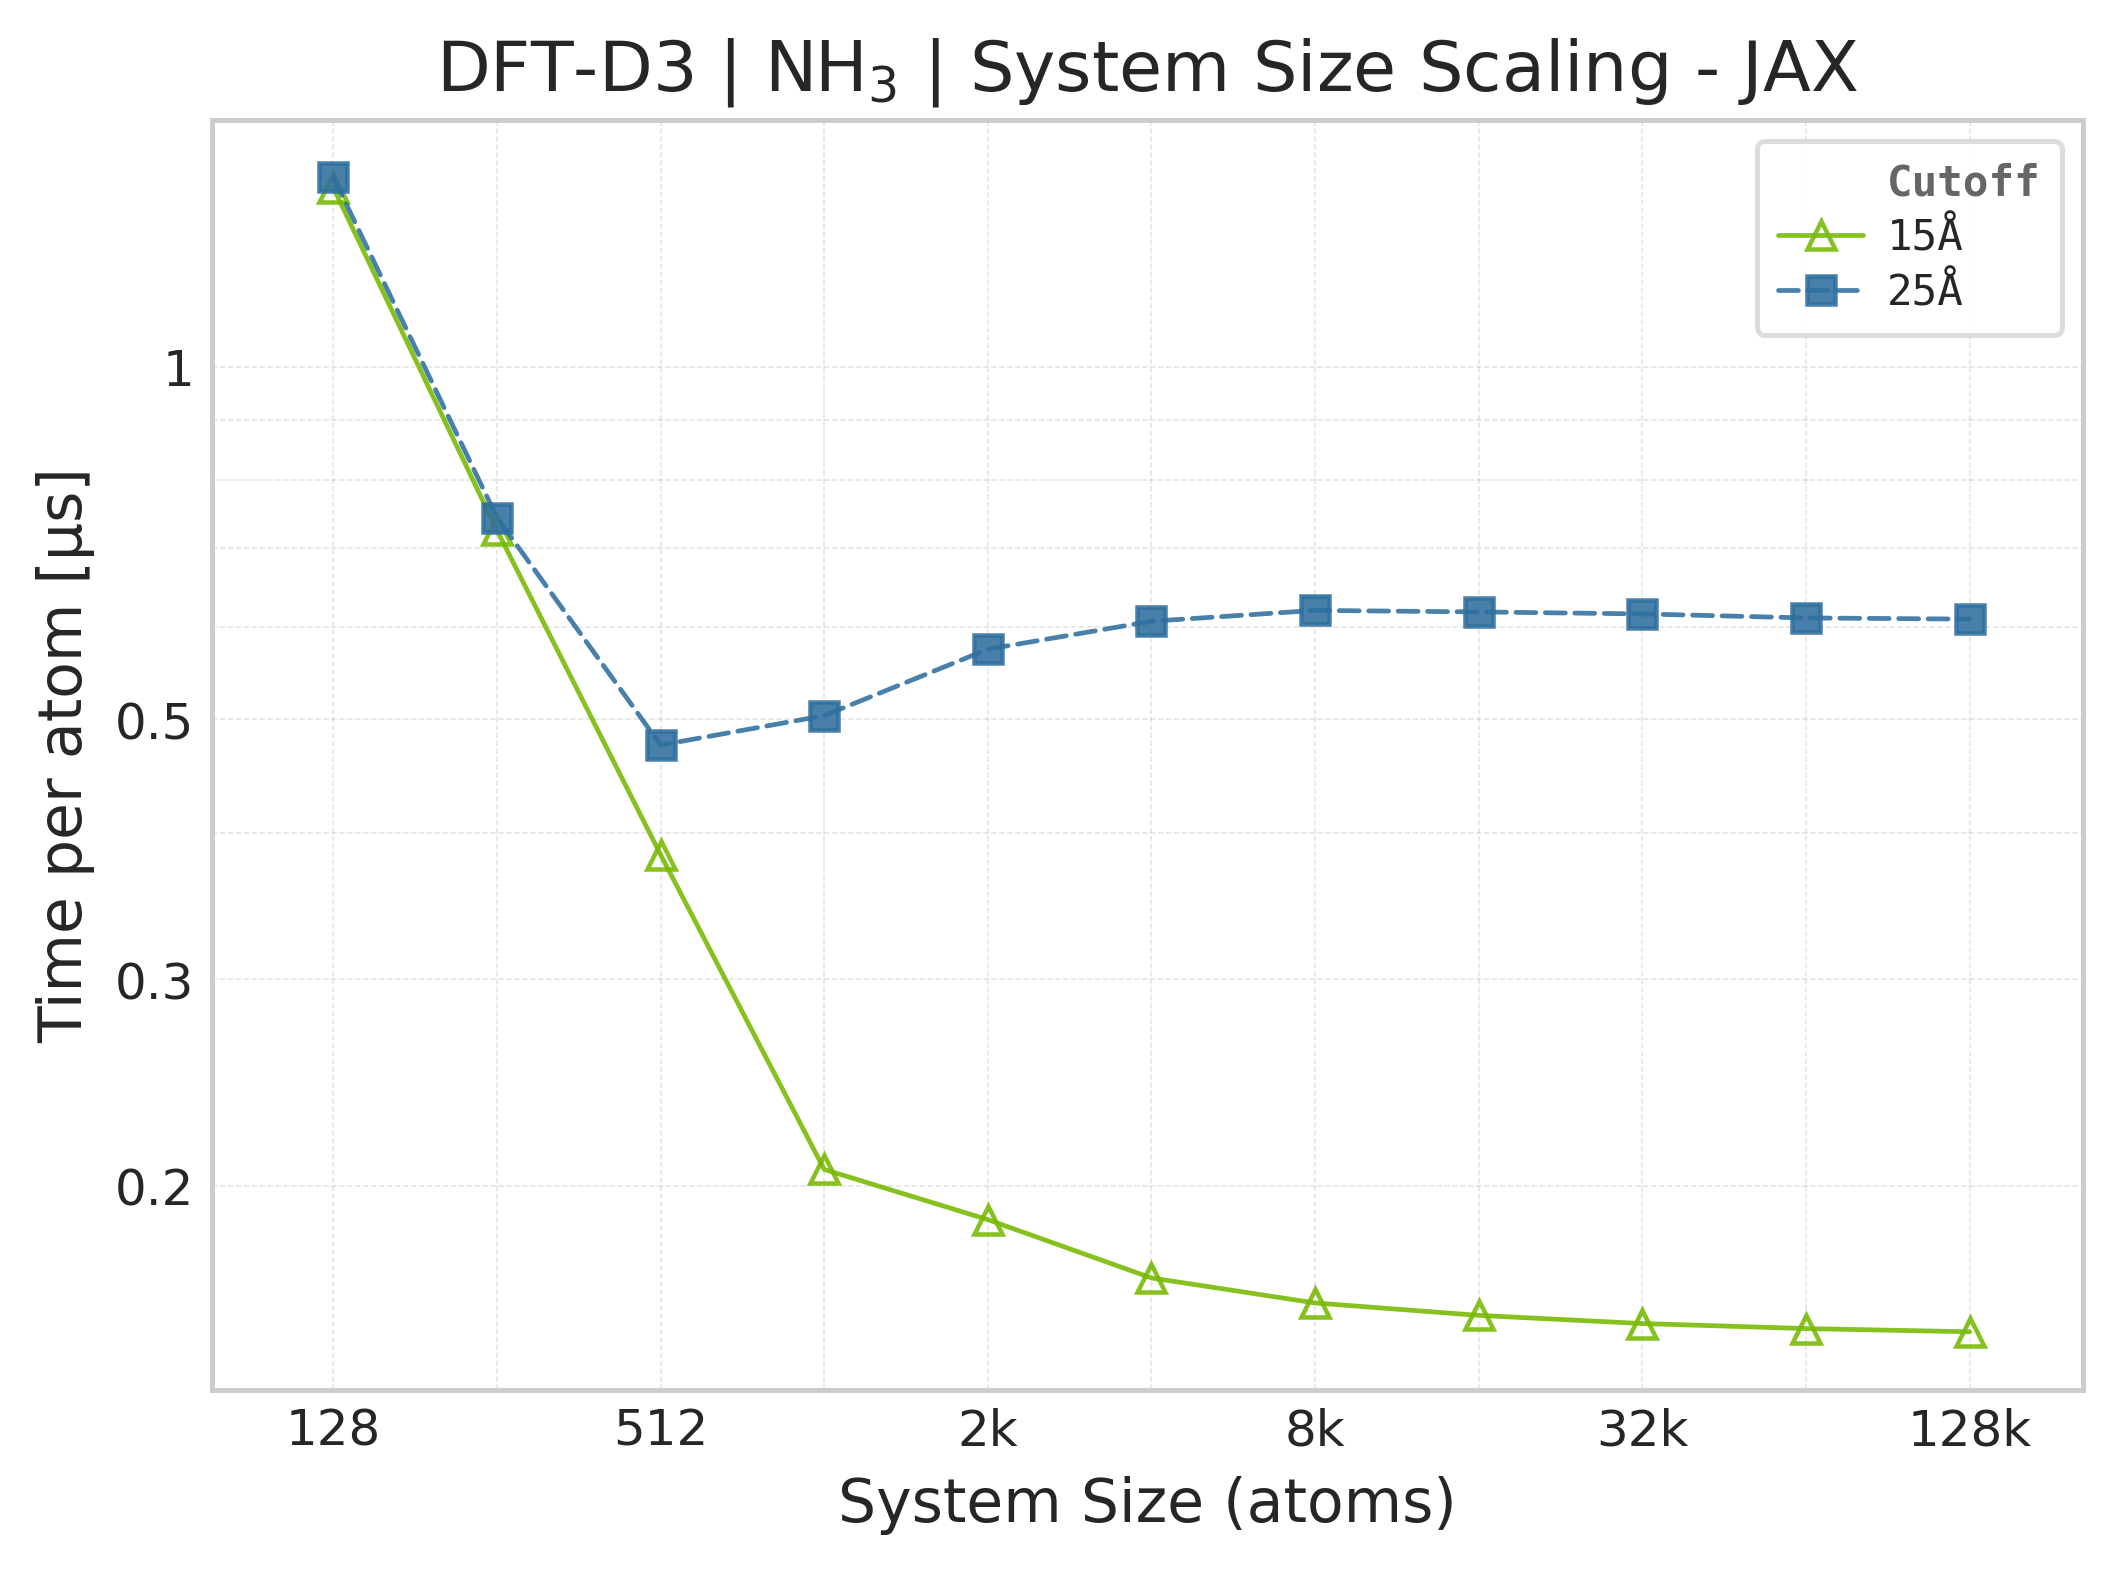
Mean execution time vs. system size (JAX, NH₃).#
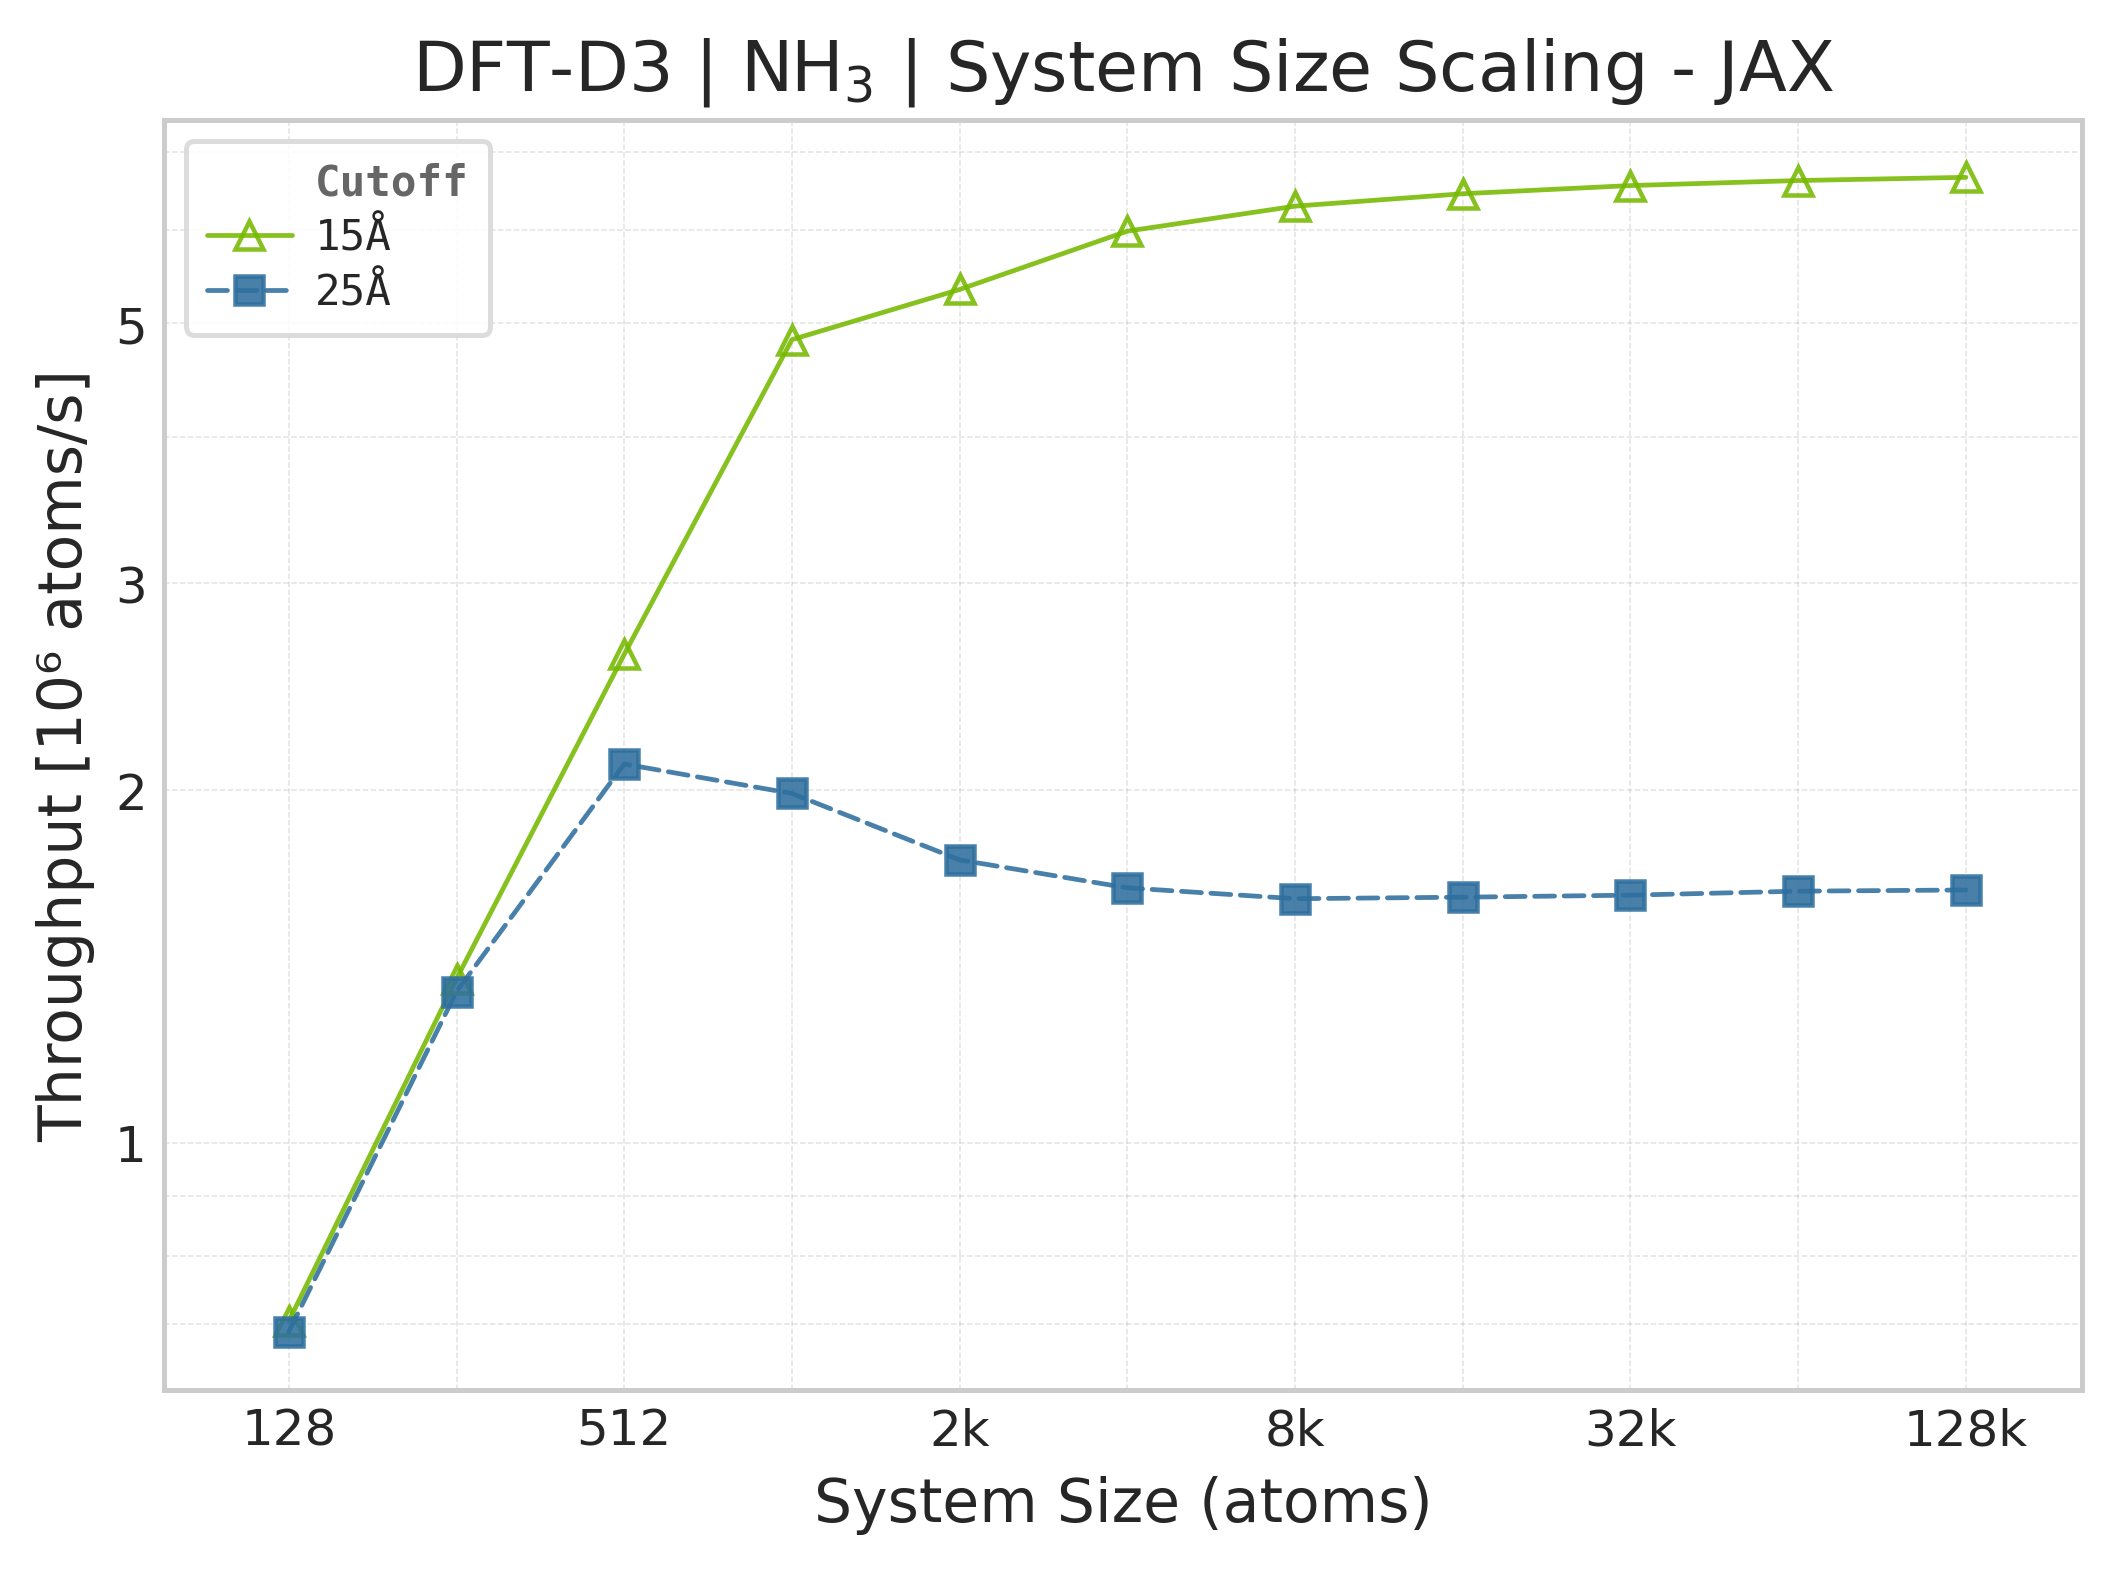
Throughput (\(10^6\) atoms/s) vs. system size (JAX, NH₃).#
Note
JAX memory plots are omitted. The suite does not measure JAX memory: XLA’s allocator pool and buffer reuse make per-call allocation deltas unreliable. The Torch panels report the Torch allocator only; they are not a proxy for JAX memory because the framework wrappers, buffer lifetimes, and allocators differ.
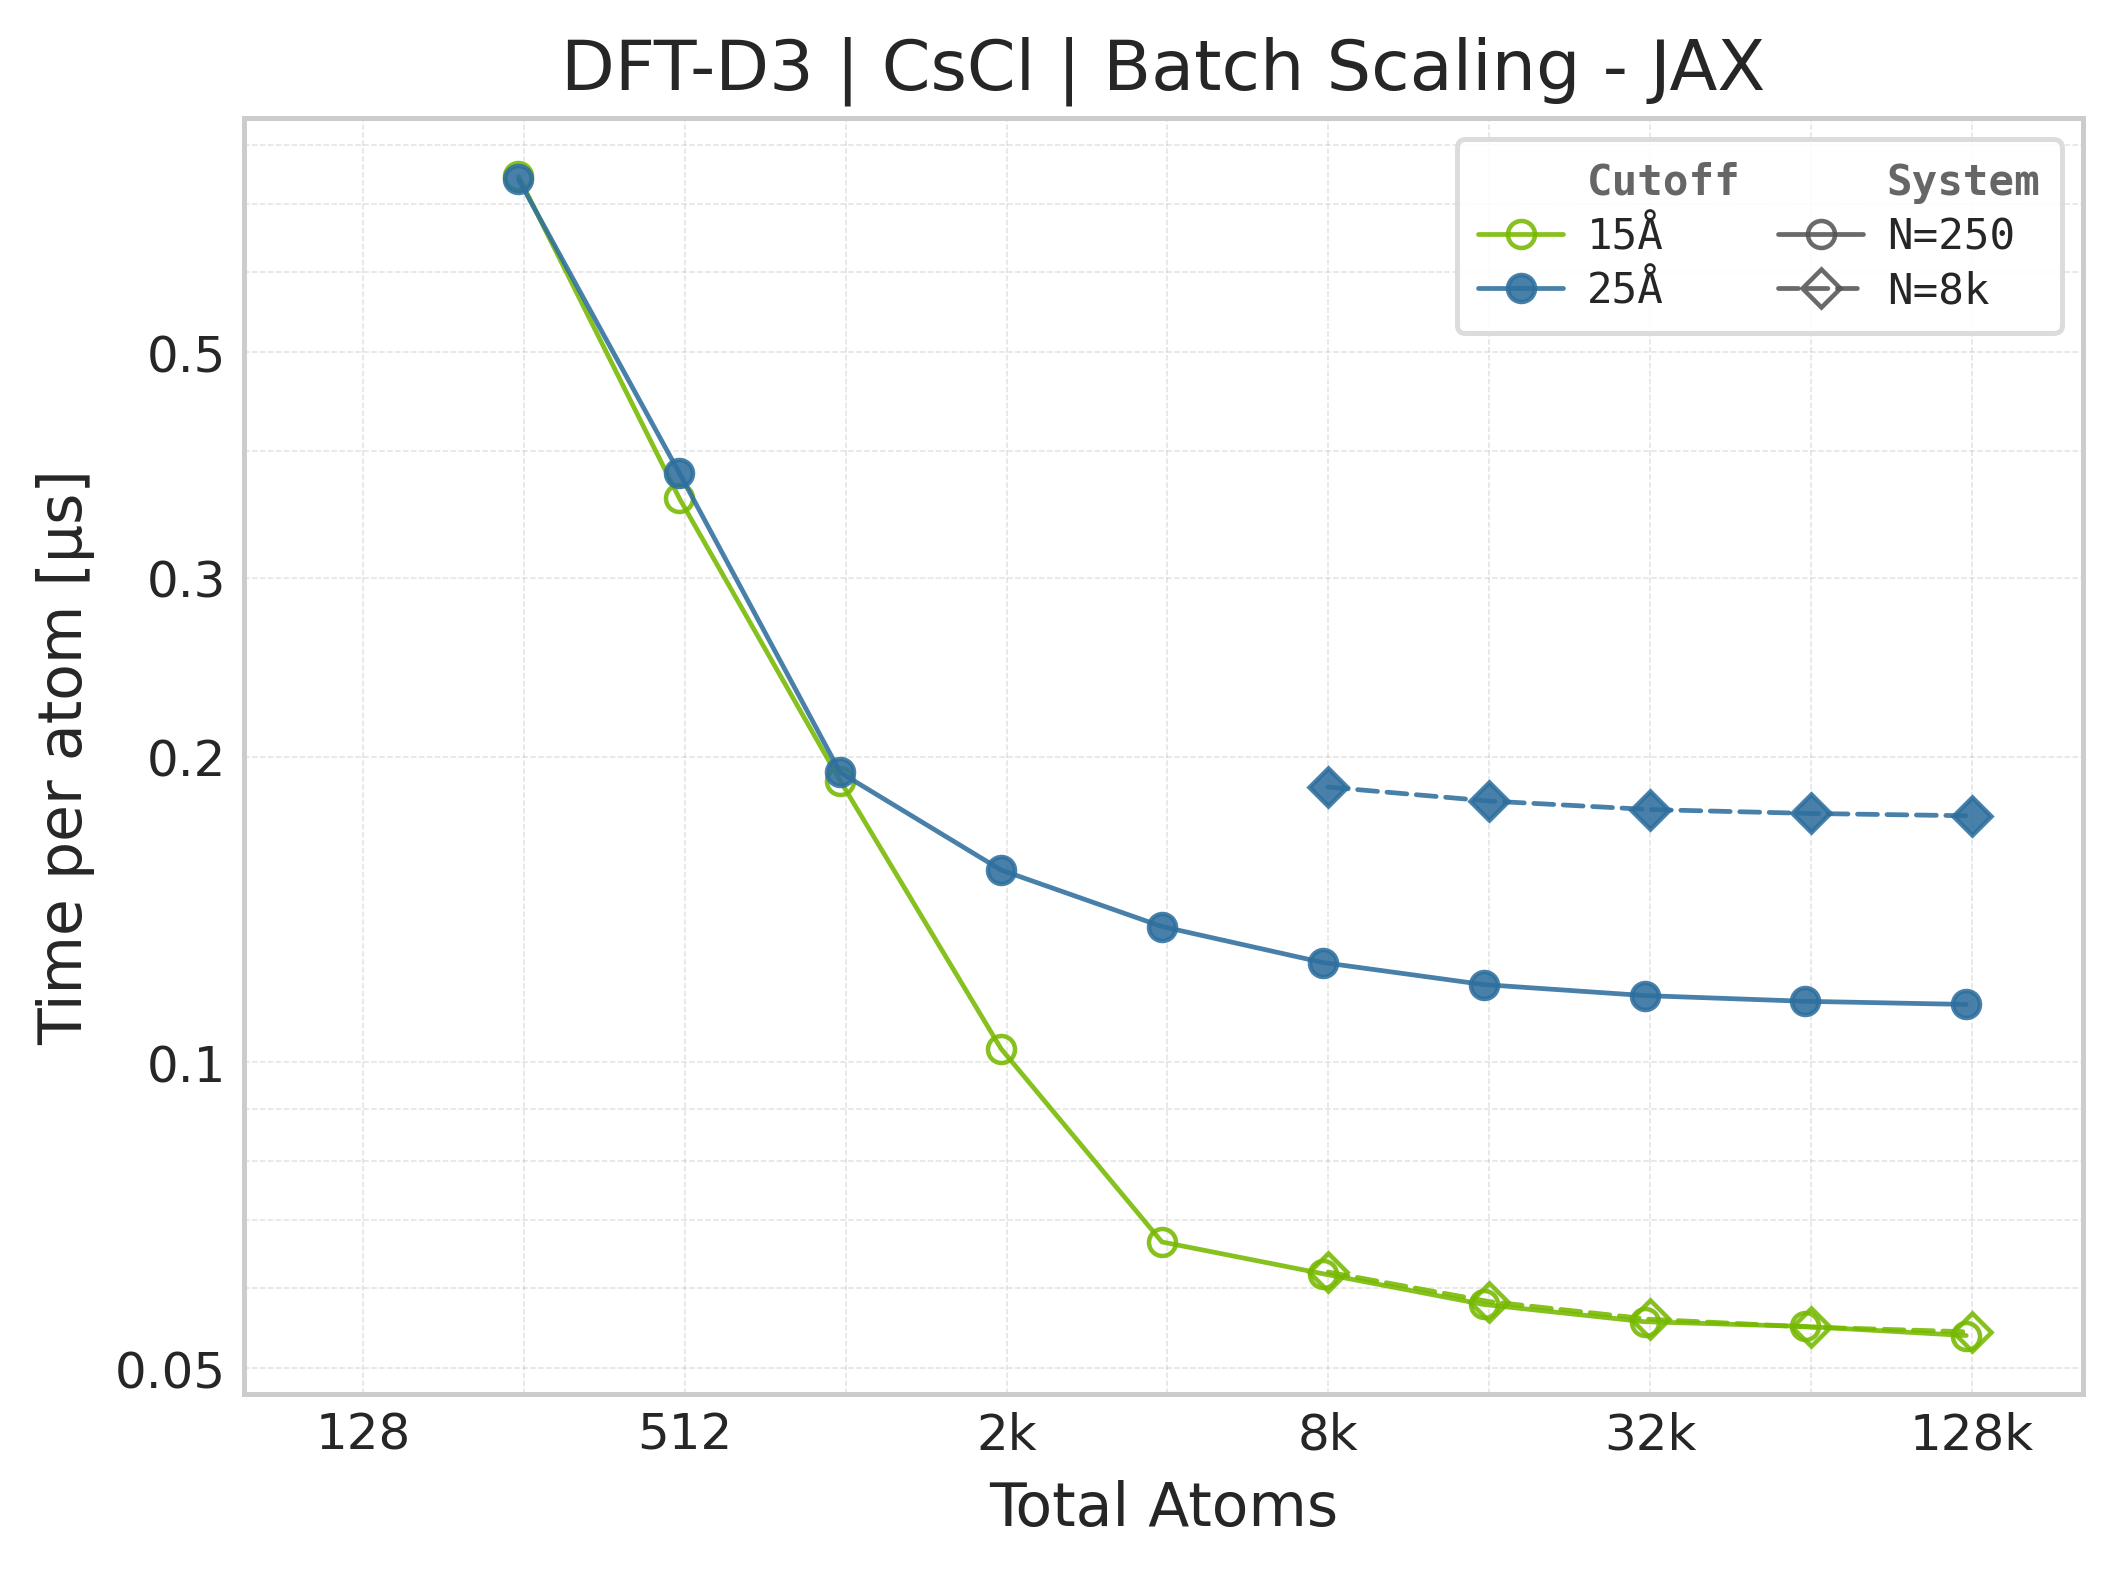
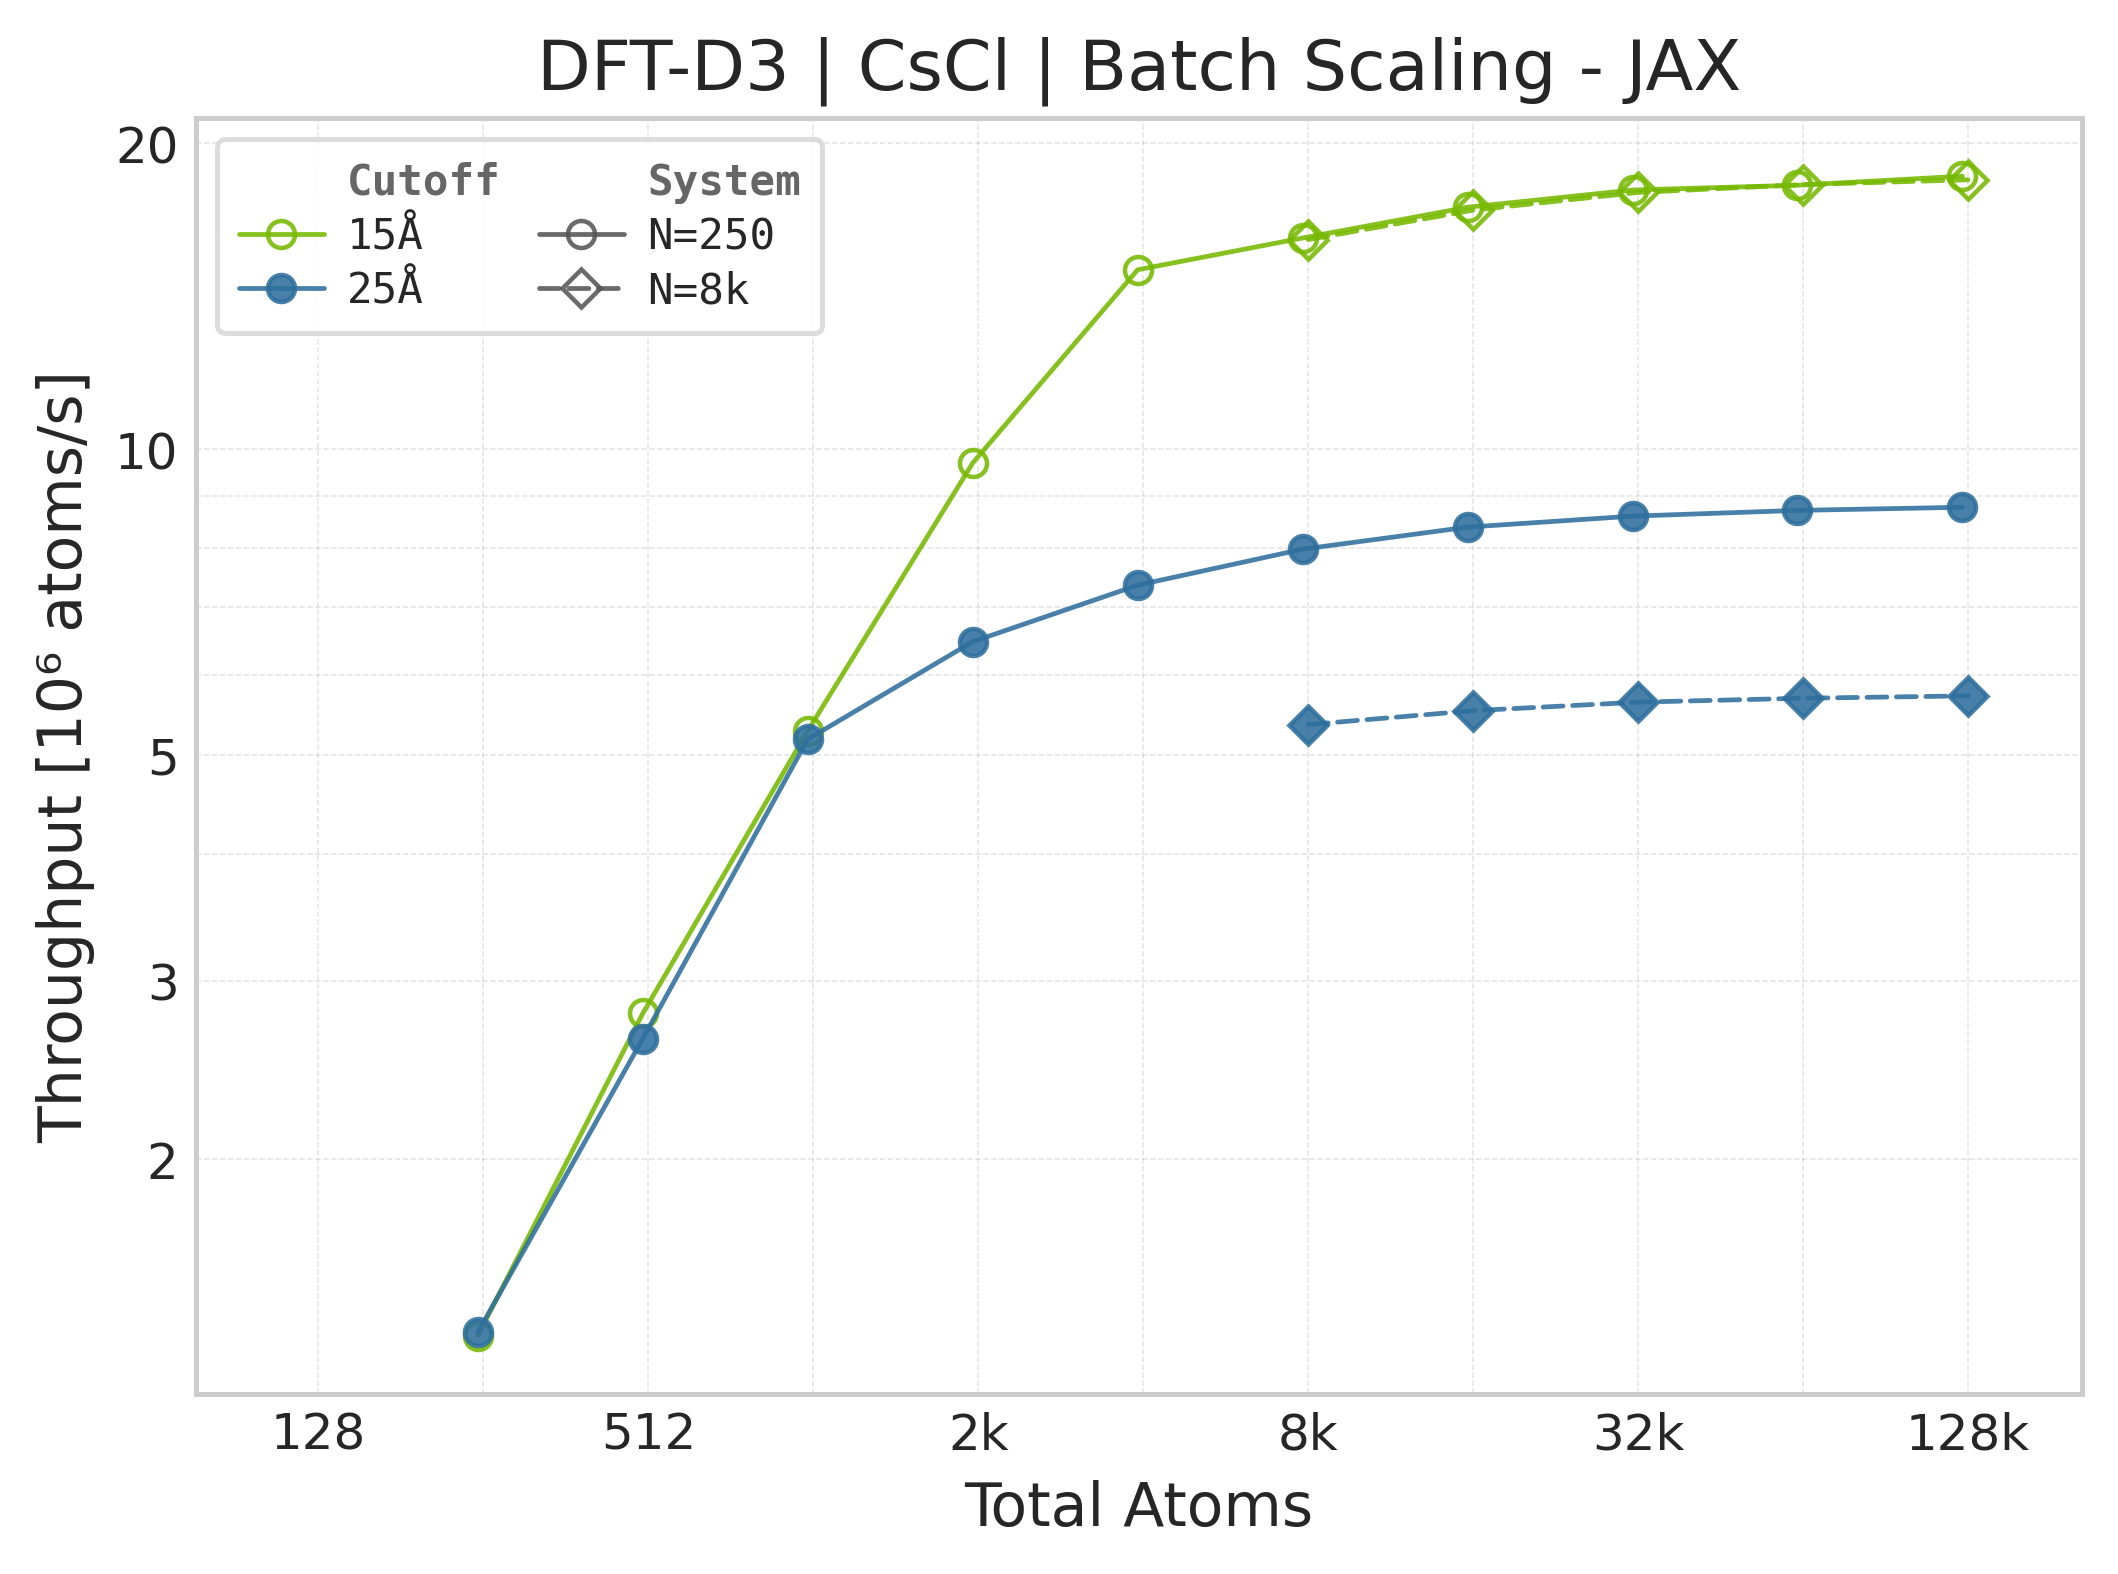
These panels use matched successful Torch and JAX points for the same system, cutoff, and scaling coordinate. Both backends time the DFT-D3 call with the neighbor list built beforehand, and both exclude warmup/compile work. Torch uses CUDA events while JAX uses wall-clock timing with a final synchronized result, so the workload is aligned but the timing harness and framework overheads are not identical. Memory panels contain Torch data only.
Torch vs. JAX execution time comparison (CsCl).#
Torch vs. JAX throughput comparison.#
Memory vs. system size (Torch only — JAX memory not measured).#
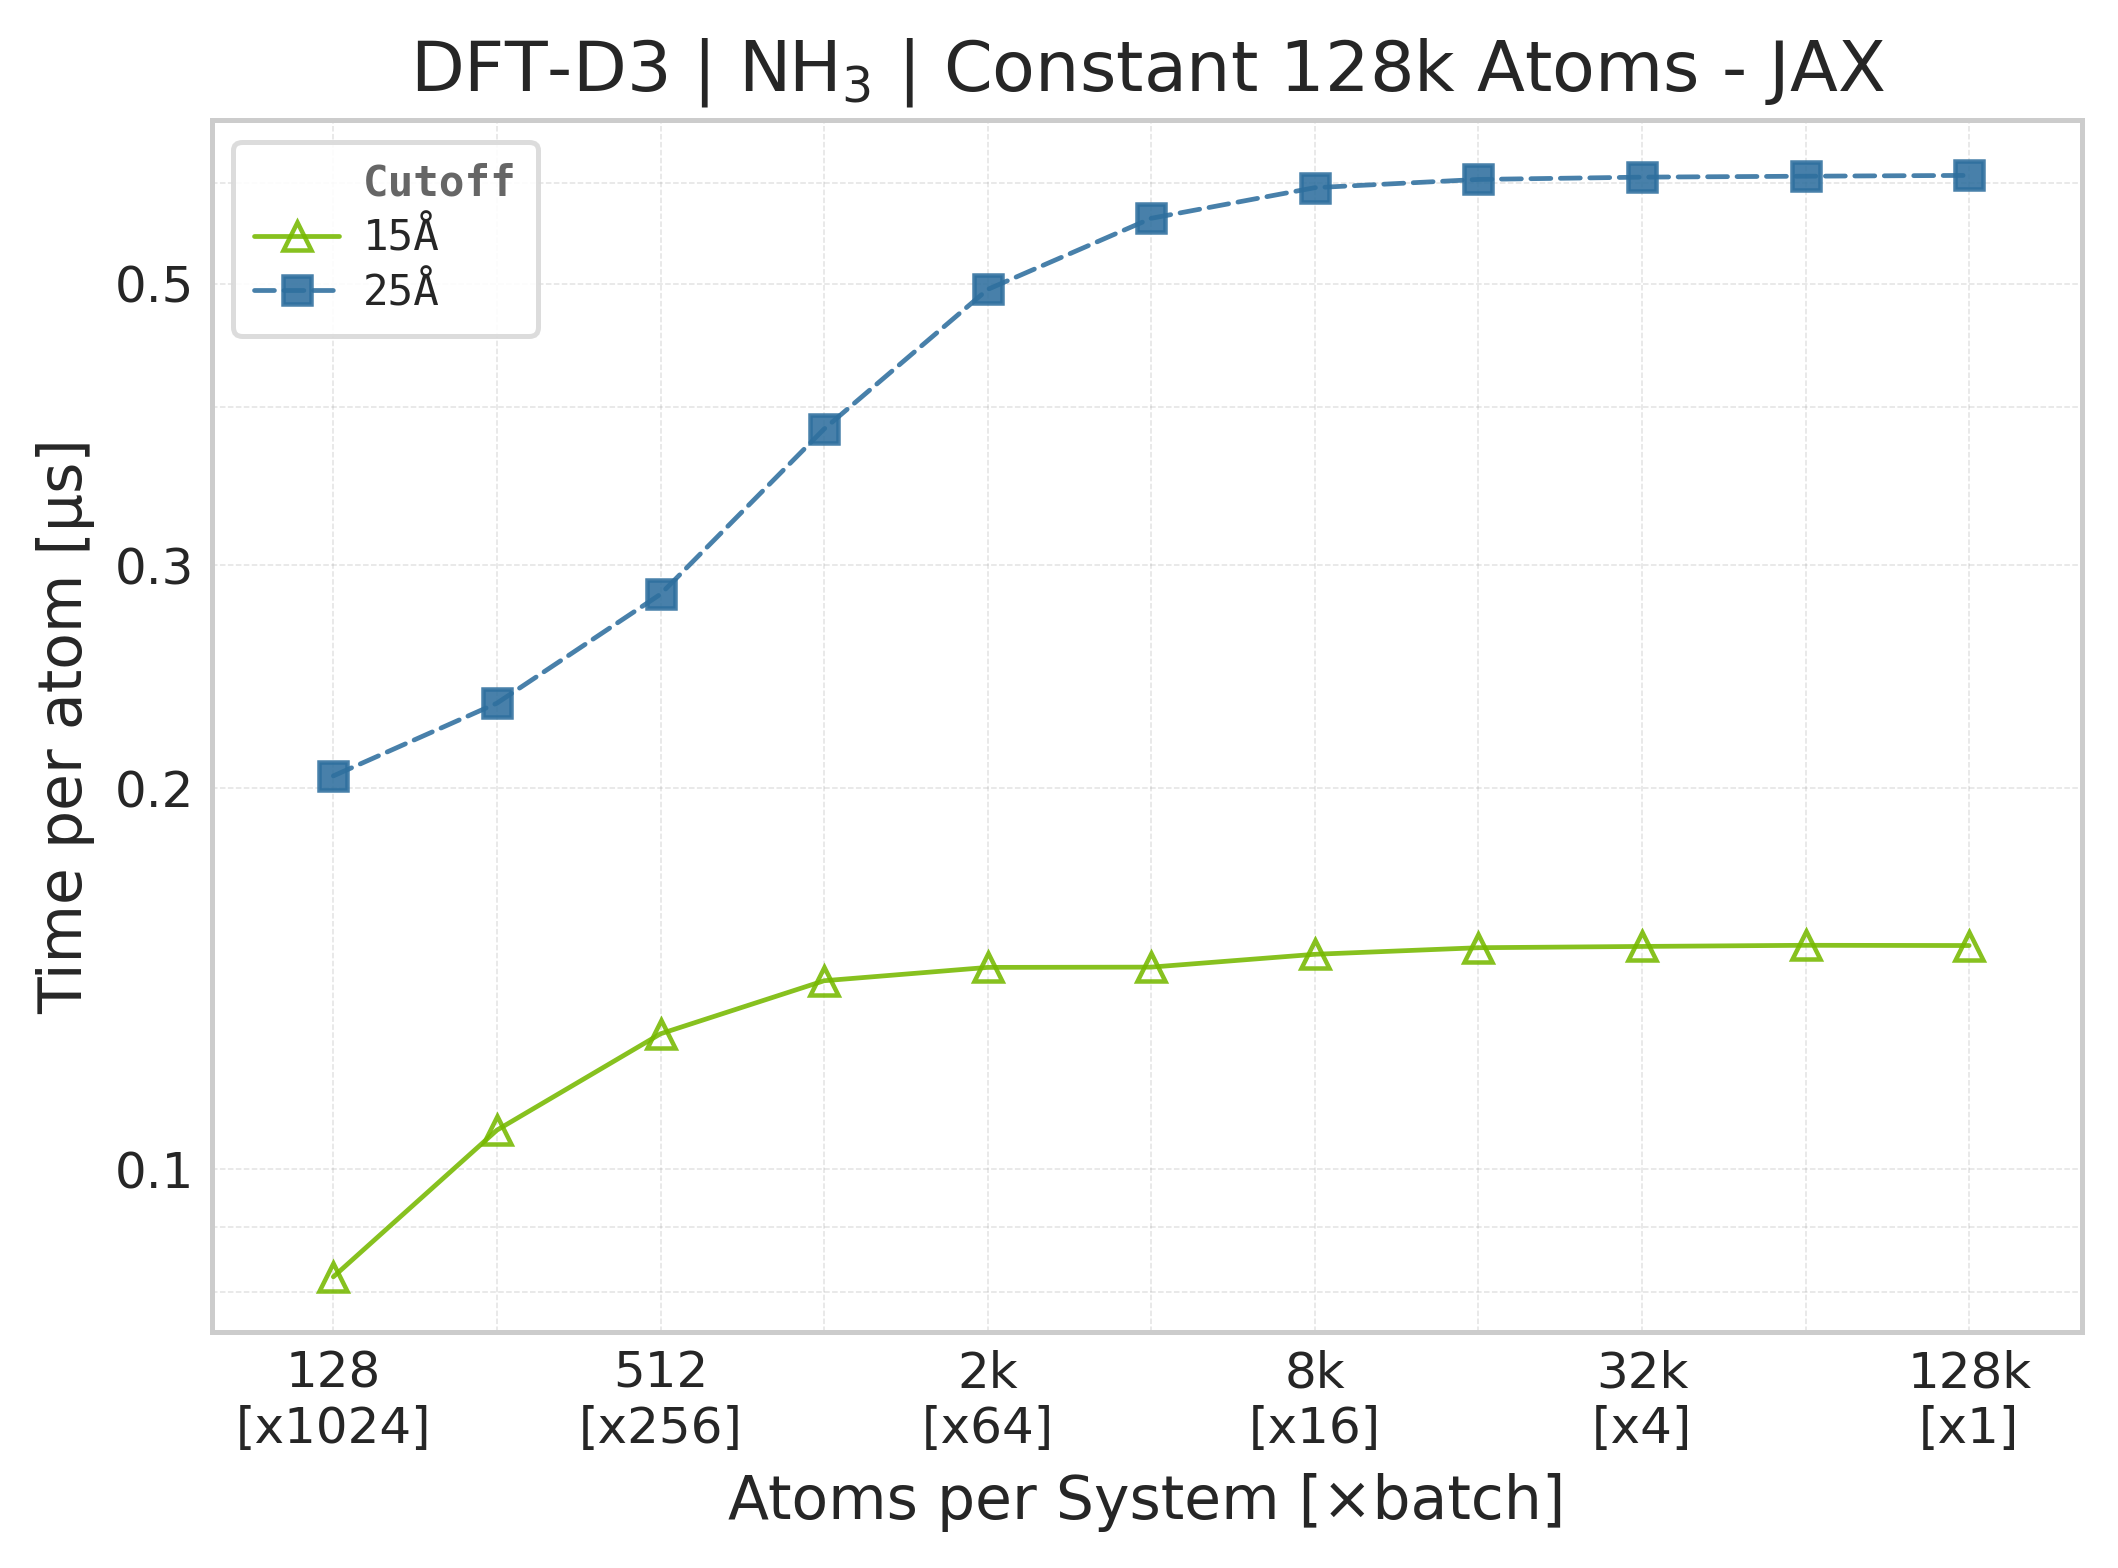
Torch vs. JAX execution time comparison (NH₃).#
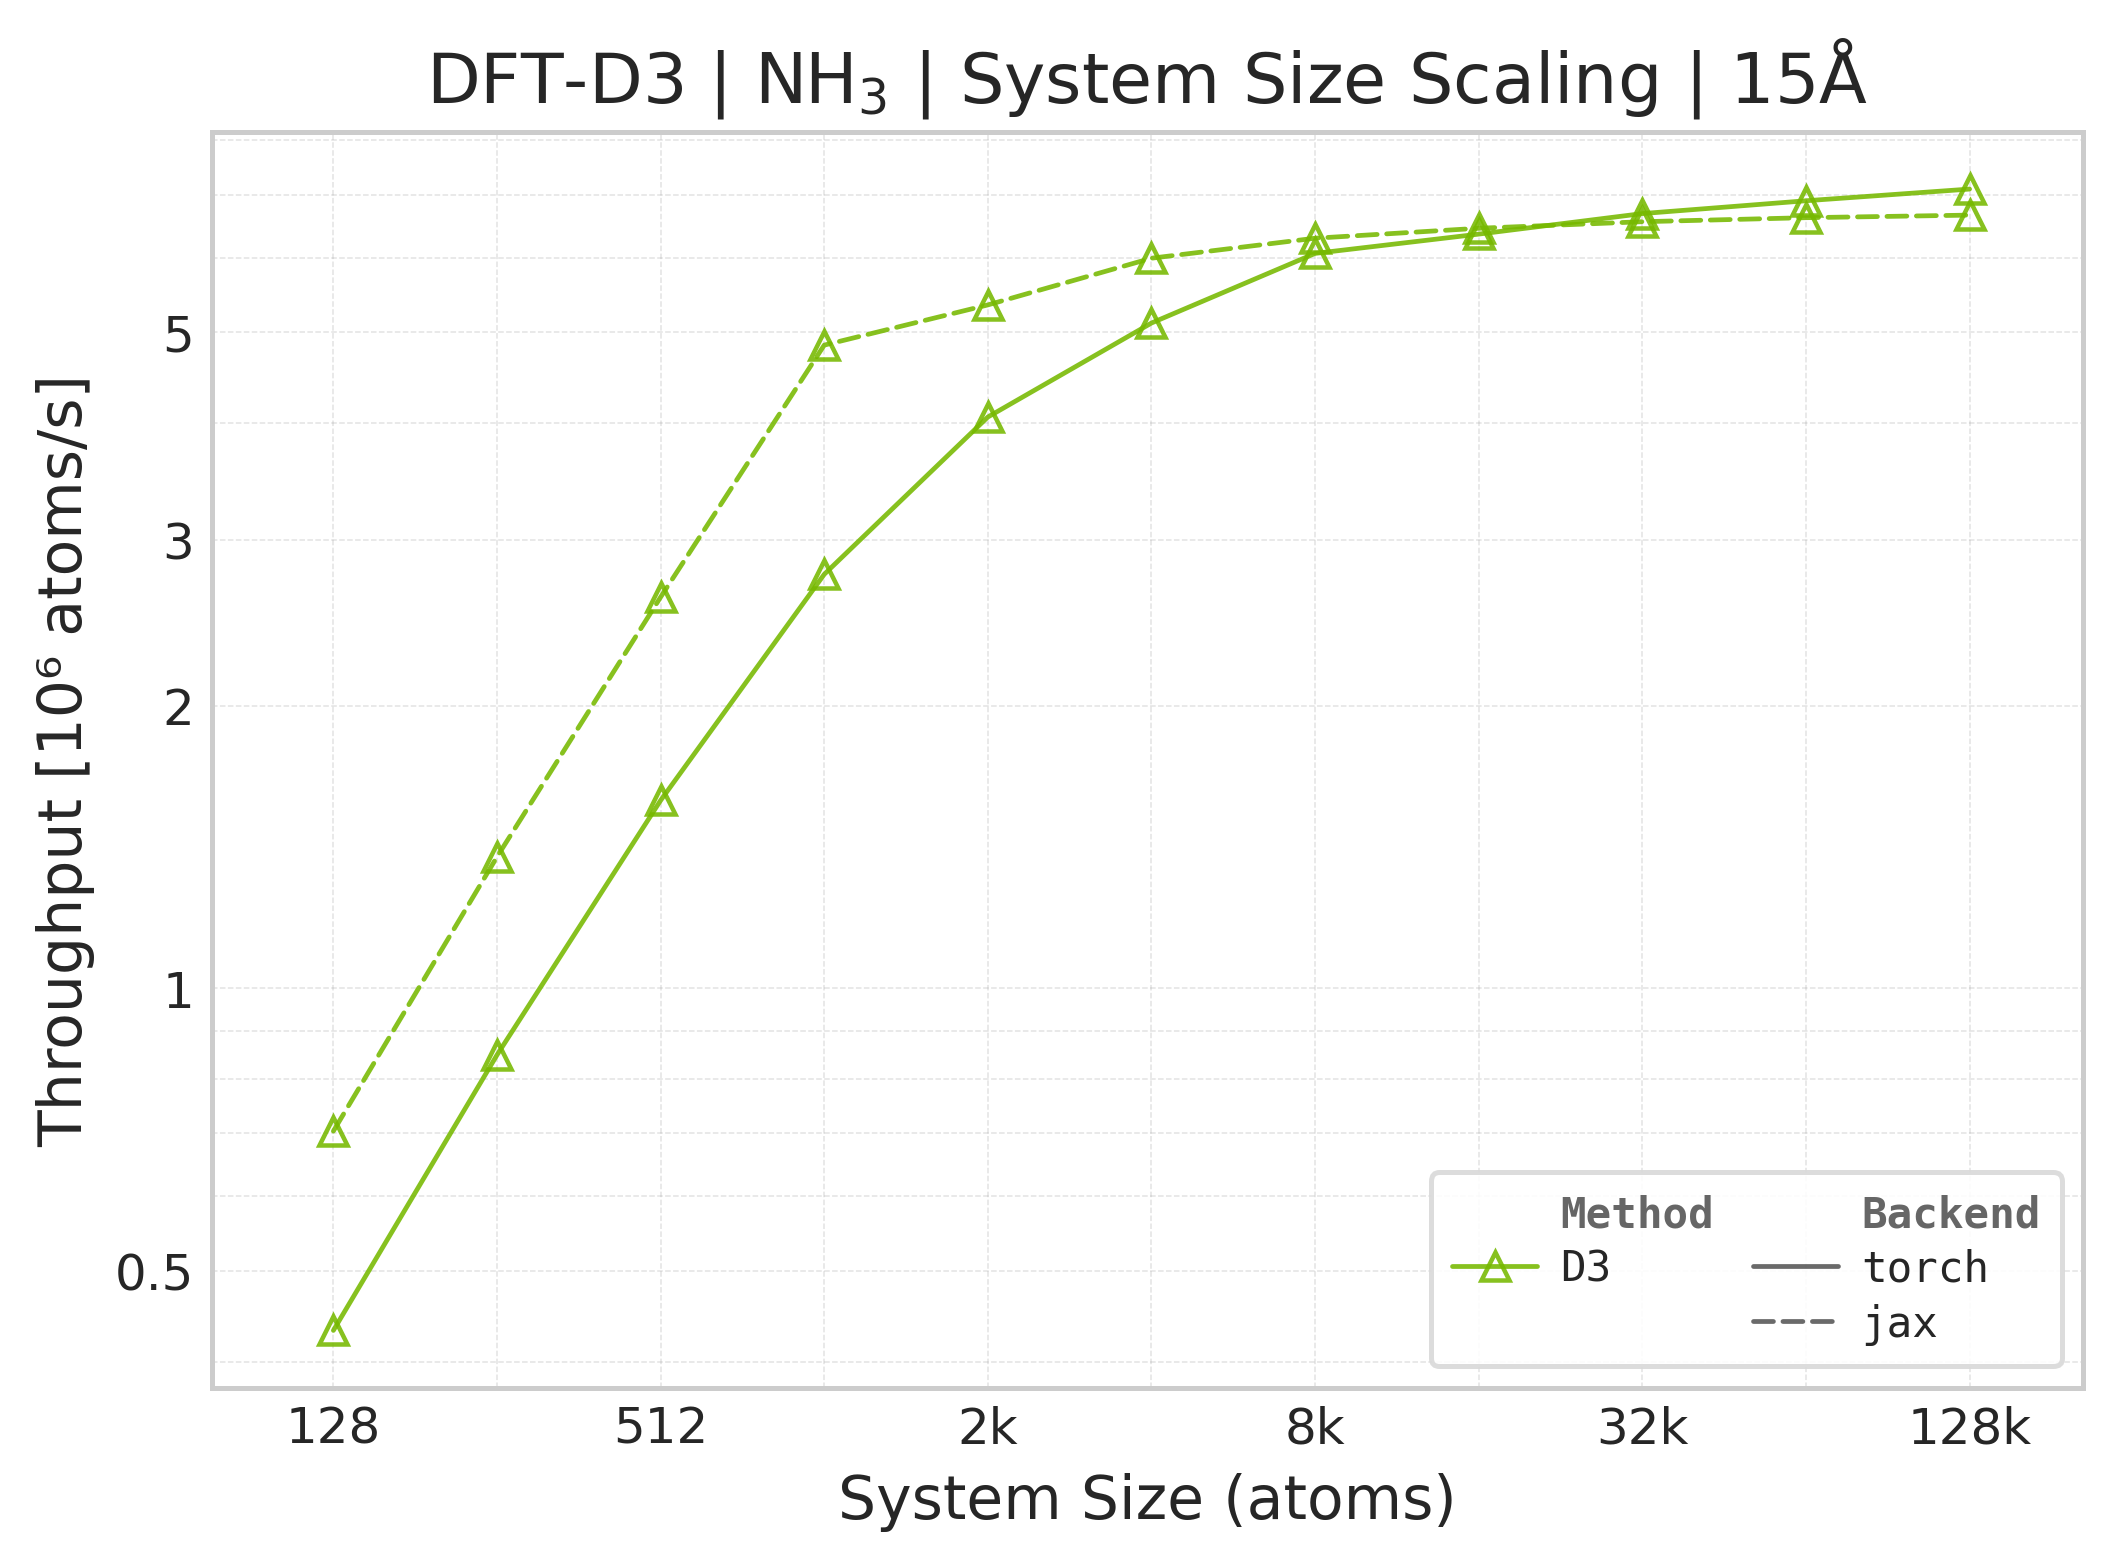
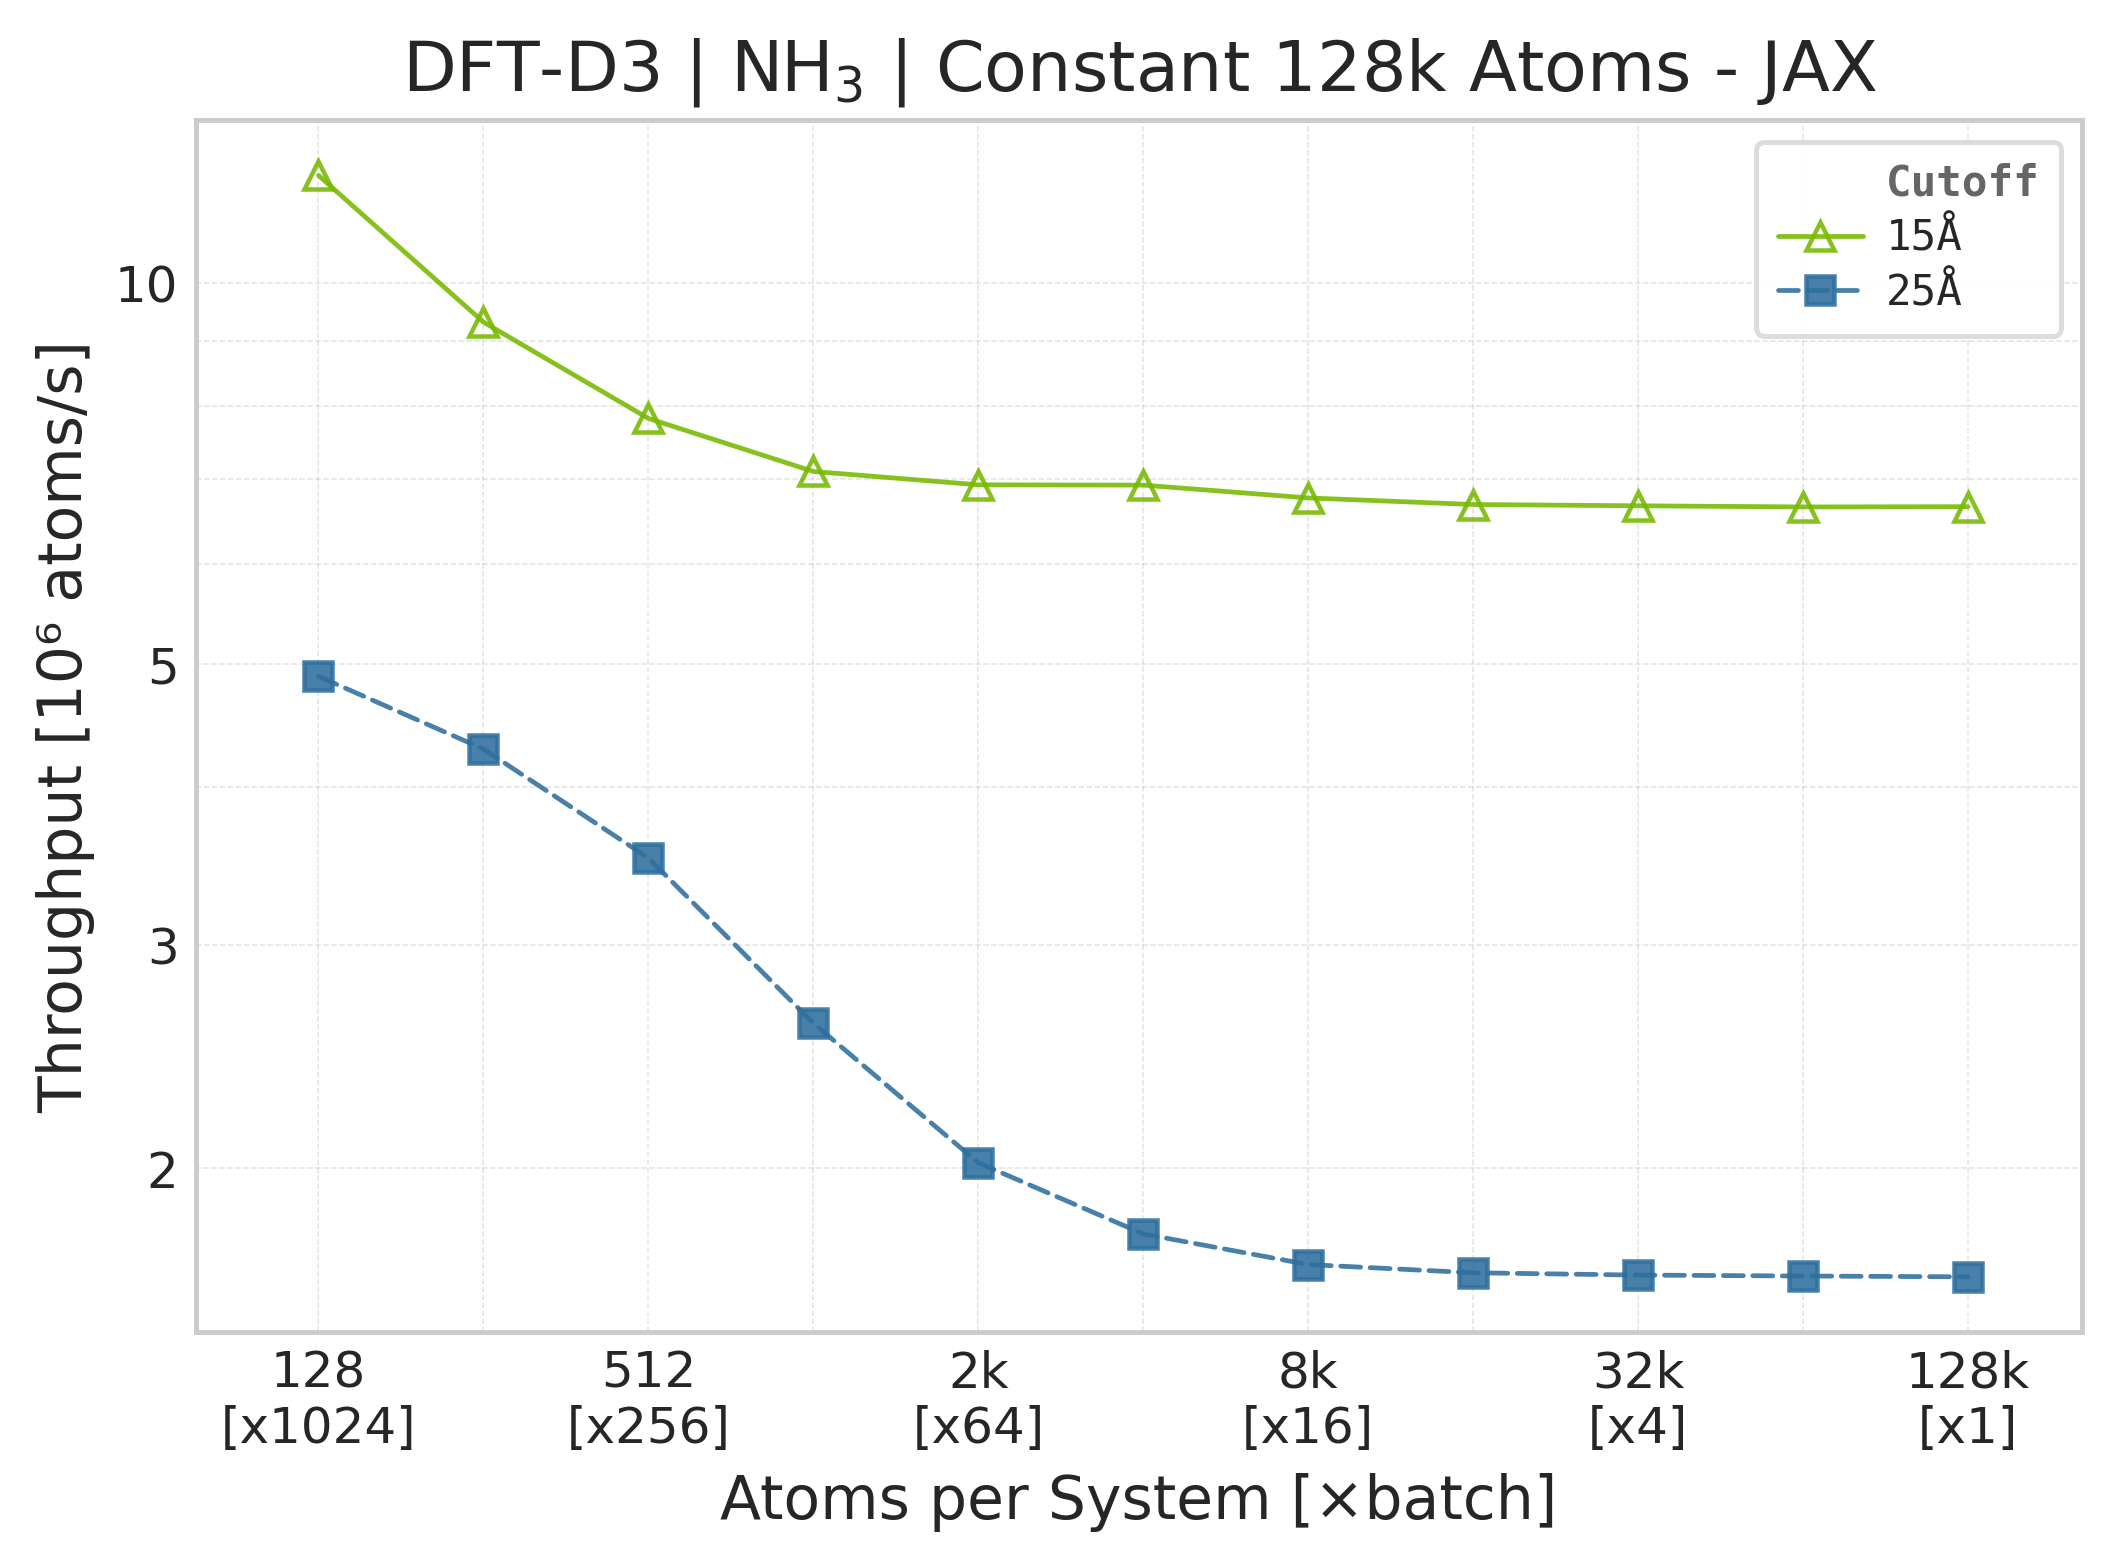
Torch vs. JAX throughput comparison (NH₃).#
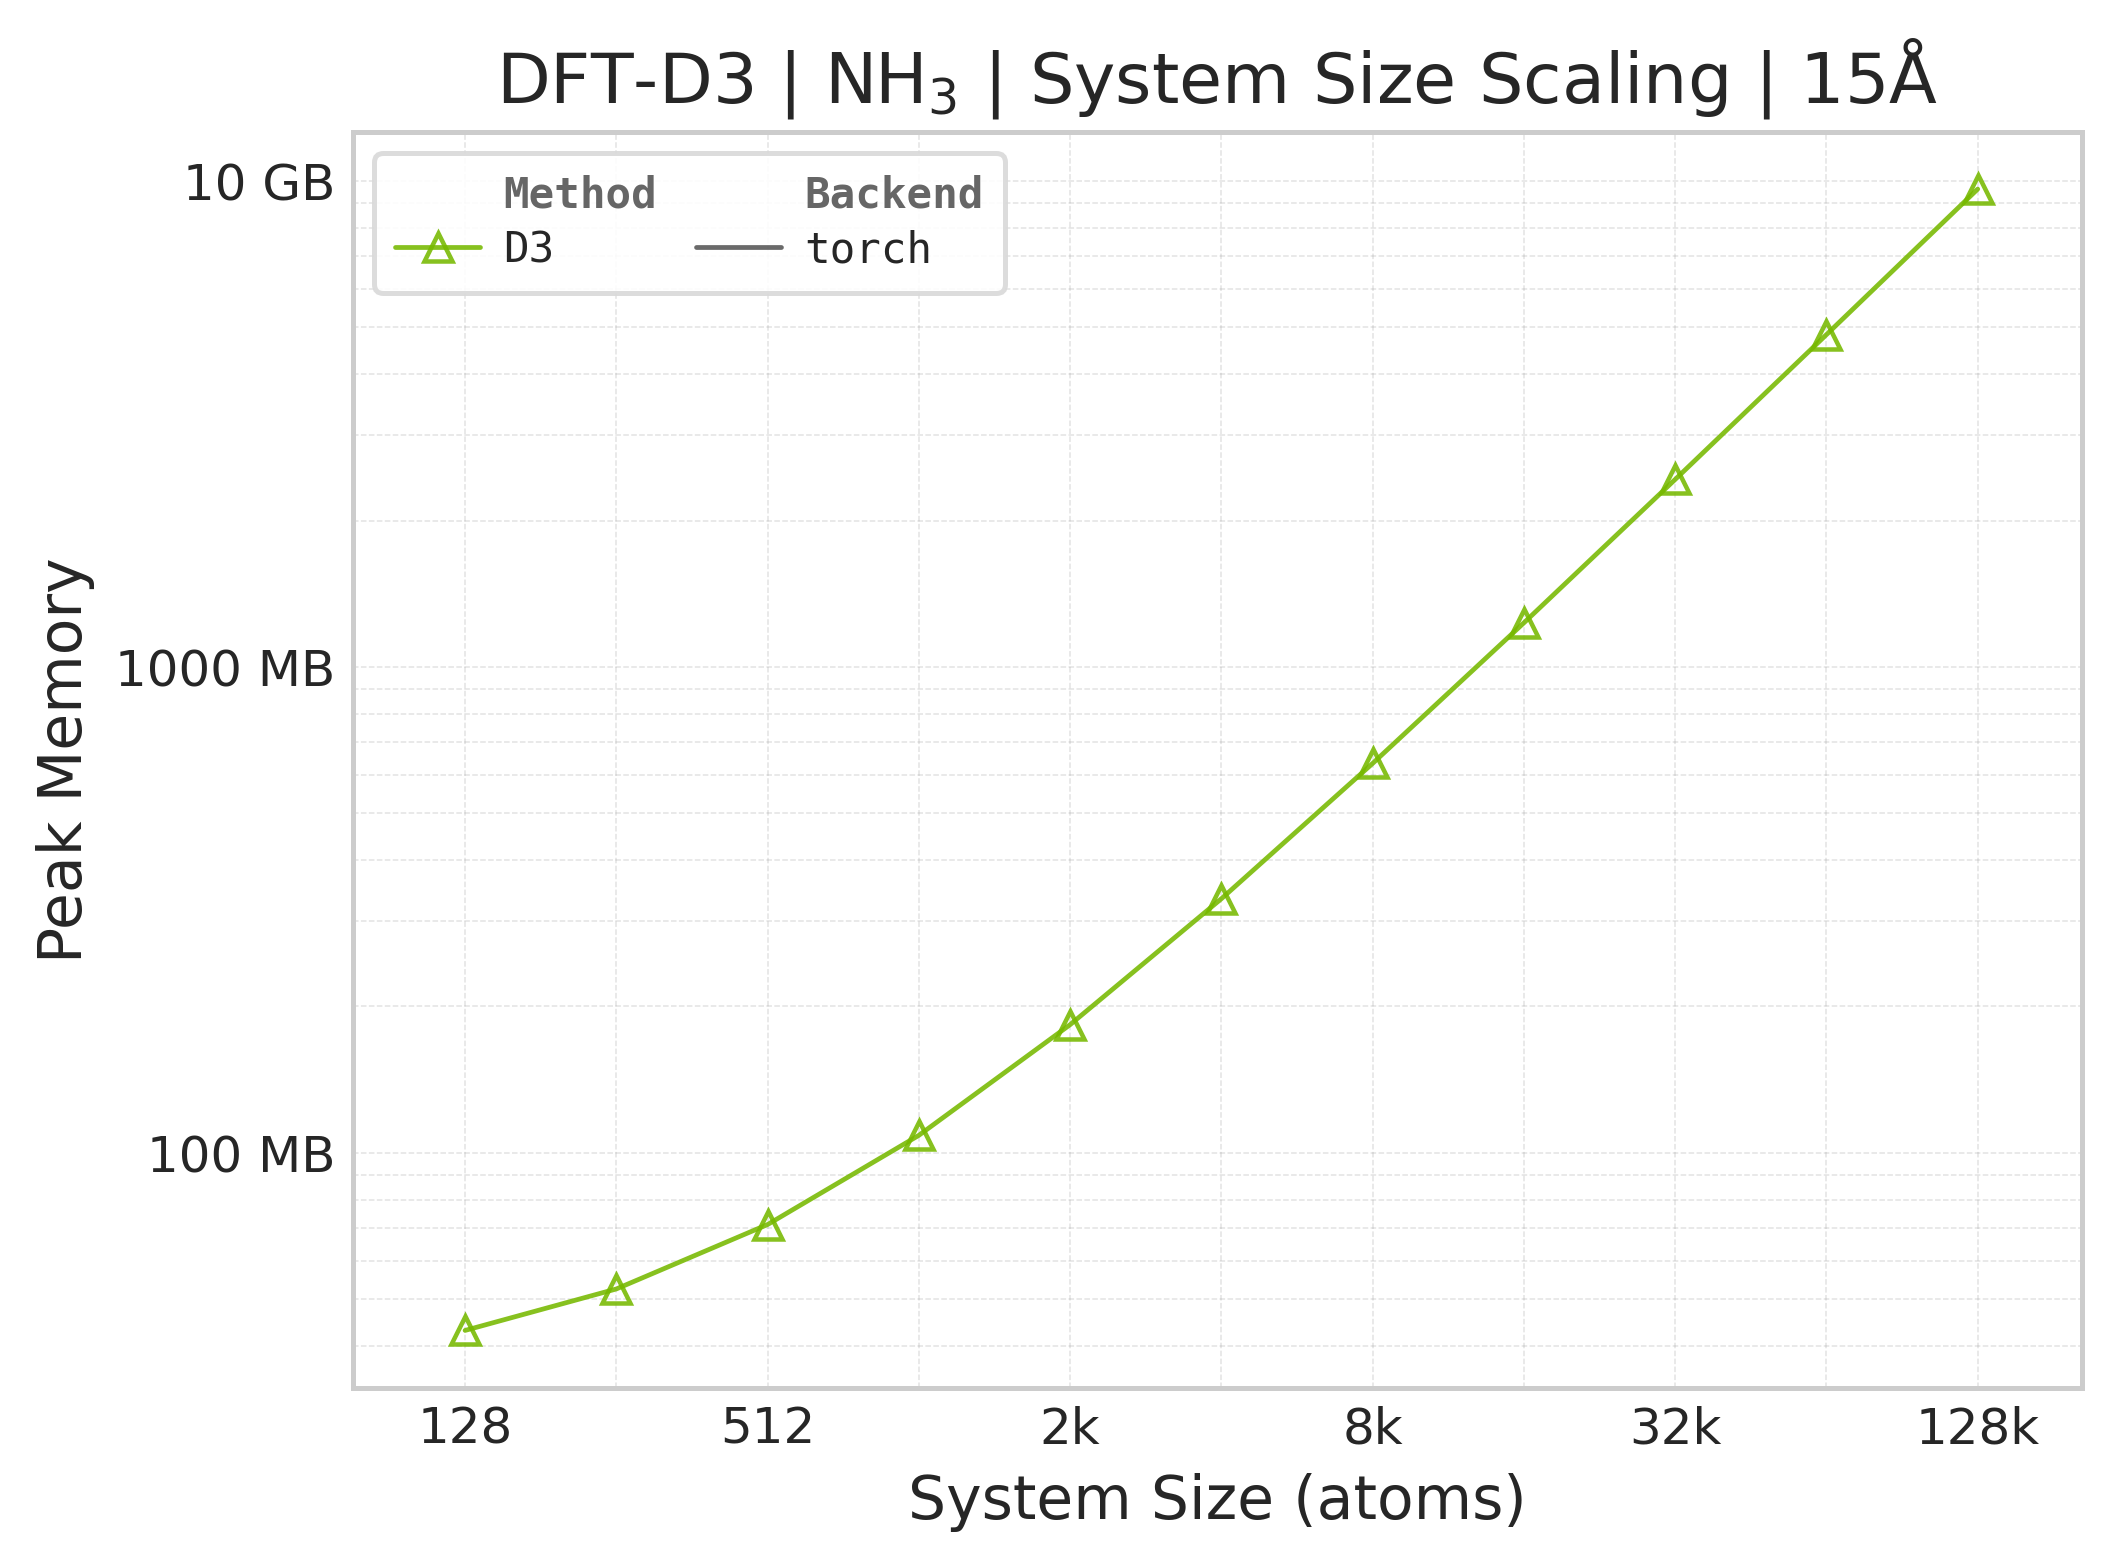
Memory vs. system size (NH₃; Torch only — JAX memory not measured).#
Benchmark Configuration#
Parameter |
Value |
|---|---|
Cutoffs |
15.0, 25.0 Å |
System Type |
CsCl supercells (programmatic), NH₃ (PDB) |
Method |
|
Timed outputs |
Energy, analytical forces, and coordination numbers |
Neighbor List |
Built outside the timed D3 region; CSV rows record |
Warmup Iterations |
3 |
Timing Iterations |
10 |
Precision |
|
CSV rows include time_d3_us_per_atom for the D3-only timed region; neighbor
list setup is tracked separately through neighbor_setup_method.
DFT-D3 Parameters (BJ-damping, PBE)#
The suite overrides these functional-specific values from
benchmarks/interactions/dispersion/benchmark_config.yaml:
Parameter |
Value |
|---|---|
|
0.4289 |
|
4.4407 |
|
0.7875 |
The remaining D3 controls use the public wrapper defaults: s6=1.0,
k1=16.0, and k3=-4.0. They are not benchmark-YAML controls in this
reportable suite.
Running Your Own Benchmarks#
Run from the repository root.
Torch Backend (default)#
RESULT_DIR="$BENCHMARK_SCRATCH/results/manual-d3-run"
python -m benchmarks.interactions.dispersion.benchmark_dftd3 \
    --config benchmarks/interactions/dispersion/benchmark_config.yaml \
    --backend torch \
    --output-dir "$RESULT_DIR"
JAX Backend#
RESULT_DIR="$BENCHMARK_SCRATCH/results/manual-d3-run"
python -m benchmarks.interactions.dispersion.benchmark_dftd3 \
    --config benchmarks/interactions/dispersion/benchmark_config.yaml \
    --backend jax \
    --output-dir "$RESULT_DIR"