Overview
NCX Infra Controller (NICo) is an API-based microservice that provides site-local, zero-trust bare-metal lifecycle management with DPU-enforced isolation, allowing for deployment of multi-tenant AI infrastructure at scale. NICo enables zero-touch automation and ensures the integrity and separation of workloads at the bare-metal layer.
NICo Operational Principles
NICo has been designed according to the following principles:
- The machine is untrustworthy.
- Operating system requirements are not imposed on the machine.
- After being racked, machines must become ready for use with no human intervention.
- All monitoring of the machine must be done using out-of-band methods.
- The network fabric (i.e. Leaf Switches and routers) stays static even during tenancy changes within NICo.
NICo Responsibilities
NICo is responsible for the following tasks in the data-center environment:
- Maintain hardware inventory of ingested machines.
- Integrate with RedFish APIs to manage usernames and passwords
- Perform hardware testing and burn-in.
- Validate and update firmware.
- Allocate IP addresses (IPv4).
- Control power (power on/off/reset).
- Provide DNS services for managed machines.
- Orchestrate provisioning, wiping, and releasing nodes.
- Ensure trust of the machine when switching tenants.
Responsibilities not Covered
NICo is not responsible for the following tasks:
- Configuration of services and software running on managed machines.
- Cluster assembly (that is, it does not build SLURM or Kubernetes clusters)
- Underlay network management
NICo Components and Services
NICo is a service with multiple components that drive actions based on API calls, which can originate from users or as events triggered by machines (e.g. a DHCP boot or PXE request).
Each service communicates with the NICo API server over gRPC using protocol buffers. The API uses gRPC reflection to provide a machine readable API description so clients can auto-generate code and RPC functions in the client.
The NICo deployment includes a number of services:
- NICo API service: Allows users to query the state of all objects and to request creation, configuration, and deletion of entities.
- DHCP: Provides IPs to all devices on underlay networks, including Host BMCs, DPU BMCs, and DPU OOB addresses. It also provides IPs to Hosts on the overlay network.
- PXE: Delivers images to managed hosts at boot time. Currently, managed hosts are configured to always boot from PXE. If a local bootable device is found, the host will boot it. Hosts can also be configured to always boot from a particular image for stateless configurations.
- Hardware health: Pulls
hardware health and configuration information emitted from a Prometheus
/metricsendpoint on port 9009 and reports that state information back to NICo. - SSH console: Provides a virtual serial
console logging and access over
ssh, allowing console access to remote machines deployed on site. Thessh-consolealso logs the serial console output of each host into the logging system, where it can be queried using tools such as Grafana andlogcli. - DNS: Provides domain name service (DNS) functionality
using two services:
carbide-dns: Handles DNS queries from the site controller and managed nodes.unbound: Provides recursive DNS services to managed machines and instances.
Component and Service Dependencies
In addition to the NICo service components, there are other supporting services that must be set up within the K8s site controller nodes.
Site Management
- The entry point for the managed site is through the Elektra site agent. The site agent maintains a northbound Temporal connection to the cloud control plane for command and control.
- The admin CLI provides a command line interface into NICo.
Kubernetes
Some site controller node services require persistent, durable storage to maintain state for their attendant pods:
- Hashicorp Vault: Used by Kubernetes for certificate signing requests (CSRs), this vault
uses three each (one per K8s control node) of the
data-vaultandaudit-vault10GB PVs to protect and distribute the data in the absence of a shared storage solution. - Postgres: This database is used to store state for any NICo or site controller
components that require it, including the main "forgedb". There are three 10GB
pgdataPVs deployed to protect and distribute the data in the absence of a shared storage solution. Theforgedbdatabase is stored here. - Certificate Management Infrastructure: This is a set of components that manage the certificates for the site controller and managed hosts.
Managed Hosts
The point of having a site controller is to administer a site that has been populated with managed hosts.
Each managed host is a pairing of a single Bluefield (BF) 2/3 DPU and a host server.
During initial deployment, the scout service runs, informing the NICo API of any discovered DPUs. NICo completes the installation of services on the DPU and boots into regular operation mode. Thereafter, the dpu-agent starts as a daemon.
Each DPU runs the dpu-agent which connects via gRPC to the API service in NICo to get configuration
instructions.
Metrics and Logs
NICo collects metrics and logs from the managed hosts and the site controller. This information is in Prometheus format and can be scraped by a Prometheus server.
Hardware Compatibility List
This Hardware Compatibility List (HCL) is provided for reference purposes only. Systems listed here have been unit tested or exercised internally in limited scenarios. Inclusion in this list does not imply qualification, certification, or support, and does not represent a commitment to ongoing compatibility. For specific hardware support inquiries or technical specifications, please contact the original hardware vendor.
Hosts
Last Updated: 2/20/2026
| Host Machine | BMC/Management Firmware Version | BIOS/UEFI Version | Misc. Firmware Version (FPGA, CPLD, LXPM, etc.) |
|---|---|---|---|
| GB200 NVL - Wiwynn | 25.06-2_NV_WW_02 | 1.3.2GA | 1.3.2GA |
| NVSwitch Tray - Wiwynn | 1.3.2GA | 1.3.2GA | 1.3.2GA |
| GB200 Compute Tray (1RU) | 1.3.2GA | 1.3.2GA | 1.3.2GA |
| NVSwitch Tray DGX | 1.3.2GA | 1.3.2GA | 1.3.2GA |
| DGX H100 | 25.06.27 (DGXH100_H200_25.06.4 pkg) | 1.06.07 (DGXH100_H200_25.06.4 pkg) | |
| Lenovo ThinkSystem SR670 V2 | 6.10 | 3.30 | 3.31.01 |
| Lenovo ThinkSystem SR675 V3 | 14.10 | 8.30 | 4.20.03 |
| Lenovo ThinkSystem SR675 V3 OVX* | 14.10 | 8.30 | 4.20.03 |
| Lenovo ThinkSystem SR650 | 10.40 | 4.30 | 2.13 |
| Lenovo ThinkSystem SR650 V3 | 6.92 | 3.70 | 4.21.01 |
| Lenovo ThinkSystem SR650 V2 | 5.70 | 3.60 | 3.31.01 |
| Lenovo ThinkSystem SR650 V2 OVX* | 5.70 | 3.60 | 3.31.01 |
| Lenovo ThinkSystem SR655 V3 | 5.80 | 5.70 | 4.20.03 |
| Lenovo ThinkSystem SR655 V3 OVX* | 5.80 | 5.70 | 4.20.03 |
| Lenovo ThinkSystem SR665 V3 OVX* | 5.80 | 5.70 | 4.20.03 |
| Lenovo SR650 V4 | 1.90 | 1.30 | 5.03.00 |
| Lenovo HS350X V3 | 1.20 | 2.17.0 | |
| Dell PowerEdge XE9680 | iDRAC 7.20.60.50 | 2.7.4 | 1.6.0 |
| Dell PowerEdge R750 | iDRAC 7.20.60.50 | 1.18.1 | 1.1.1 |
| SYS-221H-TNR | 1.03.18 | 2.7 | SAA Ver = 1.3.0-p7 |
| Dell PowerEdge R760 | iDRAC 7.20.60.50 | 2.7.5 | 1.2.6 |
| ARS-121L-DNR | 01.08.02 / 01.03.16 (LCC) | 2.2a / 2.0 (LCC) | SAA Ver = 1.2.0-p6 / SUM = 2.14.0-p6 (LCC) |
| SYS-221H-TN24R | X1.05.10 | 2.7 | SAA Ver = 1.3.0-p5 |
| ARS-221GL-NR | 1.03.16 | 2.0 | |
| HPE ProLiant DL385 Gen10 Plus v2 | 3.15 | 3.80_09-05-2025 | |
| DL380 Gen12 | 1.20.00 | 1.62_02-06-2026 | |
| SSG-121E-NES24R | 01.04.19 | 2.7 | SAA Ver = 1.3.0-p1 |
| SYS-121H-TNR | X1.05.10 | 2.7 | SAA Ver = 1.3.0-p5 |
| SYS-821GE-TNHR | 1.03.18 | 2.7 | SAA Ver = 1.3.0-p7 |
| Dell R760xd2 | iDRAC 7.20.80.50 | 2.9.4 | 1.1.2 |
| Dell R670 | iDRAC 1.20.80.51 | 1.7.5 | |
| Dell R770 | iDRAC 1.20.80.51 | 1.7.5 | |
| SYS-421GE-TNRT | 1.03.19 | 2.6 | SAA Ver = 1.2.0-p8 |
| Dell PowerEdge R640 | iDRAC 7.00.00.182 | 2.24.0 | 1.0.6 |
* OVX may not show up as an option; check the Server Serial Number to confirm.
Hosts -- Under Development
This list outlines platforms that are under development and have not undergone full unit testing.
| Host Machine | BMC/Management Firmware Version | BIOS/UEFI Version | Provisioning Manager Version |
|---|---|---|---|
| Lenovo GB300 Compute Tray | 3.0.0 | 1.0.0GA | 1.0.0GA |
DPUs
| DPU | Firmware / Software Version |
|---|---|
| Bluefield-2 | DOCA 3.2.0 |
| Bluefield-3 | DOCA 3.2.0 |
Release Notes
This document contains release notes for the NCX Infra Controller (NICo) project.
Bare Metal Manager 0.2.0
This release of Bare Metal Manager is open-source software (OSS).
Improvements
- The REST API now supports external identity providers (IdPs) for JWT authentication.
- The new
/carbide/instance/batchREST API endpoint allows for batch instances creation. - Instances can now be rebooted by passing an
instance_idargument, in addition to the existingmachine_idargument. - The State Controller is now split into two independent components: The
PeriodicEnqueuer, which periodically enqueues state handling tasks using theEnqueuer::enqueue_objectAPI for each resource/object managed by NICo, and theStateProcessor, which continuously de-queues the state handling tasks for each object type and executes the state handler on them. - The state handler for objects is now scheduled again whenever the outcome of the state handler is
Transition. This reduces the wait time for many state transitions by up to 30 seconds. - The state handler is now re-scheduled for immediate execution if the DPU reports a different version from the previous check. This should reduce the time for wait states like
WaitingForNetworkConfig. - During the pre-ingestion phase, NICo will now set the time zone to UTC if it detects that time is out of sync. This allows the system to correctly interpret NTP timestamps from the time server.
- The Scout agent can now perform secure erase of NVMe devices asynchronously.
- NVLink interfaces are now marked as Pending when an update request is being sent.
- The update logic for NVLink Logical Partition inventory metadata has been improved.
- The
DpuExtensionServicenow supportsnameas an argument for theorderByparameter. - NICo now supports bulk creation/update of
ExpectedMachineobjects. - The Go version has been updated to v1.25.4.
- The
nv-redfishpackage has been updated to v0.1.3.
Bug Fixes
- The above
nv-redfishpackage update fixes a critical bug with the BMC cache, which caused multiple cache miss errors, preventing the health monitor from re-discovery of monitored entities.
Bare Metal Manager EA
What This Release Enables
- Microservice: Our goal is to make NICo deployable and independent of NGC dependencies, enabling a "Disconnected NICo" deployment model.
- GB200 Support: This release enables GB200 Node Ingestion and NVLink Partitioning, with the ability to provision both single and dual DPUs, ingest the GB200 compute trays, and validate the SKU. After ingestion, partners can create NVLink partitions, select instances, and configure the NVLink settings using the Admin CLI.
- Deployment Flexibility: The release includes both the source code and instructions to compile containers for NICo. Our goal is to make the NICo deployable and independent of NGC dependencies, enabling a "Disconnected NICo" deployment model.
What You Can Test
The following key functionalities should be available for testing via the Admin CLI:
- GB200 Node Ingestion: Partners should be able to:
- Install NICo.
- Provision the DPUs (Dual DPUs are also supported).
- Ingest the expected machines (GB200 compute trays).
- Validate the SKU.
- Assign instance types (Note that this currently requires encoding the rack location for GB200).
- NVLink Partitioning: Once the initial ingestion is complete, partners can do the following:
- Create allocations and instances.
- Create a partition.
- Select an instance.
- Set the NVLink configuration.
- Disconnected NICo: This release allows for operation without any dependency on NGC.
Dependencies
| Category | Required Components | Description |
|---|---|---|
| Software | Vault, postgres, k8s cluster, Certificate Management, Temporal | Partners are required to bring in NICo dependencies |
| Hardware | Supported server and switch functionality(e.g. x86 nodes, specific NIC firmware, compatible BMCs, Switches that support BGP, EVPN, and RFC 5549 (unnumbered IPs)) | The code assumes predictable hardware attributes; unsupported SKUs may require custom configuration. |
| Network Topology | L2/L3 connectivity, DHCP/PXE servers, out-of-band management networks, specific switch side port configurations | All modules (e.g. discovery, provisioning) require pre-configured subnets and routing policies, as well as delegation of IP prefixes, ASN numbers, and EVPN VNI numbers. |
| External Systems | DNS resolvers/recursers, NTP, Authentication (Azure OIDC, Keycloak), Observability Stack | NICo provides clients with DNS resolver and NTP server information in the DHCP response. External authentication source that supports OIDC. NICo sends open-telemetry metrics and logs into an existing visualization/storage system |
Supported Switches:
- Optics Compatibility w/B3220 BF-3
- RFC5549 BGP Unnumbered routed ports
- IPv4/IPv6 Unicast BGP address family
- EVPN BGP address family
- LLDP
- BGP External AS
- DHCP Relay that supports Option 82
FAQs
This document contains frequently asked questions about NCX Infra Controller (NICo).
Does NICo install Cumulus Linux onto ethernet switches?
No, NICo does not install Cumulus Linux onto Ethernet switches.
Does NICo install UFM?
No, NICo does not install UFM, it is a dependency. NICo leverages existing UFM deployments for InfiniBand partition management via the UFM API using pkey.
Does NICo manage Infiniband switches in standalone mode (i.e. without UFM)?
No, NICo does not manage Infiniband switches in standalone mode. It requires UFM for InfiniBand partitioning and fabric management. NICo calls UFM APIs to assign partition keys (P_Keys) for isolation.
Does NICo maintain the database of the tenancy mappings of servers and ports?
NICo stores the owner of each instance in the form of a tenant_organization_id that is passed during instance creation.

Does NICo speak to NetQ to learn about the network?
No, the NICo does not speak to NetQ.
Does NICo install DPU OS?
Yes, NICo installs the DPU OS, including all DPU firmware (BMC, NIC, UEFI). NICo also deploys HBN, a containerized service that packages the same core networking components (FRR, NVUE) that power Cumulus Linux.
Does NICo bring up NVLink?
No, NICo does not bring up NVLink. However, NICo manages NVLink partitions through NMX-M APIs. Plans to manage NVLink switches are being evaluated.
Does NICo support NVLink partitioning?
Yes, NICo supports NVLink partitioning.
How does NICo maintain tenancy enforcement between Ethernet (N/S), Infiniband (E/W), NVLink (GPU-to-GPU) networks?
- Ethernet: VXLAN with EVPN for VPC creation on DPU
- E/W Ethernet (Spectrum-X): CX-based FW called DPA to do VXLan on CX (as part of future release)
- Infiniband: UFM-based partition key (P_Key) assignment
- NVLInk: NMX-M based partition management
DPUs enforce Ethernet isolation in hardware, UFM enforces IB isolation, and NMX-M enforces NVLink isolation--all coordinated by NICo.
When NICo is used to maintain tenancy enforcement for Ethernet (N/S), does it require access to make changes to SN switches running Cumulus or are all changes limited to HBN on the DPU?
Ethernet tenancy enforcement is limited to HBN (Host-Based Networking) on the DPU and does not require NICo to make changes to Spectrum (SN) switches running Cumulus Linux. NICo expects the switch configuration to provide BGP speakers on the Switches that speak IPv4 Unicast and L2/L3 EVPN address families, and “BGP Unnumbered” (RFC 5549)
When NICo is used to maintain tenancy enforcement for Ethernet and hosts are presented to customers as bare metal, is OOB isolation of GPU/CPU host BMC managed as well or only the N/S overlay running on DPU?
NICo configures the host BMC to disable connectivity from within the host to the BMC (e.g. Dell iDrac Lockdown, disabling KCS, etc), and also prevents access from the host (via network) to the BMC of the host. Effectively, the user cannot access the BMC of the bare metal hosts. The BMC console (Serial console) is accessed by a user through a NICo service called SSH console that does Authentication and Authorization that the user accessing the console is the current owner of the machine.
Can NICo be used to manage a portion of a cluster?
NICo requires the N/S and OOB Ethernet DHCP relays pointed to the NICo DHCP service as well as access to UFM and NMX-M for E/W. Additionally, the EVPN topology must be visible to all nodes that are managed by the same cluster. If the DC operator wants to separate EVPN/DHCP into VLANs and VRFs, then you can arbitrarily assign nodes to NICo management or not. NMX-M and UFM are not multi–tenant aware, so there's a possibility of two things configuring NMX-M and UFM from interfering with each other.
Can NICo be utilized for HGX platforms for host life cycle management?
Yes, in addition to DGX as well as OEM/ODM CPU-only, Storage, etc nodes.
Does NICo support installing an OS onto the servers? What OS’s are supported to install on NICo?
Yes, NICo supports OS installation onto servers through PXE & Image-based. Any OS can be installed via iPXE (http://ipxe.org) that iPXE supports. OS management (patching, configuration, image generation) is the user’s responsibility.
What is the way to communicate with NICo? Does it expose an API? Does it have a shell interface?
NICo exposes an API interface & authentication through JWT tokens or IdP integration (keycloak). There is also an admin-facing CLI & debugging/Engineering UI.
Where is NICo run? Is it a container/microservice? Is it a single container or a collection deployed via Helm?
NICo commonly runs on a Kubernetes cluster (3 or 5 control plane nodes recommended), though there is no requirement to do so. NICo runs as a set of microservices for API, DNS, DHCP, Hardware Monitoring, BMC Console, Rack Management, etc. There is currently no helm chart for NICo deployment; it can be deployed with Kubernetes Kustomize manifests.
Should I use NICo as my OS installation tool?
NICo is more than an OS installation tool. It certainly helps with OS provisioning, but it's not the main use case for NICo. Automated Baremetal lifecycle management, network isolation & rack management are its key use cases. This includes hardware burn-in testing, hardware completeness validation, Measured Boot for Firmware integrity and ongoing automated firmware updates, and out-of-band continuous hardware management.
Do I need to change the OOB management TOR to configure a separate VLN for the NICo managed hosts and DPU (DPU OOB, Host OOB), with DHCP relay point to NICo DHCP?
Yes, that's usually how it's done. Each VLAN (sometimes the whole switch is a VLAN) - or SVI port - needs to have it's DHCP relay for the machines and DPUs you wish to manage with NICo pointing to NICo's DHCP server address you setup.
Do I need to change existing infrastructure if separate VLANs are used?
No, there is no need to change existing infrastructure if separate VLANs are used.
With only one RJ45 on BF3, the DPU inband IP addresses allocation is part of DPU loopback allocated by NICo. Does it assume that the same management switch also supports DPU SSH access and that the DPU ssh IP is allocated by NICo and only accessible inside the data center?
The IP addresses issued to the DPU RJ45 port are from the "network segments" (which is different than a DPU loopback) - the API in NICo is to create a Network Segment of type underlay on whatever the underlying network configuration is. NICo issues two IPs to the RJ45 - (1) is the DPU OOB that's used to SSH to the ARM OS and NICo's management traffic, and (2) the DPU's BMC that is used for Redfish and DPU configuration. There's also the host's BMC that needs to be also on a VLAN forwarding to the NICo DHCP relay.
The host overlay interfaces addresses on top of vxlan and DPU is allocated via NICo through the control NIC on NICo, through overlay networking. So I assume no DHCP relay configuration needed on any switches. While is this overlay need to be manually configured on NICo control hosts' NIC?
The DHCP relay is required only on the switches connected to the DPU OOBs/BMCs and Host BMCs. The in-band ToRs just need to be configured for bgp unnumbered as "routed port". The "overlay" networks that NICo will assign IPs from to the host are defined as "network segements" with the "overlay" type, then the overlay network is referenced when creating an instance.
Do I need to seperate the PXE of NICo like this as well to isolate the PXE installation process from site PXE server?
There is a separate PXE server that NICo needs to serve it's own images we ship as part of the software (i.e. DPU software, iPXE, etc). But if the DHCP is configured correctly and there's connectivity from the Host to the NICo PXE service, then it will be fine to live side-by-side.
How does NICo select which bare metal to pick to satisfy the request for an instance? What selection criteria is supported?
For the gRPC API, it doesn't, you pick the machine when calling "AllocateInstance" gRPC. For the REST API, it has a concept of resource allocations, so a tenant would get an allocation of some number of a type of machine and then when creating an instance against that instance type it'd randomly pick one. There's an API we're working on to do bulk allocations which will all get allocated on the same nvlink domain and another project to allocate by labels on the machine so you could choose machines in the same rack, etc.
How is NICo made aware of power management endpoints (BMC IP and credentials) for bare metal?
When you provision a NICo "site" you tell it which BMC subnets are provisioned on the network fabric, and then those subnets should be doing DHCP relaying to the NICo DHCP service. When a BMC requests an IP, NICo allocates one and then looks up in an "expected machine" table for the initial username and password for that BMC (it looks it up by mac address, which NICo cross-references with the DHCP lease). So you dont have to "pre-define" BMCs, but you do need to provide the initial mac address, username and password.
Are there APIs to query and debug DPU state?
DPUs will report health status (like if HBN is configured correctly, BGP peering, if the HBN container is running, that kind of thing) and heartbeat information, which version of the configuration has been applied; and also health checks for BMC-side health from the DPU's BMC for things like thermals and stuff.
This information is also visible in the admin web UI. Furthermore, you can SSH to the DPU and poke around if the issue isn't obvious using these methods.
Architecture
This page discusses the high level architecture of a site running NCX Infra Controller (NICo).
NICo orchestrates the lifecycle of "Managed Hosts" and other resources via set of cooperating control plane services. These control plane services have to be deployed to a Kubernetes cluster with a size of at least 3 nodes (for high availability).

The Kubernetes cluster needs to have variety of services deployed:
- The Carbide control plane services. These services are specific to Carbide, and must be deployed together in order to allow Carbide to manage the lifecyle of hosts.
- Dependency services. Carbide requires "off-the-shelf" dependencies like Postgres, Vault and telemetry services deployed and accessible.
- Optional services. A variety of services in tools within the deployment that interfact with the Carbide deployment, but are not required continuously for the control plane to operate.
The following chapters look at each of these in more detail.
Managed Hosts
A "Managed Host" is a host whose lifecycle is managed by Carbide.
The managed host consists of various internal components that are all part of the same chassis or tray:
- The actual x86 or ARM host, with an arbitrary amount of GPUs
- One or more DPUs (of type Bluefield 2 or Bluefield 3) plugged into the host
- The BMC that is used to manage the host
- The BMC that is used to manage the DPU
Carbide deploys a set of binaries on these hosts during various points of their lifecycle:
Scout
scout is an agent that Carbide runs on the host and DPU of managed hosts for a variety of tasks:
- "Inventory" collection: Scout collects and transmits hardware properties of the host to carbide-core which can not be determined through out-of-band tooling.
- Execution of cleanup tasks whenever the bare metal instance using the host is released by a user
- Execution of machine validation tests
- Periodic Health checks
DPU Agent
dpu-agent is an agent that Carbide runs exclusively on DPUS managed by Carbide as a daemon.
DPU agent performs the following tasks:
- Configuring the DPU as required at any state during the hosts lifecycle. This process is described more in depth in DPU configuration.
- Executing periodic health-checks on the DPU
- Running the Forge metadata service (FMDS), which provides the users on the bare metal instance a HTTP based API to retrieve information about their running instance. Users can e.g. use FMDS to determine their Machine ID or certain Boot/OS information.
- Enabling auto-updates of the dpu-agent itself
- Deploying hotfixes for the DPU OS. These hotfixes reduce the need to perform a full DPU OS reinstallation, and thereby avoid bare metal instances becoming unavailable for their users due to OS updates.
DHCP Server
Carbide runs a custom DHCP server on the DPU, which handles all DHCP requests of the actual host. This means DHCP requests on the hosts primary networking interfaces will never leave the DPU and show up on the underlay network - which provides enhanced security and reliability. The DHCP server is configured by dpu-agent.
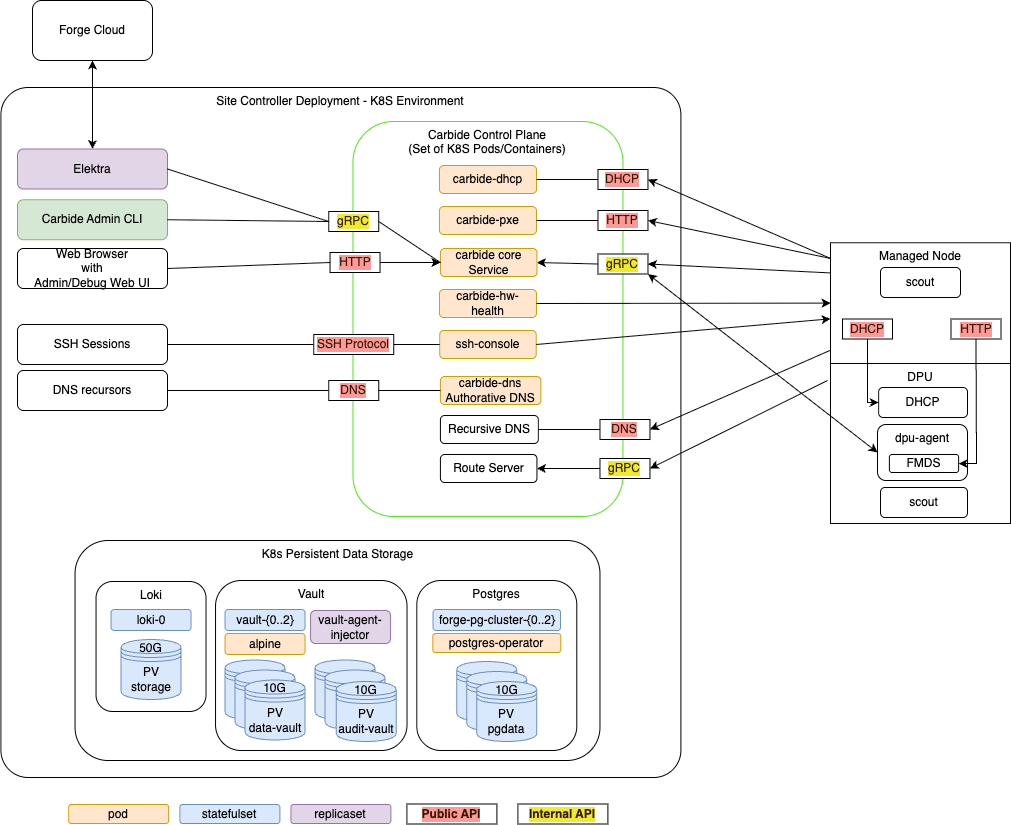
Carbide Control plane services
The carbide control plane consists of a number of services which work together to orchestrate the lifecycle of a managed host:
- carbide-core: The Carbide core service is the entrypoint into the control plane. It provides a gRPC API that all other components as well as users (site providers/tenants/site administrators) interact with, as well as implements the lifecycle management of all Carbide managed resources (VPCs, prefixes, Infiniband and NVLink partitions and bare metal instances). The Carbide Core section describes it further in detail.
- carbide-dhcp (DHCP): The DHCP server responds to DHCP requests for all devices on underlay networks. This includes Host BMCs, DPU BMCs and DPU OOB addresses. carbide-dhcp can be thought of as a stateless proxy: It does not acutally perform any IP address management - it just converts DHCP requests into gRPC format and forwards the gRPC based DHCP requests to carbide core.
- carbide-pxe (iPXE): The PXE server provides boot artifacts like iPXE scripts, iPXE user-data and OS images to managed hosts at boot time over HTTP. It determines which OS data to provide for a specific host by requesting the respective data from carbide core - therefore the PXE server is also stateless. Currently, managed hosts are configured to always boot from PXE. If a local bootable device is found, the host will boot it. Hosts can also be configured to always boot from a particular image for stateless configurations.
- carbide-hw-health (Hardware health): This service scrapes all host and DPU BMCs known by Carbide for system health information. It extracts measurements like fan speeds, temperaturs and leak indicators. These measurements are emitted as prometheus metrics on a
/metricsendpoint on port 9009. In addition to that, the service calls the carbide-core APIRecordHardwareHealthReportto set health alerts based on issues identified within the metrics. These alerts are merged within carbide-core into the aggregated-host-health - which is emitted in overall health metrics and used to decide whether hosts are usable as bare metal instances for tenants. - ssh-console: The SSH console provides bare metal-tenants and site-administrators virtual serial console access to hosts managed by Carbide. The ssh-console service also sends the output of each hosts serial console to the logging system (Loki), from where it can be queried using Grafana and logcli. In order to provide this functionality, the ssh-console service continuously connects to all host BMCs. The ssh-console service only forwards logs to users ("bare metal tenants") if they connect to the service and get authenticated.
- carbide-dns (DNS): Domain name service (DNS) functionality
is handled by two services. The
carbide-dnsservice handles DNS queries from the site controller and managed nodes and is authoritative for delegated zones.
Carbide Core
Carbide core is the binary which provides the most essential services within the Carbide control plane. It provides a gRPC API that all other components as well as users (site providers/tenants/site administrators) interact with, as well as implements the lifecycle management of all Carbide managed resources (VPCs, prefixes, Infiniband and NVLink partitions and bare metal instances).
Carbide core can be considered as a "collection of independent components that are deployed within the same binary". These components are shown the following diagram, and are described further below:
Carbide core is the only component within carbide which interacts with the postgres database. This simplifies the rollout of database migrations throughout the product lifecycle.
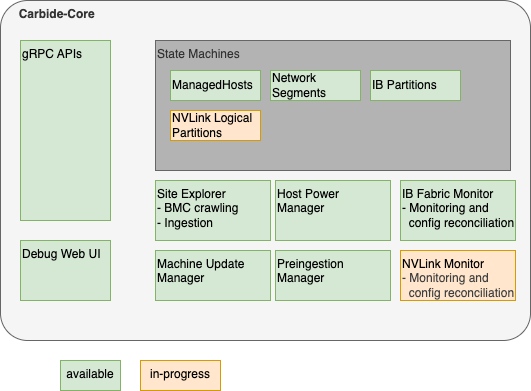
Carbide Core Components
gRPC API handlers
The API handlers accept gRPC requests from Carbide users and internal system components. They provide users the ability to inspect the current state of the system, and modify the desired state of various components (e.g. create or reconfigure bare metal instances).
API handlers are all implemented within the trait/interface rpc::forge::forge_server::Forge. Various implementations delegate to the handlers subdirectory. For resources managed by Carbide, API handlers do not directly change the actual state of the resources (e.g. the provisioning state of a host). Instead of it, they only change the required state (e.g. "provisioning required", "termination required", etc). The state changes will be performed by state machines (details below). The carbide-core gRPC API supports
gRPC reflection to provide a machine readable API
description so clients can auto-generate code and RPC functions in the client.
Debug Web UI
Carbide core provides a debug UI under the /admin endpoint. The debug UI allows to inspect the state of all resources managed by Carbide via a variety of HTML pages. It e.g. allows to list details about all managed hosts and DPUs, or about the internal state of other components that are described within the Carbide Core section.
The Debug UI also provides access to various admin level tools. E.g. it
- allows to change the power state of hosts, reset the BMC, and change boot orders
- inspect the redfish tree of any BMC managed by Carbide
- allows admins to perform changes to a BMC (via HTTP POST) in a peer-reviewed and auditable fashion
- inspect UFM responses
State Machines
Carbide implements State Machines for all resources managed by Carbide. The state machines are implemented as idempotent state handling functions calls, which are scheduled by the system. State handling for various resource types is implemented indepently, e.g. the lifecycle of hosts is managed by different tasks and different code than the lifecycle of InfiniBand partitions.
Carbide implements state machines for
- Managed Hosts (Hosts + DPUs)
- Network Segments
- InfiniBand Partitions
- NVLink Logical Partitions
Details about the Carbide state handling implementation can be found here.
Site Explorer
Site Explorer is a process within Carbide Core that continuously monitors the state of all BMCs that are detected within the underlay network. The process acts as a "crawler". It continuously tries to perform redfish requests against all IPs on the underlay network that were provided by Carbide Core and records information that Carbide is required to manage the hosts in a follow-up. The information collected by Carbide is
- Serial Numbers
- Certain inventory data, e.g. the amount, type and serial numbers of DPUs
- Power State
- Configuration data, e.g. boot order, lockdown mode
- Firmware versions
Carbide users can inspect the data that site explorer discovers using the FindExploredEndpoints APIs as well as using the Carbide Debug Web UI.
Site Explorer requires an "Expected Machines" manifest to be deployed. Expected Machines describes the set of Machines that is expected to be managed by the Carbide instance - it encodes BMC MAC addresses, hardware default passwords and other details of these Machines. The manifest can be updated using a set of APIs, e.g. ReplaceAllExpectedMachines.
Beyond the basic BMC data collection, Carbide also performs the following tasks:
- It matches hosts with associated DPUs based on the redfish reports of both components - e.g. both the host an DPU need to reference the same DPU serial number.
- It kickstarts the ingestion process of the host once the host is in an "ingestable" state (all components are found and have up to date firmware versions).
Site Explorer emits metris with the prefix forge_endpoint_ and forge_site_explorer_.
Preingestion Manager
Preingestion Manager is a component which updates the firmware of hosts that are below the minimum required firmware version that is required to be ingestable. Usually firmware updates to hosts are deplyoed within the main machine lifecycle, as managed by the ManagedHost state machine.
In some rare cases - e.g. with very old host or DPU BMCs - the host ingestion process can't be started yet - e.g. because the BMC does not provide the necessary information to map the host to DPUs. In this case the firmware needs to be updated before ingestion, and preingestion manager performs this task.
Machine Update Manager
Machine Update Manager is a scheduler for Host and DPU firmware updates. It selects Machines with outdated software versions for automated updates. Machine update manager looks at various criteria to determine whether a Machine should get updated:
- The current Machine state - e.g. whether its occupied by a tenant. Right now only Machines within the
Readystate are selected for automated software updates - Whether the machine is healthy (no health alerts recorded on the machine)
- How many machines are already updating, and the overall amount of healthy hosts in the machine. Machine Update Manager will never update all Machines at once, and won't schedule additional updates in case the temporary loss of Machines would move the site under the Machine health SLA.
Machine Update Manager does not perform the actual updates - it only performs scheduling/selection. The updates are instead applied within the ManagedHost state machine. This approach is chosen in order to assure that only a single component (managedhost state machine) is managing a hosts lifecycle at any point in time.
Machine Update Manager is an optional component and can be disabled.
Host Power Manager
Host Power Manager is a component which orchestrates power actions against BMCs.
IB (InfiniBand) Fabric Monitor
InfiniBand fabric monitor is a periodic process within Carbide that performs all interactions with the InfiniBand fabric using UFM APIs.
In each run, IBFabricMonitor performs the following task:
- It checks the health of the fabric manager (UFM) by performing API calls
- It checks whether all security configurations for multitenancy are applied on UFM and emits alerts in case of inappropriate settings
- It fetches the actually applied InfiniBand partitioning information for each InfiniBand port on each host managed by Carbide and stores it in Carbide. The data can be inspected in the
Machine::ib_statusfield in the gRPC API. - If calls UFM APIs to bind ports (guids) to partitions (pkeys) according to the configuration of each host. This happens continuosly based on comparing the expected InfiniBand configuration of a host (whether it is used by a tenant or not, and how the tenant configured the InfiniBand interfaces) with the actually applied configuration (determined in the last step).
InfiniBand Fabric Monitor is an optional component. It only needs to be enabled in the case Carbide managed InfiniBand is required.
IB Fabric Monitor emits metrics with prefix forge_ib_monitor_.
NVLink Monitor
In development. The NVLink monitor will have similar responsibilities as IBFabricMonitor, but is used for monitoring and configuring NVLink. It will therefore interact with NMX APIs.
Dependency services
In addition to the Carbide API server components there are other supporting services run within the K8s site controller nodes.
K8s Persistent Storage Objects
Some site controller node services require persistent, durable storage to maintain state for their attendant pods. There are three different K8s statefulsets that run on the controller nodes:
- Loki - The loki/loki-0 pod instatites a single 50GB persistent volume and is used to store logs for the site controller components.
- Hashicorp Vault - Used by Kubernetes for certificate signing requests (CSRs). Vault
uses three each (one per K8s control node) of the
data-vaultandaudit-vault10GB PVs to protect and distribute the data in the absence of a shared storage solution. - Postgres - Used to store state for any Carbide or site controller components that
require it including the main "forgedb". There are three 10GB
pgdataPVs deployed to protect and distribute the data in the absence of a shared storage solution. Theforgedbdatabase is stored here.
Optional services
The point of having a site controller is to administer a site that has been populated with tenant managed hosts. Each managed host is a pairing of a Bluefield (BF) 2/3 DPUs and a host server (only two DPUs have been tested). During initial deployment scout runs and informs carbide-api of any discovered DPUs. Carbide completes the installation of services on the DPU and boots into regular operation mode. Thereafter the forge-dpu-agent starts as a daemon.
Each DPU runs the forge-dpu-agent which connects via gRPC to the API service in Carbide to get configuration instructions.
The forge-dpu-agent also runs the Forge metadata service (FMDS), which provides the users on the bare metal instance a HTTP based API to retrieve information about their running instance. Users can e.g. use FMDS to determine their Machine ID or certain Boot/OS information.
Redfish Workflow
NICo uses DMTF Redfish to discover, provision, and monitor bare-metal hosts and their DPUs through BMC (Baseboard Management Controller) interfaces. This document traces the end-to-end workflow from initial DHCP discovery through ongoing monitoring.
For the overall NICo architecture and component responsibilities, see Overview and components. The Site Explorer component described there is the primary consumer of Redfish APIs.
Workflow Summary
DHCP Request (BMC)
  → NICo DHCP (Kea hook)
    → Carbide Core (gRPC discover_dhcp)
      → Site Explorer probes Redfish endpoint
        → Authenticates, collects inventory
          → Pairs DPUs to hosts via serial number matching
            → Provisioning:
               1. Set DPU boot to HTTP IPv4 UEFI
               2. Power cycle DPU via Redfish
               3. DPU PXE boots carbide.efi
               4. BIOS config (SR-IOV, etc.)
               5. Set host boot order (DPU first)
               6. Power cycle host via Redfish
            → Ongoing monitoring:
               - Firmware inventory (periodic)
               - Sensor collection (60s interval)
               - Prometheus metric export
1. DHCP Discovery
When a BMC on the underlay network sends a DHCP request, the NICo DHCP server (a Kea hook plugin) captures it and forwards the discovery information to Carbide Core.
The Kea hook is implemented as a Rust library with C FFI bindings. When a DHCP packet arrives, the hook:
- Extracts the MAC address, vendor class string, relay address, circuit ID, and remote ID from the DHCP packet
- Builds a
Discoverystruct with these fields - Sends a gRPC
discover_dhcp()request to Carbide Core with the MAC and vendor string - Receives back a
Machineresponse containing the network configuration (IP address, gateway, etc.) to return to the BMC
The vendor class string is parsed to identify the BMC type and capabilities. DHCP entries are tracked in the database by MAC address and associated with machine interfaces.
Key files:
crates/dhcp/src/discovery.rs—Discoverystruct and FFI entry points (discovery_fetch_machine)crates/dhcp/src/machine.rs—Machine::try_fetch()sends gRPC discovery requestcrates/dhcp/src/vendor_class.rs— Vendor class parsing and BMC type identificationcrates/api-model/src/dhcp_entry.rs—DhcpEntrydatabase model
2. Redfish Endpoint Probing and Inventory
Once NICo knows about a BMC IP from DHCP, the Site Explorer component continuously probes and inventories it via Redfish.
Probing
Site Explorer first sends an anonymous (unauthenticated) GET to /redfish/v1 (the Redfish service root) to detect the BMC vendor. The RedfishVendor enum identifies the vendor from the service root response, which determines vendor-specific behavior for subsequent operations.
Authentication
After vendor detection, Site Explorer creates an authenticated Redfish session using one of three methods:
- Anonymous — Used for initial probing only
- Direct — Username/password from the Expected Machines manifest (factory defaults)
- Key — Credential key lookup by BMC MAC address (after credential rotation)
Inventory Collection
With an authenticated session, Site Explorer queries a comprehensive set of Redfish resources and produces an EndpointExplorationReport containing:
| Data Collected | Redfish Source | Purpose |
|---|---|---|
| System serial numbers | GET /redfish/v1/Systems/{id} | Machine identification |
| Chassis serial numbers | GET /redfish/v1/Chassis/{id} | Fallback identification |
| Network adapters + serials | GET /redfish/v1/Chassis/{id}/NetworkAdapters | DPU-host pairing |
| PCIe devices + serials | GET /redfish/v1/Systems/{id} (PCIeDevices) | DPU-host pairing |
| Manager info | GET /redfish/v1/Managers/{id} | BMC firmware version |
| Ethernet interfaces | GET /redfish/v1/Managers/{id}/EthernetInterfaces | BMC network info |
| Firmware versions | GET /redfish/v1/UpdateService/FirmwareInventory | Version tracking |
| Boot configuration | GET /redfish/v1/Systems/{id}/BootOptions | Boot order state |
| Power state | GET /redfish/v1/Systems/{id} (PowerState) | Current state |
Serial numbers are trimmed of whitespace. If system.serial_number is missing, the chassis serial number is used as a fallback.
Key files:
crates/api/src/site_explorer/redfish.rs—RedfishClient:probe_redfish_endpoint(),create_redfish_client(), inventory queriescrates/api/src/site_explorer/bmc_endpoint_explorer.rs—BmcEndpointExplorerorchestrates credential lookup and explorationcrates/api-model/src/bmc_info.rs—BmcInfomodel (IP, port, MAC, firmware version)
3. DPU-Host Pairing
Once Site Explorer has explored both host BMCs and DPU BMCs, it matches them into host-DPU pairs using serial number correlation. This is the core logic that answers: "which DPU belongs to which host?"
Matching Algorithm
The algorithm has three strategies, tried in order:
Step 1 — Build DPU serial number map:
For each explored DPU endpoint, extract system.serial_number and create a map: DPU serial → explored endpoint.
Step 2 — Primary match via PCIe devices:
For each host, iterate through system.pcie_devices. For each device where is_bluefield() returns true (BF2, BF3, or BF3 Super NIC), look up pcie_device.serial_number in the DPU serial map. A match means this DPU is physically installed in this host.
Step 3 — Fallback match via chassis network adapters:
If no BlueField PCIe devices were found (Step 2 count = 0), iterate through chassis.network_adapters instead. For each adapter where is_bluefield_model(part_number) is true, look up network_adapter.serial_number in the DPU serial map.
Step 4 — Final fallback via expected machines manifest:
If the explored matches are incomplete, check expected_machine.fallback_dpu_serial_numbers for manually specified DPU-to-host associations.
Validation
Before accepting a pairing, NICo validates:
- DPU mode: The DPU must be in DPU mode, not NIC mode. BlueFields in NIC mode are excluded from pairing.
- DPU model configuration:
check_and_configure_dpu_mode()verifies the DPU is correctly configured for its model. Hosts with misconfigured DPUs are not ingested. - Completeness: The number of explored DPUs must match the number of BlueField devices the host reports. Incomplete pairings are deferred.
Ingestion
Once all DPUs are matched and validated, the host enters an "ingestable" state and Site Explorer kickstarts the ingestion process via the ManagedHost state machine.
Key file:
crates/api/src/site_explorer/mod.rs—identify_managed_hosts()with the complete pairing algorithm
4. DPU Provisioning
After pairing, the DPU must be provisioned with NICo software. This is orchestrated via Temporal workflows (in carbide-rest) with Redfish power control (in ncx-infra-controller-core).
Boot Configuration
The DPU is configured to boot from HTTP IPv4 UEFI, which directs it to the NICo PXE server. The PXE server serves different artifacts based on architecture:
- ARM (BlueField DPUs):
carbide.efiwith cloud-init user-data containingmachine_idandserver_uri - x86 (Hosts):
scout.efiwith machine discovery parameters (cli_cmd=auto-detect)
Power Cycle
The DPU is power-cycled via Redfish to trigger the network boot:
POST /redfish/v1/Systems/{system_id}/Actions/ComputerSystem.Reset
Body: {"ResetType": "GracefulRestart"}
The power control operation supports multiple reset types: On, ForceOff, GracefulShutdown, GracefulRestart, ForceRestart, ACPowercycle, PowerCycle.
Installation
After PXE boot, the DPU:
- Fetches
carbide.efifrom the NICo PXE server over HTTP - Receives cloud-init configuration with its
machine_idand NICo API endpoint - Installs and starts the DPU agent (
dpu-agent), which connects back to Carbide Core via gRPC
Key files:
crates/api/src/ipxe.rs— iPXE instruction generation per architecturepxe/ipxe/local/embed.ipxe— iPXE boot script templatecarbide-rest/workflow/pkg/workflow/instance/reboot.go—RebootInstanceTemporal workflowcarbide-rest/site-workflow/pkg/grpc/client/instance_powercycle.go— Power cycle gRPC call to site agent
5. Host Configuration and Boot
With the DPU provisioned, NICo configures the host BIOS and boot order via Redfish.
BIOS Attribute Setting
NICo sets BIOS attributes required for bare-metal infrastructure operation. This includes SR-IOV enablement and other platform-specific settings. BIOS operations use the libredfish Redfish trait:
bios()— Read current BIOS attributesset_bios()— Set BIOS attribute valuesmachine_setup()— Apply infrastructure-specific BIOS configurationis_bios_setup()/machine_setup_status()— Check configuration state
These translate to Redfish calls:
GET  /redfish/v1/Systems/{id}/Bios           — Read attributes
PATCH /redfish/v1/Systems/{id}/Bios/Settings — Write attributes (pending next reboot)
Boot Order Configuration
The host boot order is set so the DPU's network interface is the primary boot device:
#![allow(unused)]
fn main() {
set_boot_order_dpu_first(bmc_ip, credentials, boot_interface_mac)
}
This configures the UEFI boot order to prioritize the DPU's PF MAC address, ensuring the host boots through the DPU's network path.
Host Reboot
After BIOS and boot order changes, the host is power-cycled via Redfish to apply the configuration:
POST /redfish/v1/Systems/{system_id}/Actions/ComputerSystem.Reset
Body: {"ResetType": "GracefulRestart"}
Power cycles are rate-limited to avoid excessive reboots (checked via time_since_redfish_powercycle against config.reset_rate_limit).
Key files:
crates/api/src/site_explorer/redfish.rs—set_boot_order_dpu_first(),redfish_powercycle()crates/api/src/site_explorer/bmc_endpoint_explorer.rs— Orchestrates boot order with credential lookup
6. Ongoing Monitoring
Once hosts are provisioned, the carbide-hw-health service continuously monitors both host BMCs and DPU BMCs via Redfish. The endpoint discovery calls find_machine_ids with include_dpus: true, so every BMC known to NICo (host and DPU) gets its own set of collectors:
- Health monitor — sensor collection and health alert reporting
- Firmware collector — firmware inventory polling
- Logs collector — BMC event log collection
Each collector runs independently per BMC endpoint, meaning a host with two DPUs will have three sets of collectors (one for the host BMC, one for each DPU BMC).
Firmware Inventory
The FirmwareCollector periodically queries each BMC's firmware inventory using nv-redfish:
#![allow(unused)]
fn main() {
let service_root = ServiceRoot::new(bmc.clone()).await?;
let update_service = service_root.update_service().await?;
let firmware_inventories = update_service.firmware_inventories().await?;
}
This translates to:
GET /redfish/v1
GET /redfish/v1/UpdateService
GET /redfish/v1/UpdateService/FirmwareInventory
GET /redfish/v1/UpdateService/FirmwareInventory/{id}  (for each item)
Each firmware item's name and version is exported as a Prometheus gauge metric with labels:
serial_number— Machine chassis serialmachine_id— NICo machine UUIDbmc_mac— BMC MAC addressfirmware_name— Component name (e.g., "BMC_Firmware", "DPU_NIC")version— Firmware version string
Sensor Collection
Sensors (temperature, fan speed, power consumption, current draw) are collected at configurable intervals:
| Config Parameter | Default | Description |
|---|---|---|
sensor_fetch_interval | 60 seconds | How often sensors are polled |
sensor_fetch_concurrency | 10 | Maximum concurrent BMC sensor queries |
include_sensor_thresholds | true | Whether to include threshold values |
Sensor data is read from:
GET /redfish/v1/Chassis/{id}/Sensors
GET /redfish/v1/Chassis/{id}/Sensors/{sensor_id}
Sensor types include: Temperature (Cel), Rotational/Fan (RPM), Power (W), and Current (A).
All sensor data is exported as Prometheus metrics on the /metrics endpoint (port 9009) and fed into Carbide Core via RecordHardwareHealthReport for health aggregation.
Key files:
crates/health/src/firmware_collector.rs—FirmwareCollectorusing nv-redfishcrates/health/src/discovery.rs— Creates and manages collectors per endpointcrates/health/src/config.rs— Polling intervals and concurrency configuration
Redfish Libraries
NICo uses two Redfish client libraries concurrently. nv-redfish is replacing libredfish over time.
| Library | Version | Language | Used For | Location in Code |
|---|---|---|---|---|
| libredfish | 0.39.3 | Rust | Site Explorer: discovery, boot config, power control, BIOS, account management | crates/api/src/site_explorer/ |
| nv-redfish | 0.1.4 | Rust | Health monitoring: firmware inventory collection | crates/health/src/ |
libredfish provides a Redfish trait with vendor-specific implementations (Dell, HPE, Lenovo, Supermicro, NVIDIA DPU/GB200/GH200/Viking). It handles the full breadth of BMC operations.
nv-redfish uses a code-generation approach: CSDL (Redfish schema XML) is compiled into strongly-typed Rust at build time. It is feature-gated so only needed Redfish services are compiled in. Currently enabled features in NICo: std-redfish, update-service, resource-status.
Both libraries are declared in the workspace Cargo.toml.
Redfish Endpoints Reference
For the complete list of Redfish endpoints and their required response fields, see Redfish Endpoints Reference.
Redfish Endpoints Reference
This page documents all Redfish endpoints used by NCX Infra Controller (NICo), organized by resource group. Each section includes endpoint tables, required response fields with their importance to NICo, and vendor-specific notes.
Field importance levels:
- Critical — NICo cannot function correctly without this field. Pairing, identification, or core workflows fail.
- Required — Expected by NICo and used in normal operation. Missing values cause degraded behavior.
- Recommended — Used when available, with graceful fallback if absent.
- Optional — Informational or used only in specific configurations.
For the manually-maintained tracker with full vendor coverage and response payload examples, see the DSX OEM Redfish APIs spreadsheet.
Service Root
Code: get_service_root() in libredfish; probe_redfish_endpoint() in site_explorer/redfish.rs
| Endpoint | Method | Purpose |
|---|---|---|
/redfish/v1 | GET | Service root, vendor detection |
Key Response Fields
| Field | Importance | NICo Usage |
|---|---|---|
Vendor | Required | Vendor detection — determines all vendor-specific behavior |
Systems | Required | Link to systems collection |
Managers | Required | Link to managers collection |
Chassis | Required | Link to chassis collection |
UpdateService | Required | Link to firmware update service |
Systems
Code: get_systems(), get_system() in libredfish; exploration in site_explorer/redfish.rs
| Endpoint | Method | Purpose |
|---|---|---|
/redfish/v1/Systems | GET | List computer systems |
/redfish/v1/Systems/{id} | GET | System info, serial number, power state |
/redfish/v1/Systems/{id} | PATCH | Boot source override (boot_once/boot_first) |
/redfish/v1/Systems/{id}/Actions/ComputerSystem.Reset | POST | Power control (On/ForceOff/GracefulRestart/ForceRestart/ACPowercycle/PowerCycle) |
Key Response Fields
| Field | Importance | NICo Usage |
|---|---|---|
SerialNumber | Critical | Machine ID generation via DMI hash. Pairing fails without it. |
Id | Required | DPU detection (checks for "bluefield" substring) |
PowerState | Required | Health reporting, preingestion state validation. Values: On, Off, PoweringOn, PoweringOff, Paused, Reset |
Boot.BootOrder | Required | Boot order reporting and verification |
Boot.BootOptions | Required | Link to boot options for interface detection |
PCIeDevices | Required | Array of links — primary DPU-host pairing path |
EthernetInterfaces | Required | Link to system NICs for DPU pairing |
Model | Recommended | DPU model detection (BF2 vs BF3). Falls back gracefully. |
Manufacturer | Recommended | Machine ID generation. Has DEFAULT_DMI_SYSTEM_MANUFACTURER fallback. |
SKU | Optional | Validation against expected machines manifest |
BiosVersion | Optional | BIOS version tracking |
TrustedModules | Optional | TPM status reporting |
Sample response (GET /redfish/v1/Systems/{id}):
{
  "Id": "System.Embedded.1",
  "SerialNumber": "J1234XY",
  "PowerState": "On",
  "Manufacturer": "Dell Inc.",
  "Model": "PowerEdge R750",
  "Boot": {
    "BootOrder": ["NIC.Slot.3-1", "HardDisk.Direct.0-0:AHCI"],
    "BootOptions": { "@odata.id": "/redfish/v1/Systems/System.Embedded.1/BootOptions" }
  },
  "PCIeDevices": [
    { "@odata.id": "/redfish/v1/Systems/System.Embedded.1/PCIeDevices/236-0" }
  ],
  "EthernetInterfaces": { "@odata.id": "/redfish/v1/Systems/System.Embedded.1/EthernetInterfaces" }
}
Vendor-specific notes: Dell/Supermicro/HPE have system info overrides. NVIDIA DPU uses Oem.Nvidia for mode set/rshim. NVIDIA GBx00 uses Oem.Nvidia for machine setup.
System Ethernet Interfaces
Code: get_system_ethernet_interfaces(), get_system_ethernet_interface() in libredfish
| Endpoint | Method | Purpose |
|---|---|---|
/redfish/v1/Systems/{id}/EthernetInterfaces | GET | List system network interfaces |
/redfish/v1/Systems/{id}/EthernetInterfaces/{id} | GET | Interface details (MAC, UEFI path) |
Key Response Fields
| Field | Importance | NICo Usage |
|---|---|---|
MACAddress (or MacAddress) | Critical | DPU-host pairing, interface identification. Accepts both field name variants. |
UefiDevicePath | Required | Primary interface detection via PCI path ordering (parsed to format "2.1.0.0.0") |
Id | Required | Interface identification |
InterfaceEnabled | Optional | Error handling — disabled interfaces may have invalid MAC values |
Chassis
Code: get_chassis_all(), get_chassis(), get_chassis_assembly() in libredfish
| Endpoint | Method | Purpose |
|---|---|---|
/redfish/v1/Chassis | GET | List chassis |
/redfish/v1/Chassis/{id} | GET | Chassis info, serial number |
/redfish/v1/Chassis/{id}/Assembly | GET | Assembly info (GB200 serial extraction) |
/redfish/v1/Chassis/{id}/Actions/Chassis.Reset | POST | Chassis power control (AC power cycle) |
Key Response Fields
| Field | Importance | NICo Usage |
|---|---|---|
Id | Critical | System classification: "Card1"=DPU, "powershelf"=power shelf, "mgx_nvswitch_0"=NVSwitch, "Chassis_0"=GB200 |
SerialNumber | Critical | Fallback for system serial (DPU uses Chassis/Card1 serial). Power shelf/switch IDs. Whitespace trimmed. |
PartNumber | Required | BlueField DPU identification via part number matching (900-9d3b6, SN37B36732, etc.) |
NetworkAdapters | Required | Link to network adapters collection for DPU identification |
Model | Recommended | Model identification. GB200: Assembly checked for "GB200 NVL" model. |
Manufacturer | Recommended | Power shelf vendor identification. Has fallback defaults. |
Oem.Nvidia.chassis_physical_slot_number | Optional | Physical slot in multi-node systems |
Oem.Nvidia.compute_tray_index | Optional | Tray index in modular systems |
Oem.Nvidia.topology_id | Optional | System topology identifier |
Sample response (GET /redfish/v1/Chassis/{id}):
{
  "Id": "Card1",
  "SerialNumber": "MBF2M516A-CECA_Ax_SN123456",
  "PartNumber": "900-9D3B6-00CV-AA0",
  "Model": "BlueField-2 DPU 25GbE",
  "Manufacturer": "NVIDIA",
  "NetworkAdapters": { "@odata.id": "/redfish/v1/Chassis/Card1/NetworkAdapters" }
}
Network Adapters
Code: get_chassis_network_adapters(), get_chassis_network_adapter() in libredfish
| Endpoint | Method | Purpose |
|---|---|---|
/redfish/v1/Chassis/{id}/NetworkAdapters | GET | List network adapters |
/redfish/v1/Chassis/{id}/NetworkAdapters/{id} | GET | Adapter details (serial, part number) |
/redfish/v1/Chassis/{id}/NetworkAdapters/{id}/NetworkDeviceFunctions | GET | Network device functions (NVIDIA DPU) |
/redfish/v1/Chassis/{id}/NetworkAdapters/{id}/Ports | GET | Network adapter ports |
/redfish/v1/Chassis/{id}/NetworkAdapters/{id}/Ports/{id} | GET | Port details |
Key Response Fields
| Field | Importance | NICo Usage |
|---|---|---|
SerialNumber | Critical | DPU-host pairing fallback path. Must be visible to Host BMC. Whitespace trimmed. |
PartNumber | Critical | BlueField/SuperNIC identification via is_bluefield_model() |
Id | Required | Adapter tracking |
Sample response (GET /redfish/v1/Chassis/{id}/NetworkAdapters/{id}):
{
  "Id": "ConnectX6_1",
  "SerialNumber": "MT2243X01234",
  "PartNumber": "MCX653106A-HDAT_Ax",
  "Controllers": [
    {
      "FirmwarePackageVersion": "24.37.1014",
      "Links": { "PCIeDevices": [{ "@odata.id": "/redfish/v1/Systems/System.Embedded.1/PCIeDevices/236-0" }] }
    }
  ]
}
PCIe Devices
Code: pcie_devices() in libredfish; site_explorer exploration
| Endpoint | Method | Purpose |
|---|---|---|
/redfish/v1/Chassis/{id}/PCIeDevices | GET | PCIe device list (Supermicro uses chassis path) |
/redfish/v1/Chassis/{id}/PCIeDevices/{id} | GET | PCIe device details |
/redfish/v1/Systems/{id} (PCIeDevices array) | GET | PCIe device links embedded in system response |
Key Response Fields
| Field | Importance | NICo Usage |
|---|---|---|
SerialNumber | Critical | Primary DPU-host pairing — matched against DPU system serial numbers |
PartNumber | Critical | BlueField identification via is_bluefield_model() (BF2, BF3, BF3 SuperNIC) |
Id | Required | Device tracking |
Vendor-specific note: Supermicro uses Chassis/{id}/PCIeDevices; others embed PCIeDevices links in Systems/{id} response.
Managers
Code: get_managers(), get_manager() in libredfish
| Endpoint | Method | Purpose |
|---|---|---|
/redfish/v1/Managers | GET | List BMC managers |
/redfish/v1/Managers/{id} | GET | BMC info, firmware version |
/redfish/v1/Managers/{id}/Actions/Manager.Reset | POST | BMC reset |
/redfish/v1/Managers/{id}/Actions/Manager.ResetToDefaults | POST | BMC factory reset |
Key Response Fields
| Field | Importance | NICo Usage |
|---|---|---|
Id | Required | Manager identification. Viking detection: id == "BMC". Sets default manager ID for subsequent calls. |
FirmwareVersion | Required | BMC firmware version tracking |
UUID | Recommended | Manager unique identification |
EthernetInterfaces | Required | Link to BMC network interfaces |
LogServices | Required | Link to log services for event collection |
Vendor-specific notes: HPE has lockdown status override. Dell uses Managers/{id}/Attributes for lockdown/remote access. Supermicro uses Oem/Supermicro/SysLockdown.
Manager Ethernet Interfaces
Code: get_manager_ethernet_interfaces(), get_manager_ethernet_interface() in libredfish
| Endpoint | Method | Purpose |
|---|---|---|
/redfish/v1/Managers/{id}/EthernetInterfaces | GET | List BMC interfaces |
/redfish/v1/Managers/{id}/EthernetInterfaces/{id} | GET | BMC MAC, IP configuration |
Key Response Fields
| Field | Importance | NICo Usage |
|---|---|---|
MACAddress | Critical | BMC identification and credential storage/lookup |
Sample response (GET /redfish/v1/Managers/{id}/EthernetInterfaces/{id}):
{
  "Id": "1",
  "MACAddress": "B8:3F:D2:90:95:82",
  "IPv4Addresses": [{ "Address": "10.0.1.100" }]
}
Boot Options
Code: get_boot_options(), get_boot_option() in libredfish
| Endpoint | Method | Purpose |
|---|---|---|
/redfish/v1/Systems/{id}/BootOptions | GET | List boot options |
/redfish/v1/Systems/{id}/BootOptions/{id} | GET | Boot option details |
Key Response Fields
| Field | Importance | NICo Usage |
|---|---|---|
DisplayName | Required | OOB interface detection (checks for "OOB" string) |
UefiDevicePath | Required | MAC extraction via regex MAC\((?<mac>[[:alnum:]]+)\, — e.g. extracts B83FD2909582 to B8:3F:D2:90:95:82 |
BootOptionEnabled | Optional | Boot option state |
BootOptionReference | Required | Boot option ordering |
Sample response (GET /redfish/v1/Systems/{id}/BootOptions/{id}):
{
  "Id": "NIC.Slot.3-1",
  "DisplayName": "PXE OOB NIC Slot 3 Port 1",
  "UefiDevicePath": "PciRoot(0x2)/Pci(0x1,0x0)/Pci(0x0,0x0)/MAC(B83FD2909582,0x1)",
  "BootOptionEnabled": true,
  "BootOptionReference": "NIC.Slot.3-1"
}
BIOS
Code: bios(), set_bios(), pending(), clear_pending(), reset_bios(), change_bios_password() in libredfish
| Endpoint | Method | Purpose |
|---|---|---|
/redfish/v1/Systems/{id}/Bios | GET | Read BIOS attributes |
/redfish/v1/Systems/{id}/Bios/Settings | GET | Read pending BIOS changes |
/redfish/v1/Systems/{id}/Bios/Settings | PATCH | Write BIOS attributes (pending next reboot) |
/redfish/v1/Systems/{id}/Bios/Actions/Bios.ResetBios | POST | BIOS factory reset |
/redfish/v1/Systems/{id}/Bios/Actions/Bios.ChangePassword | POST | UEFI password management |
Key Response Fields
| Field | Importance | NICo Usage |
|---|---|---|
Attributes | Required | BIOS attribute read/write (SR-IOV enablement, machine setup) |
Vendor-specific paths: HPE uses /Bios/settings (lowercase). Lenovo uses /Bios/Pending. Viking uses /Bios/SD. Dell/NVIDIA DPU/GBx00/Supermicro have attribute-specific overrides.
Secure Boot
Code: get_secure_boot(), enable_secure_boot(), disable_secure_boot(), get_secure_boot_certificates(), add_secure_boot_certificate() in libredfish
| Endpoint | Method | Purpose |
|---|---|---|
/redfish/v1/Systems/{id}/SecureBoot | GET | Read secure boot status |
/redfish/v1/Systems/{id}/SecureBoot | PATCH | Enable/disable secure boot |
/redfish/v1/Systems/{id}/SecureBoot/SecureBootDatabases/{db}/Certificates | GET | List secure boot certs |
/redfish/v1/Systems/{id}/SecureBoot/SecureBootDatabases/{db}/Certificates | POST | Add secure boot cert |
/redfish/v1/Systems/{id}/SecureBoot/SecureBootDatabases/{db}/Certificates/{id} | GET | Cert details |
Key Response Fields
| Field | Importance | NICo Usage |
|---|---|---|
SecureBootEnable | Required | Secure boot enabled status |
SecureBootCurrentBoot | Required | Current boot secure boot state |
SecureBootMode | Optional | Secure boot mode reporting |
Account Service
Code: get_accounts(), change_password_by_id(), create_user(), delete_user(), set_machine_password_policy() in libredfish
| Endpoint | Method | Purpose |
|---|---|---|
/redfish/v1/AccountService | PATCH | Password policy/lockout settings |
/redfish/v1/AccountService/Accounts | GET | List user accounts |
/redfish/v1/AccountService/Accounts | POST | Create user account |
/redfish/v1/AccountService/Accounts/{id} | GET | Account details |
/redfish/v1/AccountService/Accounts/{id} | PATCH | Password/username change |
/redfish/v1/AccountService/Accounts/{id} | DELETE | Delete user account |
Key Response Fields
| Field | Importance | NICo Usage |
|---|---|---|
UserName | Required | Account management |
Password | Required | Credential rotation |
RoleId | Required | Admin role verification |
Id | Required | Account identification. Vendor-specific: Lenovo="1", AMI/Viking="2", NVIDIA=current user. |
Firmware Inventory
Code: get_software_inventories(), get_firmware() in libredfish; FirmwareCollector in health crate via nv-redfish
| Endpoint | Method | Purpose |
|---|---|---|
/redfish/v1/UpdateService | GET | Update service info |
/redfish/v1/UpdateService/FirmwareInventory | GET | List firmware components |
/redfish/v1/UpdateService/FirmwareInventory/{id} | GET | Component version details |
/redfish/v1/UpdateService/Actions/UpdateService.SimpleUpdate | POST | URL-based firmware update |
/redfish/v1/UpdateService/MultipartUpload | POST | Binary firmware upload (Dell) |
Key Response Fields
| Field | Importance | NICo Usage |
|---|---|---|
Id | Required | Component ID — matched against firmware config regex. Vendor-specific IDs: NVIDIA DPU=DPU_NIC/DPU_UEFI, Supermicro=CPLD_Backplane_1/CPLD_Motherboard, GBx00=EROT_BIOS_0/HGX_FW_BMC_0/HostBMC_0 |
Version | Required | Firmware version — used for upgrade decisions. DPU versions: trim, lowercase, remove "bf-" prefix. |
Name | Required | Component name — exported as Prometheus metric label firmware_name |
ReleaseDate | Optional | Informational |
Sample response (GET /redfish/v1/UpdateService/FirmwareInventory/{id}):
{
  "Id": "BMC_Firmware",
  "Name": "BMC Firmware",
  "Version": "7.00.00.171",
  "ReleaseDate": "2024-06-15T00:00:00Z",
  "Updateable": true
}
Sensors and Thermal (Health Monitoring)
Code: monitor.rs in health crate; get_thermal_metrics(), get_power_metrics() in libredfish
All endpoints below are polled at the configured sensor_fetch_interval (default 60 seconds).
| Endpoint | Method | Purpose |
|---|---|---|
/redfish/v1/Chassis/{id}/Sensors | GET | Environmental sensors |
/redfish/v1/Chassis/{id}/Thermal | GET | Temperature/fan readings |
/redfish/v1/Chassis/{id}/Power | GET | Power consumption/PSU |
/redfish/v1/Chassis/{id}/PowerSupplies | GET | Power supply collection |
/redfish/v1/Chassis/{id}/PowerSupplies/{id}/Sensors | GET | PSU sensor metrics |
/redfish/v1/Systems/{id}/Processors/{id}/EnvironmentSensors | GET | CPU temperature |
/redfish/v1/Systems/{id}/Memory/{id}/EnvironmentSensors | GET | Memory temperature |
/redfish/v1/Systems/{id}/Storage/{id}/Drives/{id}/EnvironmentSensors | GET | Drive temperature |
/redfish/v1/Chassis/{id}/Drives | GET | Drive info (GBx00) |
/redfish/v1/Chassis/{id}/ThermalSubsystem/ThermalMetrics | GET | Thermal metrics (GBx00) |
/redfish/v1/Chassis/{id}/ThermalSubsystem/LeakDetection/LeakDetectors | GET | Leak detection (GBx00) |
/redfish/v1/Chassis/{id}/EnvironmentMetrics | GET | Chassis power (GBx00/DPS) |
Key Response Fields
| Field | Importance | NICo Usage |
|---|---|---|
Reading / ReadingCelsius | Required | Sensor value for Prometheus metrics |
ReadingUnits / ReadingType | Required | Sensor classification: Cel, RPM, W, A |
Name | Required | Sensor identification in Prometheus labels |
Status.Health | Required | Health state: Ok, Warning, Critical |
Thresholds.UpperCritical | Optional | Alert thresholds (configurable via include_sensor_thresholds) |
Thresholds.LowerCritical | Optional | Alert thresholds |
ReadingRangeMax / ReadingRangeMin | Optional | Valid reading range |
Log Services
Code: logs_collector.rs in health crate; get_bmc_event_log(), get_system_event_log() in libredfish
Log collection runs at 5-minute intervals and uses incremental fetching: ?$filter=Id gt '{last_id}'
Discovery endpoints (all vendors)
| Endpoint | Method | Purpose |
|---|---|---|
/redfish/v1/Managers/{id}/LogServices | GET | Discover manager log services |
/redfish/v1/Chassis/{id}/LogServices | GET | Chassis log services |
/redfish/v1/Systems/{id}/LogServices | GET | System log services |
BMC event log entries (vendor-specific)
| Endpoint | Method | Vendor |
|---|---|---|
/redfish/v1/Managers/{id}/LogServices/Sel/Entries | GET | Dell |
/redfish/v1/Managers/{id}/LogServices/IEL/Entries | GET | HPE |
/redfish/v1/Managers/{id}/LogServices/SEL/Entries | GET | Viking |
/redfish/v1/Systems/{id}/LogServices/AuditLog/Entries | GET | Lenovo |
System event log entries (vendor-specific)
| Endpoint | Method | Vendor |
|---|---|---|
/redfish/v1/Systems/{id}/LogServices/EventLog/Entries | GET | NVIDIA DPU |
/redfish/v1/Systems/{id}/LogServices/SEL/Entries | GET | NVIDIA DPU/GBx00 |
/redfish/v1/Systems/{id}/LogServices/IML/Entries | GET | HPE |
Key Response Fields
| Field | Importance | NICo Usage |
|---|---|---|
Id | Required | Entry identifier for incremental collection |
Created | Required | Timestamp |
Severity | Required | Critical/Warning/Ok — maps to OTEL severity |
Message | Required | Log message text |
MessageArgs | Optional | Message format arguments |
Task Service
Code: get_tasks(), get_task() in libredfish
| Endpoint | Method | Purpose |
|---|---|---|
/redfish/v1/TaskService/Tasks | GET | List async operation tasks |
/redfish/v1/TaskService/Tasks/{id} | GET | Task status (firmware updates, lockdown, etc.) |
Dell also uses Managers/{id}/Jobs/{id} (converted to Task internally).
Component Integrity
Code: get_component_integrities(), get_component_ca_certificate(), trigger_evidence_collection(), get_evidence() in libredfish
| Endpoint | Method | Purpose |
|---|---|---|
/redfish/v1/ComponentIntegrity | GET | SPDM attestation components |
{component}/Certificates/CertChain | GET | Component CA certificate |
{component}/Actions/ComponentIntegrity.SPDMGetSignedMeasurements | POST | Trigger evidence collection |
Manager Network Protocol
Code: get_manager_network_protocol() in libredfish
| Endpoint | Method | Purpose |
|---|---|---|
/redfish/v1/Managers/{id}/NetworkProtocol | GET | BMC network services config |
/redfish/v1/Managers/{id}/NetworkProtocol | PATCH | Enable/disable IPMI access |
Storage
Code: get_drives_metrics() in libredfish; discover_drive_entities() in health monitor
| Endpoint | Method | Purpose |
|---|---|---|
/redfish/v1/Systems/{id}/Storage | GET | List storage controllers |
/redfish/v1/Systems/{id}/Storage/{id} | GET | Storage controller details |
/redfish/v1/Systems/{id}/Storage/{id}/Drives/{id} | GET | Drive details |
/redfish/v1/Systems/{id}/Storage/{id}/Volumes | POST | Create RAID volume (Dell) |
NVIDIA OEM Extensions
Code: Various methods in libredfish nvidia_dpu.rs, nvidia_gh200.rs, nvidia_gb200.rs, nvidia_gbswitch.rs
| Endpoint | Method | Vendor | Purpose |
|---|---|---|---|
Systems/{id}/Oem/Nvidia | GET | NVIDIA DPU | Base MAC, rshim status, NIC mode |
Systems/{id}/Oem/Nvidia/Actions/HostRshim.Set | POST | NVIDIA DPU | Set rshim (BF3) |
Systems/{id}/Oem/Nvidia/Actions/Mode.Set | POST | NVIDIA DPU | Set NIC/DPU mode |
Managers/Bluefield_BMC/Oem/Nvidia | PATCH | NVIDIA DPU | Enable rshim |
Chassis/BMC_0/Actions/Oem/NvidiaChassis.AuxPowerReset | POST | NVIDIA GBx00 | AC power cycle |
Chassis/HGX_Chassis_0 | GET | NVIDIA GBx00 | HGX chassis info |
Systems/HGX_Baseboard_0/Processors | GET | NVIDIA GBx00 | GPU enumeration (DPS) |
Systems/HGX_Baseboard_0/Processors/{id}/Oem/Nvidia/WorkloadPowerProfile | GET/POST | NVIDIA GBx00 | WPPS config (DPS) |
CI/CD Pipeline Endpoints
These endpoints are used by the CI/CD tooling (cicd/redfish_cli.py, cicd/install_wrapper.py) and are not part of core NICo.
| Endpoint | Method | Purpose |
|---|---|---|
{System}/VirtualMedia or {Manager}/VirtualMedia | GET | Virtual media devices |
{VirtualMedia}/Actions/VirtualMedia.InsertMedia | POST | Mount ISO image |
{VirtualMedia}/Actions/VirtualMedia.EjectMedia | POST | Eject media |
Systems/{id} | PATCH | Boot source override (CD once) |
{Manager}/HostInterfaces/{id} | PATCH | Enable/disable OS-to-BMC NIC |
SessionService/Sessions | POST | Create auth session |
Reliable State Handling
NCX Infra Controller (NICo) provides reliable state handling for a variety of resources via a mechanism called the state controller.
"Reliable state handling" refers to the ability of resources to traverse through lifecycle states even in the case of intermittent errors (e.g. a Host BMC or a dependent service is temporarily unavailable) via automated periodic retries. It also means that state handling is deterministic and free of race conditions.
These are the resources managed by the state controller:
- Managed Host Lifecycle
- IB Partition Lifecycle
- Network Segment Lifecycle
- Machine Lifecycle
The functionality of the state controller is described as follows:
- NICo defines some generic interfaces for resources that have states that need to be handled: the StateHandler interface and the IO interface. The handler implementation specifies how to transition between states, while IO defines how to load resources from the database and store them back there.
- The handler function is executed periodically (typically every 30s) and is implemented in an idempotent fashion, so, even if something fails intermittently, it will be automatically retried at the next iteration.
- The state handler is the only entity that directly changes the lifecycle state of a resource. And the only way to transition to a new state is by the handler function returning the new state as result. Other components like API handlers can only queue intents/requests (e.g. "Use this host as an instance", "Report a network status change", "Report a health status change"), preventing many race conditions.
- For hosts/machines, the implementation is basically a single, large switch/case ("if this state, then wait for this signal, and go to the next"). Modelling states as Rust enums is immensely useful here. The compiler raises errors if a particular state or substate is not handled. The top level host lifecycle state is defined here, and it is very large. The states also all serialize into JSON values, which can be observed in the state history with admin tools for each resource.
- State diagrams are provided on the Managed Host State Diagrams page.
- Every time the state handler runs, it also generates a set of metrics for every resource it manages, providing visibility into what resource is in what state, how long it takes to exit a state, where exiting a state fails due to failures, as well as resource specific metrics like host health metrics.
- Every state also has an SLA attached to it--an expected time for the resource to leave the state. The SLA is used to produce additional information in APIs (for example, "is the resource in a particular state for longer than the SLA?"), as well as in metrics and alerts, providing visibility into how many resources/hosts are stuck.
The execution of the state handlers is performed in the following fashion:
- The handler function is scheduled for execution periodically (typically every 30s) in a way that guarantees that state handlers for different resources can run in parallel, but the state handler for the same resource is running at most once. The periodic execution guarantees that even if something fails intermittently, it will be automatically retried in the next iteration.
- If the state handling function of a state handler returns
Transition(to the next state), then the state handler will be scheduled to run again immediately. This avoids the 30s wait time--which especially helps if the resource needs to go through multiple small states which should all be retryable individually. - In addition to periodic scheduling and scheduling on state transitions, NICo control plane components can also explicitly request the state handler for any given resource to re-run as soon as possible via the Enqueuer component. This allows the system to react as fast as possible to external events, e.g. to a reboot notification from a host.
Networking integrations
NCX Infra Controller (NICo) integrates with various network virtualization solutions that allow the bare metal instances of tenants to communicate on isolated partitions. Any instances that are not part of the same partition are not able to participate in communication - irrespective of whether these instances are owned by the same tenant or a different tenant.
Networking integrations in NICo achieve this through the following patterns:
Workflows
Tenant partition management
- Tenants have APIs for mananging a set of network partitions for their instances. Examples of these partitions are
- VPCs (for ethernet)
- InfiniBand partitions
- NVLink logical partitions
- There might be additional sub-apis for more in-depth management of these partitions, e.g. if resources (like IPs) need to be dynamically added to the partition.
- Tenants can query for the status of the partition via APIs. Each partition has a lifecycle status (Provisioning, Ready, Terminating).
- Partitions can only be fully deleted once there are no more instances associated with them. State machines for these objects with checks for the terminating state assure that.
- admin tools (web-ui and admin-cli) make site admins aware of these resources and their state
Tenant instance interface configurations
- Tenants are able to associate the network interfaces of their instances with a partition they created upfront. This configuration can either happen at instance creation time, or at a later time using
UpdateInstanceConfigcalls. - In order to support Virtual Machines on top of instances, partitions should be configurable on a per-interface base instead of per-host base. This allows the VM system to attach different interfaces (PCI PFs) to different VMs.
- When the instance is updated, the tenant will get accurate status if networking on the machine has been reconfigured to use the new partition using
configs_syncedattributes that are part of the instance status. This flag will also influence the overall readiness of the instance that is shown in thestatefield: If networking is not fully configured, the instance will show a status ofConfiguring. Once networking is configured, it will move toReady. - When the instance configuration is updated, the
config_versionfield that is part of theInstancewill get incremented. - On initial provisioning, the state machine will block booting into the tenant OS until the desired configuration is achieved. This guarantees that once the instance is booted, it can immediately communicate with all other instances of the tenant that share the partition.
- On instance termination, the termination flow blocks on the until the networking interfaces are reconfigured to no longer be part of any partition (the instance is isolated on the network). That assures that once the tenant is notified that the instance is deleted, it is at least fully isolated and can no longer show up as a "ghost instance" - even in case the disk might not be cleaned up yet. The "desired" instance configuration that is submitted by the tenant and reflected in the
InstanceConfigmessage will not change during that workflow. This means the system must also take another field in the machine object into account to switch from "tenant desired networking" to "isolated network".
Machine Capabilities and Instance types
- Tenants need to know how they can actually configure their instances. Valid configurations depend on the hardware. E.g. in an instance with 4 connected InfiniBand ports, tenants can associate each of these ports with a separate partition. However tenants are not able to configure instances without InfiniBand ports for IB.
- Tenants learn about the support configurations via "Instance Types", which hold a list of capabilities. Each type of networking capability informs a tenant on how the respective interface can be configured. This means for each configurable interface, the instance type should list a respective capability.
- The set of capabilies encoded in instance types must match or be a subset of the capabilities associated with a
Machine. Machine capabilities are detected during the hardware discovery and ingestion phases. They are viewable by site administrators via debug tools.- During Machine ingestion, data about all network interfaces is collected both in-band (using scout) and out-of-band (using site-explorer). The data is stored within
machineandmachine_topologiestables - Based on the raw discovery data, "machine capabilities" (type
MachineCapabilitiesSet) are computed by the core service and presented to site administrators. These capabilities inform users about the amount of interfaces which are configurable. For each network integration, a new type of machine capability is required. E.g. InfiniBand uses theMachineCapabilityAttributesInfinibandcapabiltiy, while nvlink uses theMachineCapabilityAttributesGpucapability.
- During Machine ingestion, data about all network interfaces is collected both in-band (using scout) and out-of-band (using site-explorer). The data is stored within
- The SKU validation feature can can include checks whether any newly ingested host includes the expected amount of network interfaces - where each network interface is typcially described as a machine capability.
Implementation requirements and considerations
To implement these workflows, the following patterns had been developed and proven successful in NICo:
Desired state vs actual state of network interfaces
-
For each network interface on each machine, NICo tracks both the the desired state (target network partition and other configs) as well as the actual state.
-
The desired state is a combination of the "tenant requested state" as well as a set of configurations internally managed by NICo.
- The tenant requested state is stored fully in the
InstanceConfigobject - The internal requested state is stored in the
ManagedHostNetworkConfigthat is part of themachinetable in the database. The most important field here is theuse_admin_networkfield which controls whether tenant configurations are overridden and that the machine should indeed be placed onto an isolated/admin network.
- The tenant requested state is stored fully in the
-
The actual state is stored as part of the
Machinedatabase object. The integration between NICo and the respective networking subsystem is responsible for updating it there. All other workflows within NICo will use this observed state for decision making instead of reaching out to any external services. This internal caching of observed state keeps workflows deterministic and reliable, since they act on the same source of truth. It also helps with reactivity and scaling, since all other code path won't need to reach out to an external service anymore to learn about network state.2 integration patterns had been developed here over time:
- The actual observed state is updated by a "monitoring and reconciliation task" specific to the networking technology. Examples of this integration are the
IbFabricMonitorservices (for InfiniBand) andNvlPartitionMonitor(for NVLink). This kind of monitoring and integration is favorable if the external networking is controlled via an external service, since the integration is able to fetch the actual networking state for more than one device and host at the same time and can update all affected machine objects at once. - The actual observed state is updated for each interface or host by a service associated with this interface by making an API call into NICo. An examples of this integration is
dpu-agentsending the observed DPU configuration via a gRPC call (RecordDpuNetworkStatus).
- The actual observed state is updated by a "monitoring and reconciliation task" specific to the networking technology. Examples of this integration are the
-
Site admins need to be able to view both the desired configuration for any interface as well as the actual configuration.
State reconciliation
There needs to be a mechanism that periodically compares the expected networking configuration with the desired netowrking configuration. If they are not in-sync, the respective components needs to take all the required actions to bring the configurations in sync.
- For networking technologies where an external service is used to control partitioning (NVLink, InfiniBand), the
Monitorbackground tasks are used to achieve this goal. If they detect a configuration mismatch, they perform API calls to the external networking service to resolve the problem. - For other integrations, an external agent can pull the desired configuration for any host, perform (potentially local) configuration changes, before reporting the new state back to Carbide. This approach is taken for DPUs.
Instance lifecycle and "tenant feedback"
- The
InstanceStatusshould define aconfigs_syncedfield that shows whether the network configuration for all interfaces of the instance is applied. There should be aconfigs_syncedfield per network integration (e.g.InstanceStatus::infiniband::configs_synced) in addition to the overallconfigs_syncedvalue.- The value of the per-technology
configs_syncedfields should be derived by comparing the desired network configurations to the actual configuration as stored in theMachineobject. This is implemented withinInstanceStatus::from_config_and_observation. - The value of the aggregate
configs_syncedfield is the logical and of all individualconfigs_syncedfields in theInstanceStatusmessage.
- The value of the per-technology
- The instances tenant status (as communicated via
Instance::status::tenant::state) should take into account whether the desired configuration is applied:- If an instance is still in one of the provisionig states (anything before
Ready), it will show a tenant status ofProvisioning. - If the instance ever had been
Ready, and the actual network configuration deviates from the intended configuration, the status should showConfiguring. - If instance termination has been requested, the instances status should show
Terminatingindependent of network configurations.
- If an instance is still in one of the provisionig states (anything before
- The instance state machine should have guards in certain states that wait until the desired network configurations are applied:
- During initial instance provisioning (before
Readystate), one state in the state machine should wait until the desired network configuration is applied. For DPU configurations, this happens in theWaitingForNetworkConfigstate. The guards in this state should use the same logic that derive theconfigs_syncedvalue for tenants. - During instance termination, one state in the state machine should wait until the machine is isolated from any other machine in the network. If this step is omitted (to let the machine proceed termination in the case of an unhealthy network fabric), the respective machine must at least be tagged with a health alert that would prevent a different tenant from using the host. Both options guarantee that no other tenant will get access to the tenants network partition.
- During initial instance provisioning (before
Machine Capabilities and Instance types
- The machine capabilities definitions need to be extended for each new networking technology.
- Hardware enumeration processes need to be updated in order to fetch and store the new types of capabilities.
Fabric health monitoring and debug capabilities
- If a network subsystem is managed via an external fabric monitor service, the health of the service (as visible to NICo) should be monitored, in order to allow NICo admins to understand whether there are upstream issues that would lead to network configurations not being applied. Common metrics that should be monitored are upstream service availability (request success rates) as well as latencies for any API calls.
- For certain networking technologies, NICo integrated debug tools that allow NICo operators to view the state of the fabric manager service without requiring credentials. The UFM explorer functionality in NICo is an example of such a tool. For any future integration, similar tools should get integrated if possible.
Configurability
- Whether a certain network virtualization technology is available in a NICo deployment should be configurable via NICo config files.
Managed Host force delete support
- When a host is force-deleted from the system, it will not go through the regular deprovisioning states. This means without extra support, networking configurations for the host would still persist in external agents and fabric managers.
- To prevent that, the force-delete code-path should contain extra logic to detach the host from partitions via external fabric manager APIs.
External fabric manager client libraries
- If an external fabric manager is used to observe interface state and set configuration, a client library in Rust is required.
- Interactions with external fabric managers will require credentials. These should be read from the file system, and get injected via an external service (e.g. K8S secrets).
DPU Configuration
NCX Infra Controller (NICo) is a Bare-Metal-As-A-Service (BMaaS) solution. It manages the lifecycle of hosts, including user OS installation, host cleanup, validation tests, and automated software updates. It also provides host monitoring and virtualized private networking capabilities on ethernet and InfiniBand.
In order to enable virtual private networks (overlay networks), NICo utilizes DPUs as primary ethernet interfaces of hosts.
This document describes how NICo controls DPUs in order to achieve this behavior.
Guiding Principles
The following guiding principles are for DPU configuration:
- Allow reconfiguration of DPU from any configuration into any other configuration with minimal complexity.
- Provide precise feedback on whether DPUs are configured as required, or whether stale configurations are present on the DPU.
- DPUs configurations can be reconstructed at any point in time (for example, if a firmware update and new operating system are installed on the DPU).
Core Configuration Flow
DPUs are configured by the NICo site controller via a declarative and stateless mechanism:
- The agent running on DPUs (
dpu-agent) requests the current desired configuration via theGetManagedHostNetworkConfiggRPC API call. Example data of the returned configuration is provided in the Appendix below. - Every configuration that is received from the site controller is converted into a NVUE configuration file, which is then used to reconfigure HBN via the nvue CLI tool (
nv config apply). - The
dpu-agentalso reconfigures a DHCP server running on the DPU, which responds to DHCP requests from the attached host. - After HBN and the DHCP server are reconfigured,
dpu-agentimplements health-checks that supervise whether the desired configurations are in-place and check whether the DPU is healthy (e.g. the agent continuously checks whether the DPU has established BGP peering with TORs and route servers according to the desired configuration). - The
dpu-agentuses theRecordDpuNetworkStatusgRPC API call to report back to the site control plane whether the desired configurations are applied, and whether all health checks are succeeding. - For the first 30s after any configuration change, the DPU reports itself as unhealthy with a
PostConfigCheckWaitalert. This gives the DPU some time to monitor the stability and health of the new configuration before the site controller assumes that the new configuration is fully applied and operational.
sequenceDiagram
    box rgba(85, 102, 57, 0.2) Site Controller
        participant NICo as NICo API
    end

    box rgba(8, 143, 143, .2) DPU
        participant Agent as dpu-Agent
        participant Nvue as nvue
        participant Dhcp as DHCP Server
    end

    loop Every 30s
        Agent->>NICo: GetManagedHostNetworkConfig()<br>Returns desired configs and versions
        Agent->>Nvue: Apply requested configuration
        Agent->>Dhcp: Reconfigure DHCP Server
        Agent->>Agent: Health checks
        Agent->>NICo: RecordDpuNetworkStatus()<br>Report applied config versions<br>Report DPU health
    end
Configuration Versioning
NICo uses versioned immutable configuration data in order to detect whether any intended changes have not yet been deployed:
- Every time a configuration for the DPU changes, an associated version number is increased.
- The version number is sent back from the DPU to the site controller as part of the
RecordDpuNetworkStatuscall. - If the reported version number of the DPU does match the last desired version number and if the DPU reports itself as healthy/operational, the control plane knows that the configuration was deployed and can report that fact to tenants. If the version number does not match the desired version number, or if the DPU is not yet healthy, the instance will appear as
Provisioning/Configuring/Terminatingto the administrator. - NICo will never show a configuration as applied without feedback from the DPU. Doing so would cause reliability issues (e.g. double-assignment of IPs), as well as raise security concerns.
The DPU configuration that is applied can be understood as coming from two different sources:
- Tenant configurations: While the host is under control of a tenant, the tenant can change the desired overlay network configuration. The tenant can e.g. control from which VPC prefix an IP address should be allocated for a given network interface. They can also decide how many Virtual Function interfaces (VFs) are utilized, and what their configuration is.
- Site controller and host lifecycle: During the lifecycle of a host, certain parts of the network configuration need to be updated. For example, when the host is provisioned for a tenant, the host networking gets reconfigured from using the admin overlay network towards the tenant overlay network. When the host is released by the tenant, it is moved back onto the admin network.
In order to separate these concerns, NICo internally uses two different configuration data structs and associated version numbers (instance_network_config versus managedhost_network_config). It can thereby distinguish whether a setting that is required by the tenant has not been applied, compared to whether a setting that is required by the control plane has not been applied.
Some example workflows that lead to updating configurations are shown in the following diagram:
sequenceDiagram
    actor User as NICo User

    box rgba(118, 185, 0, .2) Site Controller
        participant NICo as NICo API
    end

    box rgba(8, 143, 143, .2) DPU
        participant Agent as dpu-Agent
        participant Nvue as nvue
        participant Dhcp as DHCP Server
    end

    opt On Instance creation
        User ->> NICo: Create Instance
        NICo ->> NICo: Set Instance config and version<br>Update ManagedHost config (use_admin_network: false) and increment version
        Agent->>NICo: GetManagedHostNetworkConfig()<br>Returns desired configs and versions
        Agent->>Nvue: Apply requested configuration
        Agent->>Dhcp: Reconfigure DHCP Server
        Agent->>Agent: Health checks
        Agent->>NICo: RecordDpuNetworkStatus()<br>Report applied config versions<br>Report DPU health
        Note right of NICo: Transition Host between required states
        NICo ->> User: Report the Instance is Ready for usage
    end

    opt On Instance deletion
        NICo ->> NICo: Update ManagedHost config (use_admin_network: true)<br>and increment version
        Agent->>NICo: GetManagedHostNetworkConfig()<br>Returns desired configs and versions
        Agent->>Nvue: Apply requested configuration
        Agent->>Dhcp: Reconfigure DHCP Server
        Agent->>Agent: Health checks
        Agent->>NICo: RecordDpuNetworkStatus()<br>Report applied config versions<br>Report DPU health
        NICo->>NICo: Observe that expected ManagedHost network config is applied<br>Transition Host to cleanup states
        Note right of NICo: Additional Host cleanup
        NICo ->> User: Notify User that instance deletion succeeded
    end
Host isolation
One important requirement for NICo is that Hosts/DPUs that are not confirmed to be part of the site are isolated from the remaining hosts on the site.
A DPU might get isolated from the cluster without the DPU software stack being erased (e.g. by site operators removing the knowledge of the DPU from the site database).
In order to satisfy the isolation requirements and to prevent unknown DPUs on the site from using resources (e.g. IPs on overlay networks), an additional mechanism is implemented: If the GetManagedHostNetworkConfig gRPC API call returns a NotFound error, the dpu-agent will configure the DPU/Host into an isolated mode.
The isolated configuration is only applied when the site controller is unaware of the DPU and its expected configuration. In case of any other errors (for example, intermittent communication issues), the DPU retains its last known configuration.
Note: This is not the only mechanism that NICo utilizes to provide security on the networking layer. In addition to this, ACLs and routing table separation are used to implement secure virtual private networks (VPCs).
Appendix
DPU Configuration Example
{
  "asn": 4294967000,
  "dhcp_servers": [
    "192.168.126.2"
  ],
  "vni_device": "vxlan48",
  "managed_host_config": {
    "loopback_ip": "192.168.96.36",
    "quarantine_state": null
  },
  "managed_host_config_version": "V3-T1733950583707475",
  "use_admin_network": false,
  "admin_interface": {
    "function_type": 0,
    "vlan_id": 14,
    "vni": 0,
    "gateway": "192.168.97.1/24",
    "ip": "192.168.97.49",
    "interface_prefix": "192.168.97.49/32",
    "virtual_function_id": null,
    "vpc_prefixes": [],
    "prefix": "192.168.97.0/24",
    "fqdn": "192.168-97-49.example.com",
    "booturl": null,
    "vpc_vni": 0,
    "svi_ip": null,
    "tenant_vrf_loopback_ip": null,
    "is_l2_segment": true,
    "vpc_peer_prefixes": [],
    "vpc_peer_vnis": [],
    "network_security_group": null
  },
  "tenant_interfaces": [
    {
      "function_type": 0,
      "vlan_id": 16,
      "vni": 1025032,
      "gateway": "192.168.98.1/26",
      "ip": "192.168.98.11",
      "interface_prefix": "192.168.98.11/32",
      "virtual_function_id": null,
      "vpc_prefixes": [
        "192.168.98.0/26"
      ],
      "prefix": "192.168.98.0/26",
      "fqdn": "192.168-98-11.unknowndomain",
      "booturl": null,
      "vpc_vni": 42,
      "svi_ip": null,
      "tenant_vrf_loopback_ip": null,
      "is_l2_segment": true,
      "vpc_peer_prefixes": [],
      "vpc_peer_vnis": [],
      "network_security_group": null
    }
  ],
  "instance_network_config_version": "V1-T1733950572461281",
  "instance_id": {
    "value": "b4c38910-9319-4bee-ac04-10cabb569a4c"
  },
  "network_virtualization_type": 2,
  "vpc_vni": 42,
  "route_servers": [
    "192.168.126.5",
    "192.168.126.11",
    "192.168.126.12"
  ],
  "remote_id": "c3046v74fnh6n4fs5kqvha0t76ub7ug7r9eh1dtilj0pe89eh99g",
  "deprecated_deny_prefixes": [
    "192.168.4.128/26",
    "192.168.98.0/24",
    "172.16.205.0/24"
  ],
  "dpu_network_pinger_type": "OobNetBind",
  "deny_prefixes": [],
  "site_fabric_prefixes": [
    "192.168.4.128/26",
    "192.168.98.0/24",
    "172.16.205.0/24"
  ],
  "vpc_isolation_behavior": 2,
  "stateful_acls_enabled": false,
  "enable_dhcp": true,
  "host_interface_id": "3912c59c-8fc0-400d-b05f-7bf62405018f",
  "min_dpu_functioning_links": null,
  "is_primary_dpu": true,
  "multidpu_enabled": false,
  "internet_l3_vni": null
}
Health Checks and Health Aggregation
NICo integrates a variety of tools to continuously assess and report the health of any host under its management. It also allows site operators to configure and extend the set of health checks via runtime configurations and extension APIs.
The health information that is obtained by these tools is rolled up within Carbide-Core into an "aggregated host health". The aggregated host health information is used for multiple purposes:
- For NICo internal decision making - e.g. "is this host usable as a bare metal instance by a tenant" and "is the host allowed to transition between 2 states".
- The aggregated host health information is made available to NICo API users. Site administrators can use the information to assess host health and external fleet health automation systems can use it to trigger remediation workflows.
- A filtered subset of the aggregated health status is made available to tenants in order to inform them whether their host is subject to known problems and whether they should release it.
Health check types
Health checks roughly fall into 3 categories:
- Out of band health checks: These continuous health checks are able to continuously assess the health of a host - independent of whether there the host is used as a bare metal instance or not. Within this category, NICo provides the following types of health checks
- In band health checks: These health checks run at certain well-defined points in time during the host lifecycle. Within this category, NICo provides the following types of health checks
- Health status assessments by external tools and operators: NICo allows external tooling to provide health information via APIs. These APIs have the same capabilities as all health related tools that are provided by NICo. They can thereby used to extend the scope of health-monitoring as required by site operators. These APIs are described in the Health overrides
The overall health of the system can be seen as the combination of all health reports
reports. If any component reports that a subsystem is not healthy, then the
overall system is not healthy. This combination of health-reports is performed
inside carbide-core at any time the health status of a host is queried.
A more detailed list of health probes can be found in Health Probe IDs.
A list of health alert classifications can be found in Health Alert Classifications.
Overview diagram
The following diagram provides an overview about the current sources of health information within NICo, and how they are rolled up for API users:
flowchart TB
    classDef bmcclass fill:orange,stroke:#333,stroke-width:3px;
    classDef osclass fill:lightblue,stroke:#333,stroke-width:3px;
    classDef hostclass fill:lightgrey,stroke:#333,stroke-width:3px;
    classDef carbideclass fill:#76b900,stroke:#333,stroke-width:3px;

    subgraph Users["Users and External Systems"]
        direction TB
        extautomations["External Automation Systems"]
        siteadmin["NICo<br>Site Admin 🧑"]
        tenant["NICo<br>Bare Metal Instance<br>User (Tenant) 🧑"]
        Metrics["Site MetricsAggregation (OTEL, Prometheus, etc)"]
    end

    subgraph Deployment["NICo Deployment"]
        carbide-core["<b>carbide-core</b><br>- derives aggregate Health status<br>- uses aggregate health for decision making"]
        HWMON["Hardware Health Monitor"]
        class carbide-core carbideclass;
        class HWMON carbideclass;
    end

    subgraph Host["Host"]
        direction TB
            subgraph hbmc["BMC"]
            end
            hbmc:::bmcclass;
            subgraph hostos["Host OS"]
                forge-scout("forge-scout running<br>validation tests")
            end
            class hostos osclass;
    end

    subgraph DPU["DPU"]
        direction TB
            subgraph dpubmc["BMC"]
            end
            dpubmc:::bmcclass;
            subgraph dpuos["DPU OS"]
                dpu-metrics-collector["DPU metrics collector (DTS, OTEL)"]
                forge-dpu-agent["forge-dpu-agent<br>Performs additional health checks"]
            end
            class dpuos osclass;
    end

    subgraph ManagedHostHost["NICo Managed Host"]
        direction TB
            Host
            DPU
        class DPU hostclass;
        class Host hostclass;
    end

    carbide-core -- Host Inventory --> HWMON
    HWMON -- BMC metric extraction<br>via redfish --> hbmc & dpubmc
    HWMON -- Host & DPU BMC Metrics --> Metrics
    HWMON -- BMC Health Rollups --> carbide-core
    forge-scout -- Validation Test Results --> carbide-core
    forge-dpu-agent -- DPU Health rollup --> carbide-core
    dpu-metrics-collector -- Health related DPU metrics --> forge-dpu-agent
    dpu-metrics-collector -- DPU Metrics --> Metrics
    carbide-core -- Host Health Status --> siteadmin & extautomations
    siteadmin & extautomations -- overwrite Health status via API --> carbide-core
    carbide-core -- Instance Health Status --> tenant
Health Report format
NICo components exchange and store aggregated health information internally in a datastructure called HealthReport. It contains a set of failed health checks (alerts) as well as a set of succeeded health checks (successes). Each check describes exactly which component had been probed (id and target fields).
The datastructure had been designed and optimized for merging health information from a variety of sources into an aggregate report. E.g. if 2 subsystems report health, and each subsystem reports 1 health alert, the aggregate health report will contain 2 alerts if the alerts are reported by different probe IDs.
A Health report is described as follows in gRPC format. Health reports are in some workflows also exposed in other formats - e.g. JSON. These formats would still follow the same schema.
// Reports the aggregate health of a system or subsystem
message HealthReport {
  // Identifies the source of the health report
  // This could e.g. be `forge-dpu-agent`, `forge-host-validation`,
  // or an override (e.g. `overrides.sre-team`)
  string source = 1;
  // The time when this health status was observed.
  //
  // Clients submitting a health report can leave this field empty in order
  // to store the current time as timestamp.
  //
  // In case the HealthReport is derived by combining the reports of various
  // subsystems, the timestamp will relate to the oldest overall report.
  optional google.protobuf.Timestamp observed_at = 2;
  // List of all successful health probes
  repeated HealthProbeSuccess successes = 3;
  // List of all alerts that have been raised by health probes
  repeated HealthProbeAlert alerts = 4;
}

// An alert that has been raised by a health-probe
message HealthProbeAlert {
  // Stable ID of the health probe that raised an alert
  string id = 1;
  // The component that the probe is targeting.
  // This could be e.g.
  // - a physical component (e.g. a Fan probe might check various chassis fans)
  // - a logical component (a check which probes whether disk space is available
  //   can list the volume name as target)
  //
  // The field is optional. It can be absent if the probe ID already fully
  // describes what is tested.
  //
  // Targets are useful if the same type of probe checks the health of multiple components.
  // If a health report lists multiple probes of the same type and with different targets,
  // then those probe/target combinations are treated individually.
  // E.g. the `in_alert_since` and `classifications` fields for each probe/target
  // combination are calculated individually when reports are merged.
  optional string target = 6;
  // The first time the probe raised an alert
  // If this field is empty while the HealthReport is sent to carbide-api
  // the behavior is as follows:
  // - If an alert of the same `id` was reported before, the timestamp of the
  // previous alert will be retained.
  // - If this is a new alert, the timestamp will be set to "now".
  optional google.protobuf.Timestamp in_alert_since = 2;
  // A message that describes the alert
  string message = 3;
  // An optional message that will be relayed to tenants
  optional string tenant_message = 4;
  // Classifications for this alert
  // A string is used here to maintain flexibility
  repeated string classifications = 5;
}

// A successful health probe (reported no alerts)
message HealthProbeSuccess {
  // Stable ID of the health probe that succeeded
  string id = 1;
  // The component that the probe is targeting.
  // This could be e.g.
  // - a physical component (e.g. a Fan probe might check various chassis fans)
  // - a logical component (a check which probes whether disk space is available
  //   can list the volume name as target)
  //
  // The field is optional. It can be absent if the probe ID already fully
  // describes what is tested.
  //
  // Targets are useful if the same type of probe checks the health of multiple components.
  // If a health report lists multiple probes of the same type and with different targets,
  // then those probe/target combinations are treated individually.
  // E.g. the `in_alert_since` and `classifications` fields for each probe/target
  // combination are calculated individually when reports are merged.
  optional string target = 2;
}
Classification of health probe results
For failed health checks, the HealthProbeAlert can carry an optional set of classifications that describe how the system will react on the failed health check.
The core idea here is that not all types of alerts have the same significance, and that different alerts will require a different response by NICo and site administrators: E.g. a BGP peering failure with a BGP peering issue on just one of the 2 redundant links will not render a host automatically unusable, while a fully unreachable DPU implies that the host can't be used.
Health alert classifications decouple the NICo logic from the actual alert IDs. E.g. NICo logic does not have to encode an exhaustive check over all possible health probe IDs:
#![allow(unused)]
fn main() {
if alert.id == "BgpPeeringFailure" || alert.id === BmcUnreachable || lots_of_other_conditions {
    host_is_fit_for_instance_creation = false;
}
}
Instead of this, it can just scan whether any of the health alerts in the aggregate host health carries a certain condition:
#![allow(unused)]
fn main() {
if alert.classifications.contains("PreventAllocations") {
  host_is_fit_for_instance_creation = false;
}
}
This mechanism also allows site-administrator provided health checks via Health report override APIs to trigger the same behavior as integrated health checks.
The set of classifications that are currently interpreted by NICo is described in List of Health Alert Classifications
In band health checks
Host validation tests
NICo will schedule the execution of validation tests at via the scout tool on the actual host host at various points
in the lifecycle of a managed host:
- When the host is ingested into NICo
- After an instance is released by tenant and got cleaned up
- On demand while the host is not assigned to any tenant
The set of tests that are run on a host are defined by the site administrator.
Each test is defined as an arbitrary shell script which needs to run and is expected to return an exit code of 0.
The framework thereby allows the execution of off-the-shelf tests, e.g. using the tools dcgm, stress-ng or benchpress.
If Host validation fails, a Health Alert with ID FailedValidationTest or FailedValidationTestCompletion will be placed on the host to make the host un-allocatable by tenants.
In addition to that, the full test output (stdout and stderr) will be stored within carbide-core and is made available to NICo users via APIs, admin-cli and admin-ui.
Details can be found in the Machine validation manual.
SKU validation tests
SKU validation is a feature in NICo which validates that a host contains all the hardware it is expected to contain by validating it to "conform to a certain SKU". The SKU is the definition of hardware components within the host. And the SKU validation workflow compares it the the set of hardware components that have been detected via NICo hardware discovery workflows - which utilize inband data as well as out of band data.
SKU validation can thereby e.g. detect
- whether a host has the right type of CPU installed
- whether a host has the right amount of memory installed
- whether a host has the right type and amount of GPUS installed
- whether a host has the right type and amount of InfiniBand NICs installed, and whether they are connected to switches
SKU validation runs at the same points in the host lifecycle as machine validation tests, and can also be run on-demand while the host is not assigned to any tenant.
If SKU validation fails, a Health Alert with ID SkuValidation will be placed on the host
to make the host un-allocatable by tenants.
Details can be found in the SKU validation manual.
Out of band health monitoring
BMC health monitoring
The carbide-hw-health service periodically queries all Host and DPU BMCs in the system for health information. It emits the captured health datapoints as metrics on a metrics endpoint that can be scraped by a standard telemetry system (prometheus/otel).
Health metrics fetched from BMCs include:
- Fan speeds
- Temperatures
- Power supply utilization, outputs and voltages
In addition to metrics, carbide-hw-health also extracts the values of various event-logs from the BMC and stores them on-disk in order to make them easily accessible for a standard telemetry exporter (e.g. OpenTelemetry Collector based).
Finally, carbide-hw-health also emits a health-rollup in HealthReport format towards carbide-core that contains an assessed health status of the host based on the extracted metrics.
This assessed health status is built by comparing the metrics that are emitted from BMCs against well-defined
ranges or by interpreting the health_ok values provided by BMCs.
BMC inventory monitoring
The Site Explorer process within Carbide Core periodically queries all Host and DPU BMCs in order to record certain BMC properties (e.g. components within a host and firmware versions).
In certain conditions the scraping process will place a health alert on the host:
- If the host BMC is not reachable
- If any of the host properties indicates the host is not fit for instance creation.
dpu-agent based health monitoring
dpu-agent collects health information directly on the DPU and sends a health-rollup towards carbide-core. The agent monitors a variety of health conditions, including
- whether BGP sessions are established to peers according to the current configuration of the DPU
- whether all required services on the DPU are running
- whether the DPU is configured in restricted mode
- whether the disk utilization ib below a threshold
Health report overrides
Site administrators are able to update the health state of any NICo managed host via
the API calls InsertHealthReportOverride and RemoveHealthReportOverride.
The override API offers 2 different modes of operation:
merge(default) - In this mode, any health probe alerts indicated in the override will get merged with health probe alerts reported by builtin NICo tools in order to derive the aggregate host health status. This mode is meant to augment the internal health monitoring mechanism with additional sources of health datareplace- In this mode, the health probe alerts reported by builtin NICo monitoring tools will be ignored. Only alerts that are passed as part of the override will be taking into account. If the override list is empty, the system will behave as if the Host would be fully healthy. This mode is meant to bypass the internal health data in case the site operator desires a different behavior
The API allows to apply multiple merge overrides to a hosts health at the same time by using a different HealthReport::source identifier.
This allows to integrate health information from multiple external systems and users which are not at risk of overriding each others data. E.g. health information from an external fleet health monitoring system and from SREs can be stored independently.
If a ManagedHosts health is overriden, the remaining behavior is exactly the same as if the overridden Health report would have been directly derived from monitoring hardware health:
- The host will be allocatable depending on whether any
PreventAllocationsclassification is present in the aggregate host health - State transitions behave as if NICo integrated monitoring would have detected
the same health status:
- A ManagedHost whose health status is overridden from healthy to not-healthy will stop performing certain state transitions that require the host to be healthy.
- A ManagedHost whose health status is overridden from not-healthy to healthy will perform state transitions that it would eitherwise not have performed. This is useful for unblocking hosts in certain operational scenarios - e.g. where the integrated health monitoring system reported a host as non-healthy for an invalid reason.
- NICo API users will observe that the ManagedHost is not healthy. They will also observe that a health override is applied.
Health probe IDs
This page provides a list of health probes provided by NCX Infra Controller (NICo), along with their IDs.
Health reports will contain these IDs in the alerts section in case the associated check or validation has failed.
Machine validation health probe identifiers
FailedValidationTest
Indicates that a certain host validation test failed. The alert will carry details about which test failed.
FailedValidationTestCompletion
Indicates that the host validation test framework failed to complete scheduling all specified tests on the host.
SKU validation health probe identifiers
SkuValidation
An alert with this ID is placed on a host in case the SKU validation workflow failed. The alert will make the host un-allocatable by tenants.
Repair workflow integrations related health probe identifiers
TenantReportedIssue
Indicates that a tenant reported an issue with the host while releasing the bare metal instance. The host won't be available for other tenants until the alert is cleared.
RequestRepair
Indicates that a tenant reported an issue with the host while releasing the bare metal instance and that repair by an external framework is required.
Site Explorer health probe identifiers
BmcExplorationFailure
Indicates that the hosts BMC endpoint could not be scraped. This can happen if the BMC is not reachable, but also in case the BMC response to any API call is malformed.
PoweredOff
Indicates that the power status of a host as reported by the BMC is not on.
SerialNumberMismatch
Indicates that the serial number on a host does not match the serial number in the Expected Machine manifest.
Hardware/BMC health probe identifiers
carbide-hardware-health currently reports sensor-based hardware health with a single probe ID:
BmcSensor
Indicates that a BMC sensor reported a warning/critical/failure condition.
Details:
targetis set to the BMC sensor ID (for example, a fan/temperature/power sensor name).- The alert
messagecontains the entity type, reading, unit, and threshold ranges used for evaluation. - Classifications are documented in Health alert classifications, including
Hardware,SensorWarning,SensorCritical, andSensorFailure.
message format:
<entity_type> '<sensor_id>': <status> - reading <value><unit> (<reading_type>), valid range: <range>, caution: <range>, critical: <range>
Example:
power_supply 'PSU0_OutputPower': Critical - reading 1320.00W (power), valid range: 0.0 to 1500.0, caution: 1200.0 to 1300.0, critical: 0.0 to 1310.0
DPU related health probe identifiers
BgpPeeringTor
Indicates that a BGP session with a top-of-rack (TOR) switch could not be established by a host/DPU.
BgpPeeringRouteServer
Indicates that a BGP session with the route server that is part of the part of the Carbide control plane could not be established by a host/DPU.
BgpStats
Indicates that BGP statistics could not be extacted by dpu-agent
BgpDaemonEnabled
Indicates that the BGP daemon (FRR) is not running on the DPU
DhcpRelay
Indicates issues regarding the start of the DHCP relay on the DPU
DhcpServer
Indicates issues regarding the start of the DHCP server on the DPU
HeartbeatTimeout
Indicates that there was no communication between dpu-agent and carbide-core for a certain amount of time.
This condition usually implies that the DPU won't be able to apply any configuration changes.
StaleAgentVersion
Indicates that dpu-agent has not been updated to the newest version, even though the newest release had been available for a certain amount of time.
ContainerExists
Indicates that a container that was expected to run on the DPU is not running
SupervisorctlStatus
Indicates an issue with retrieving the list of running services
ServiceRunning
Indicates that an expected service on the DPU is not runnning
PostConfigCheckWait
The alert is placed on a host for a few seconds after a configuration change by dpu-agent in order to allow the configuration changes to "settle" before doing the health assessment. That avoids the host to move between states even though the new configuration might be problematic.
RestrictedMode
Indicates that the DPU is not running in restricted mode
DpuDiskUtilizationCheck
Indicates that the dpu-agent failed to check disk utilization
DpuDiskUtilizationCritical
Indicates that the dpu-agent disk utilization on the DPU is above a critical threshold
Other health probe identifiers
MissingReport
The alert indicates that no health report was received, where health report
was expected. It is different from HeartbeatTimeout in the following sense
HeartbeatTimeoutalerts can be emitted if data is available, but stale.MissingReportis only emitted if data has never been received.MissingReportis mainly used on the NICo client side. It has no impact on state changes.
MalformedReport
An alert which can be generated if a HealthReport can not be parsed This alert is only be used the NICo client side if failing to render the health report is preferrable to failing the workflow.
Maintenance
The alert is used by site admins to mark hosts that are under maintenance - e.g. for CPU or memory replacements.
HostUpdateInProgress
Indicates that an update for host firmware was scheduled on the host
IbCleanupPending
Indicates that the host was released back to the admin pool without the system being able to fully clean up all port to partition key associations for all InfiniBand interfaces. This means the host might still be bound to a tenants partition. Once the IB subsystem can communicate with UFM and detects that the port is not bound to a partition anymore, the alert will automatically clear.
Health alert classifications
NCX Infra Controller (NICo) currently uses and recognizes the following set of health alert classifications by convention:
PreventAllocations
Hosts with this classification can not be used by tenants as instances. An instance creation request using the hosts Machine ID will fail, unless the targeted instance creation feature is used.
PreventHostStateChanges
Hosts with this classification won't move between certain states during the hosts lifecycle. The classification is mostly used to prevent a host from moving between states while it is uncertain whether all necessary configurations have been applied.
SuppressExternalAlerting
Hosts with this classification will not be taken into account when calculating site-wide fleet-health. This is achieved by metrics/alerting queries ignoring the amount of hosts with this classification while doing the calculation of 1 - (hosts with alerts / total amount of hosts).
ExcludeFromStateMachineSla
Hosts with this classification will not be counted towards state machine transition time SLA. This classification is mostly used to prevent state machine keep alerting when some manual operations are being performed on the machine.
StopRebootForAutomaticRecoveryFromStateMachine
For hosts with this classification, the NICo state machine will not automatically execute certain recovery actions (like reboots). The classification can be used to prevent NICo from interacting with hosts while datacenter operators manually perform certain actions.
Hardware
Indicates a hardware-related issue and is used as a broad bucket for hardware/BMC alerts.
SensorWarning
Indicates that a sensor reading violated a caution/warning threshold.
In carbide-hardware-health, this corresponds to crossing lower_caution/upper_caution thresholds.
SensorCritical
Indicates that a sensor reading violated a critical threshold.
In carbide-hardware-health, this corresponds to crossing lower_critical/upper_critical thresholds.
SensorFailure
Indicates that a sensor reading is outside the advertised valid range.
In carbide-hardware-health, this corresponds to values outside range_min/range_max when that range is well-formed.
For BmcSensor alerts, severity is evaluated in this order:
SensorFailure -> SensorCritical -> SensorWarning.
Special case for sensor classifications:
if thresholds indicate warning/critical/failure but the BMC explicitly reports sensor health as Ok,
the probe is treated as success and no alert classification is emitted.
Key Group Synchronization
Key groups are lists of SSH Keys and groups of them in order to provide access to the SSH console for users.
The key group update and synchronization mechanism in NICo REST API works as follows:
- Key groups are stored per tenant. They can be uniquely identified by the tenant org identifier and a unique key group name that the tenant chooses. Therefore no additional UUID based ID is required.
- The source of truth for the content of key groups is stored in the NICo REST API.
- Key groups are versioned. Whenever a key group is modified by a user (key added or removed), a version field for the group is changed to a unique new value. Usage of the same version format that NICo entities already use (e.g.
V1-T1666644937952267makes sense, but is not strictly necessary). - The NICo REST API backend synchronizes the contents of the key groups to all NICo sites that the tenant selected (or potentially even just all sites that the tenant is enabled for).
- The NICo REST API stores for each Site/Tenant/KeyGroupName combination, which version is already stored on a site. By having this information available, the NICo REST API can efficiently look up whether key groups have been synced to required destinations by comparing the most recent key group version (owned by the cloud) with the synchronized key group version.
- After a NICo Tenant changed the contents of a key group in the NICo REST API, the Cloud needs to update all target sites with the latest state. There are multiple approaches for this:
- The NICo Tenant explicitly triggers the sync via UI. Triggering the sync will let the Cloud Backend compare the latest deployed state of a keygroup on one site with the version in the Cloud database, and update it if required. This approach is not required because it requires the NICo tenant to monitor the deployment status on all sites.
- The NICo REST API periodically syncs the state of all Key Groups to all sites. It can iterate over all the gropus it has knowledge about and all sites, and update the group contents for sites where there is a mismatch. This requires some extra work for groups where no content changes occurred, but is otherwise fairly straightforward to implement and free from race conditions.
- NICo REST API only schedules updates for key groups if the NICo Tenant updated the state of a group. This is a bit more efficient, but harder to cover all edge-cases. E.g. the Cloud needs to account for
- sites being temporarily offline during the sync
- sites being restored from backups and having outdated keygroup versions or missing keygroups
- users triggering multiple keygroup updates in rapid succession
- NICo provides the ability to fully overwrite the content of a keygroup that is identified by a
(TenantOrg, GroupName)tuple and indexed by aVersion. It will echo the version of a keygroup as is back to the Cloud, and not change it by itself or interpret it in any way. - The NICo REST API could expose the version number of key groups to users - however it does not have to. By exposing the version number, it can provide update APIs with
ifVersionNotMatchsemantics - which means adding the capability for UIs to fail changes to groups if a concurrent edit occurred. This avoids Forge Tenant Admins from accidentally overwriting changes that another Tenant Admin for the same org performed.
sequenceDiagram
    participant U as NICo Tenant TenantY
    participant C as NICo REST API
    participant S as NICo Site SiteA
    U->>C: CreateKeyGroup(name="MyKeys")
    C->>U: KeyGroupCreationResult(Group {name="MyKeys", keys=[], version=V1-T1666644937952267})

    opt Trigger Sync of KeyGroup
        C->>S: CreateKeyGroup(tenant="TenantY", name="mykeys", version=V1-T1666644937952267)
    end

    Note over U, C: Adding the first keys

    U->>C: UpdateKeyGroup(name="MyKeys", content="[Key1, Key2]")
    C-->C: Schedule Sync of keys to all sites or affected sites
    C->>U: UpdateKeyGroupResult(Group {name="MyKeys", keys=[Key1, Key2], version=V2-T1666644937952400})

    U->>C: GetKeyGroups()
    C->>U: KeyGroups([name="MyKeys", keys=[Key1, Key2], sync=Pending])

    Note over C, S: Background Sync. Triggered periodically and/or after updates
    C->>S: FindKeyGroups(tenant="TenantY")
    S->>C: KeyGroups([])
    C->>S: UpdateKeyGroup(tenant="TenantY", name="mykeys", version=V2-T1666644937952400, keys=[Key1, Key2])
    S->>C: UpdateKeyGroupResult
    C-->C: RecordKeyGroupVersion(site="SiteA", tenant="TenantY", name="MyKeys", version="V2-T1666644937952400")

    Note over U,C: After the sync had been performed, the Cloud knows that the key group version on the site matches the latest revision in the Cloud

    U->>C: GetKeyGroups()
    C->>U: KeyGroups([name="MyKeys", keys=[Key1, Key2], sync=Done])

    Note over U, C: Adding the more keys

    U->>C: UpdateKeyGroup(name="MyKeys", content="[Key1, Key2, Key3]", ifVersionMatch="V2-T1666644937952400")
    C-->C: Schedule Sync of keys to all sites or affected sites
    C->>U: UpdateKeyGroupResult(Group {name="MyKeys", keys=[Key1, Key2, Key3], version=V3-T1666644937952600})

    Note over C,S: Background Sync
    C->>S: FindKeyGroups(tenant="TenantY")
    S->>C: KeyGroups([{name="MyKeys", content="[Key1, Key2]", version="V2-T1666644937952400"}])
    C-->C: Determines an update is required
    C->>S: UpdateKeyGroup(tenant="TenantY", name="mykeys", version=V3-T1666644937952600, keys=[Key1, Key2, Key3])
    S->>C: UpdateKeyGroupResult
    C-->C: RecordKeyGroupVersion(site="SiteA", tenant="TenantY", name="MyKeys", version="V3-T1666644937952600")

    Note over U,C: Next query for key group status will know that the site has applied the latest version
Infiniband NIC and port selection
NCX Infra Controller (NICo) supports multiple Infiniband enabled Network Interface Cards (NICs). Each of those NICs might feature 1-2 physical ports, where each port allows to connect the NIC to an Infiniband switch that is part of a certain Infiniband fabric.
This document describes how NICo enumerates available NICs and how it makes them available for selection by a tenant during instance creation.
Requirements
- Hosts with the identical hardware configuration should be reported by NICo as having the exact same machine capabilities. E.g. a Machine having 2 Infiniband NICs that each have 2 ports that are connected to different Infiniband fabrics (4 fabrics in total), should be exactly reported as such.
- If NICo tenants configure multiple hosts of the same instance type with the same infiniband configuration and run the same operating system, they should find exactly the exact same device names on the host. This allows them to e.g. statically use certain Infiniband devices in applications and containers without a need for complex run-time enumeration on the tenant side. E.g. a tenant should be able to rely on the devices
ibp202s0f0andibp202s0f1always being available and connected their desired configuration.
Recommendation
Each port of all supported Infiniband NICs is reported as a separate PCI device. This makes those ports individually controllable and thereby mostly indistinguishable from a different physical NIC. E.g. an infiniband capable ConnectX-6 NIC shows up on a Linux host as the following 2 devices:
ubuntu@alpha:~$ lspci -v | grep Mellanox
ca:00.0 Infiniband controller: Mellanox Technologies MT28908 Family [ConnectX-6]
        Subsystem: Mellanox Technologies MT28908 Family [ConnectX-6]
ca:00.1 Infiniband controller: Mellanox Technologies MT28908 Family [ConnectX-6]
        Subsystem: Mellanox Technologies MT28908 Family [ConnectX-6]
Both show up as 2 independent infiniband devices:
ls /sys/class/infiniband
ibp202s0f0  ibp202s0f1
This setup is mostly equivalent to a setup with 2 single-port Infiniband NICs. Therefore we seem to have 2 options for presenting multi-port NICs to NICo users:
- Preferred: Present each physical port of a NIC as a separate Infiniband NIC. The combination of a NIC & port is referred to as
device. - Present a multi-port NIC as single NIC with multiple ports.
Option 1) is preferred because it simplifies the NICo data model and user experience: Users don't have to worry about 2 dimensions (NIC and port) when selecting an interface they want to configure - they only have to select a device. The fact that this interface is really a part of a hardware component that features 2 interfaces does not matter for the user workflows, where they want to use the infiniband device to send or receive data.
Various NICo user APIs can therefore by simplified to a point where no port information is required to be entered or shown. E.g. during Instance creation, the infiniband interface network configuration object only requires to pass a network device ID and no longer a port. In a similar fashion, the NICo internal data models for storing hardware information about infiniband devices can be simplified by dropping port data.
How are the devices still related?
While the devices for the 2 ports seem mostly independent, there are still a few areas where they behave different than 2 independent cards:
-
Both devices report the same serial number.
-
The Mellanox firmware tools (
mlxconfig,mst) show only a single device. E.g.MST devices: ------------ /dev/mst/mt4123_pciconf0 - PCI configuration cycles access. domain:bus:dev.fn=0000:ca:00.0 addr.reg=88 data.reg=92 cr_bar.gw_offset=-1 Chip revision is: 00This breaks the illusion of 2 independent devices. Since the tenant can install and use those tools without the availability of a NIC firmware lockdown, they are be able to inspect these properties. There however doesn't seem to be an obvious problem with it.
-
Due to 2), the port configurations for both ports are performed by manipulating a single device object in the Mellanox Firmware tools. E.g. both of the following commands
mlxconfig -d /dev/mst/mt4123_pciconf0 set LINK_TYPE_P1=2 LINK_TYPE_P2=2
mlxconfig -d /dev/mst/mt4123_pciconf0.1 set LINK_TYPE_P1=2 LINK_TYPE_P2=2
reconfigure both ports of a physical card from ethernet to infiniband, independent of whether the target device is the first port (
/dev/mst/mt4123_pciconf0or 2nd port/dev/mst/mt4123_pciconf0.1).The same applies also for settings like
NUM_OF_VFSandSRIOV_EN.
None of those reasons seem blockers for representing the ports as separate devices for NICo users: Since NICo configures the device for tenants, they do not need to worry about the physical properties and can just use the independent devices.
Required changes
NICo machine hardware enumeration
When NICo discovers a machine that is intended to be managed by the NICo site controller, it enumerates its hardware details using the forge-scout tool.
The tool reports all discovered hardware information (e.g. the number and type of CPUs, GPUs, and network interfaces), and this information gets persisted in the NICo database.
The reported information includes the list of Infiniband network interfaces. The site controller needs the information to decide whether a certain Infiniband configuration is valid for a Machine.
The NICo DiscoveryData model for Infiniband that is defined as follows almost supports the preferred model:
message InfinibandInterface {
  PciDeviceProperties pci_properties = 1;
  string guid = 2;
}

message PciDeviceProperties{
  string vendor = 1;
  string device = 2;
  string path = 3;
  sint32 numa_node = 4;
  optional string description = 5;
}
In this model, every port of an Infiniband NIC already shows up as a separate network device. E.g. a dual port ConnectX-6 NIC gets reported as:
[
    {
        "guid": "1234",
        "pci_properties": {
            "path": "/devices/pci0000:c9/0000:c9:02.0/0000:ca:00.0/net/ibp202s0f0",
            "device": "0x101b",
            "vendor": "0x15b3",
            "numa_node": 1,
            "description": "MT28908 Family [ConnectX-6]"
        }
    },
    {
        "guid": "5678",
        "pci_properties": {
            "path": "/devices/pci0000:c9/0000:c9:02.0/0000:ca:00.1/net/ibp202s0f1",
            "device": "0x101b",
            "vendor": "0x15b3",
            "numa_node": 1,
            "description": "MT28908 Family [ConnectX-6]"
        }
    }
]
There however seem to be aspects that we can improve on:
- The device and vendor names are passed as identifiers. If Tenants would want to
use the same information to configure infiniband on an instance, the API calls
to do that would contain the same non-descriptive data: Configure the first
Infiniband interface of type
vendor: 0x15b3anddevice: 0x101b. If we would use those fields to directly report the stringified versions, both the hardware report and the interface selection become more obvious to the user. We could also transmit both the IDs and the names. But as long as the IDs are not referenced in any other NICo APIs they do not seem too useful. - The device path is very OS and driver specific. A different path is reported
depending on which of the various Mellanox drivers the NICo discovery image uses.
We are be able to have more stable information by just persisting the PCI slot - either
in the existing
pathfield or a newslotfield. - For multi-fabric support, we would include the identifier of the fabric that the device is connected to. This field can be empty in the MVP which supports only a single fabric. An empty field would always reference the default Infiniband fabric.
- The
deviceis referred to asinterfacein the discovery data API, which is inconsistent with the remaining terminology. We can renameInfinibandInterfacetoInfinibandDevice, andinfiniband_interfacestoinfiniband_devices.
With these changes, the submitted discovery information for the dual port NIC is:
[
    {
        "guid": "1234",
        "fabric": "IbFabric1",
        "pci_properties": {
            "slot": "0000:ca:00.0",
            "vendor": "Mellanox Technologies",
            "device": "MT28908 Family [ConnectX-6]",
            "numa_node": 1,
            "description": "TBD (not strictly required)"
        }
    },
    {
        "guid": "5678",
        "fabric": "IbFabric2",
        "pci_properties": {
            "slot": "0000:ca:00.1",
            "vendor": "Mellanox Technologies",
            "device": "MT28908 Family [ConnectX-6]",
            "numa_node": 1,
            "description": "TBD (not strictly required)"
        }
    }
]
Instance Type hardware capabilities
The NICo cloud backend currently displays Machine hardware details with slightly less granularity than the site APIs. It uses a "Machine Capability" model that tries to model how many components of a particular type a Machine includes. This model reduces the amount of data that needs to be transferred between the Rest API backend and NICo users since it doesn't need to explain every individual component in detail. It also has the advantage that "machine capabilities" can describe groups of similar machines ("instance types") instead of just a single machine. Each machine the that adheres to an instance type shares the same capabilities.
To support Infiniband, we can extend the existing capabilities model of the NICo REST API backend to cover infiniband:
- Each Infiniband
devicewill be represented by a capability that describes the device. - The
typefield that is used for Infiniband devices would beInfiniband. - The
namefield is the device name. The vendor can optionally be stored a separatevendorfield. Alternatively thenamefield could store the concatenation ofvendorand the devicename. However since some APIs might just require the name, keeping the information separate seems clearer. - Every physical port of an Infiniband NIC would be shown as one separate
device (
count: 1). - For multi-fabric support, each entry would also be annotated with the
fabricthat the port is connected to. - Virtual Functions (VF)s are not presented in this list of hardware capabilities, since their existence can be controlled by configuring the associated Physical Function (PF).
- Hardware details like PCI slots and hardware GUIDs are not shown in this model. Since they could be different from Machine to Machine, they they can not be used in the data model that is shared across a range of Machines.
[
    {
        "type": "Infiniband",
        "name": "MT28908 Family [ConnectX-6]",
        "vendor": "Mellanox Technologies",
        "count": 1,
        "fabric": "IbFabric1",
    },
    {
        "type": "Infiniband",
        "name": "MT28908 Family [ConnectX-6]",
        "vendor": "Mellanox Technologies",
        "count": 1,
        "fabric": "IbFabric2",
    }
]
If both ports of the dual port NIC would be connected to the same fabric, the NIC would be represented as a single entry:
[
    {
        "type": "Infiniband",
        "name": "MT28908 Family [ConnectX-6]",
        "vendor": "Mellanox Technologies",
        "count": 2,
        "fabric": "IbFabric1",
    }
]
Alternative: If we would merge the device vendor and name fields, the entry would become:
[
    {
        "type": "Infiniband",
        "name": "Mellanox Technologies MT28908 Family [ConnectX-6]",
        "count": 2,
        "fabric": "IbFabric1",
    }
]
Instance creation APIs
When tenants create instances, they need to pass configuration that describes how Infiniband interfaces on the new instance get configured.
For instance types that feature multiple devices, the tenant needs to select which device to utilize. This is especially important in cases where the ports of NICs are connected to different fabrics.
An important aspect of instance configuration APIs is that they are decoupled from the actual hardware. This allows configurations to be shared between all instances of the same instance type. And it allows hardware (like an actual NIC) to be replaced at runtime without changing the configuration objects. Therefore the tenant facing configurations do not contain machine-specific identifiers like a serial-number, MAC address or GUID on it. The tenant instead selects the device via attributes that are common between all machines of the same instance type.
Due to these constraints, we allow the tenant to select a device via
the following configuration object of type InstanceInfinibandConfig:
{
    "ib_interfaces": [{
        // The first 3 parameters select the physical PCI device
        "device": "MT28908 Family [ConnectX-6]",
        "fabric": "IbFabric1",
        // Specifies that the n-th instance of the device will be used by this interface.
        // In this example the first ConnectX-6 NIC&port that utilizes
        // fabric "IbFabric1" will be configured.
        "device_instance": 0,

        // Select the PF or a specific VF. If a VF is required, the parameter
        // `virtual_function_id` also needs to be supplied
        "function_type": "PhysicalFunction",

        // Configures the partition this interface gets attached to
        "ib_partition_id": "some_partition_identifier",
    }, {
        "device": "MT28908 Family [ConnectX-6]",
        "fabric": "IbFabric1",
        "device_instance": 1,

        "function_type": "VirtualFunction",
        "virtual_function_id": 0,

        "ib_partition_id": "some_other_partition_identifier",
    }]
}
In this model, the device field references a particular Infiniband PCI device that
is reported in the name field of the Infiniband capability. It is used along with the fabric
attribute to select a device combination that is suitable for the purpose of
the tenant.
A capability that describes that a host supports multiple Infiniband devices
of the same model, attached to the same fabric (e.g. via count: 2) requires the
tenant needs to select via device_instance which particular instance of the device needs
to be configured.
The parameters device, fabric and device_instance always select the
physical PCI device (PhysicalFunction). A tenant uses the 2 additional parameters
function_type and virtual_function_id to configure a device that makes use of
a VirtualFunction on top of the selected PhysicalFunction.
Device vendor
The API described above fully omits the device vendor as a selection criteria.
This would make selection ambiguous in case a Machine would feature devices with the
same name but produced by different vendors.
Given all known devices that NICo will support initially are produced by Mellanox/NVIDIA,
this is however not an issue in the foreseeable future.
In case such a setup ever needs to be supported, an optional device_vendor field
could be added for each entry of InstanceInfinibandConfig to disambiguate the
target device in case of conflicts:
{
    "ib_interfaces": [{
        "device": "Ambiguous Device",
        "vendor": "VendorA",
        "fabric": "IbFabric1",
        "device_instance": 0,
        "function_type": "PhysicalFunction",
        "virtual_function_id": 0,
        "ib_partition_id": "some_partition_identifier",
    }, {
        "device": "Ambiguous Device",
        "vendor": "VendorB",
        "fabric": "IbFabric1",
        "device_instance": 0,
        "function_type": "PhysicalFunction",
        "virtual_function_id": 0,
        "ib_partition_id": "some_other_partition_identifier",
    }]
}
The Web UI can combine all the necessary information into a single combo-box. E.g. it could show a combo box with the following content:
 +-----------------------------------------------------------------------+
 | Select Device                                                         |
 +-----------------------------------------------------------------------+
 | [IbFabric1]: Mellanox Technologies MT28908 Family [ConnectX-6] - Nr 0 |
 | [IbFabric1]: Mellanox Technologies MT28908 Family [ConnectX-6] - Nr 1 |
 +-----------------------------------------------------------------------+
This single selector would provide all the information that all layers need to configure the interface according to user requirements.
Mapping from Tenant Configuration to actual hardware interfaces
If a tenant selects a network interface, we need to be able to uniquely map the interface to a specific hardware interface.
E.g. this instance configuration request:
{
    "device": "MT28908 Family [ConnectX-6]",
    "fabric": "IbFabric1",
    "device_instance": 1,
}
needs to map to the following hardware interface information:
{
    "guid": "1234",
    "fabric": "IbFabric1",
    "pci_properties": {
        "slot": "0000:ca:00.0",
        "vendor": "Mellanox Technologies",
        "device": "MT28908 Family [ConnectX-6]",
        "numa_node": 1,
        "description": "TBD (not strictly required)"
    }
}
The fabric is directly copied, and the model fields map
to the device fields. The vendor field can be resolved by looking for any
device with the specified device name.
Thereby the only challenge is how to map instance in an non ambiguous fashion.
We can achieve this by sorting the interfaces based on the PCI slot,
and pick the N-th slot that satisfies the criteria.
Example 2:
Assuming the following hardware information is available:
[{
    "guid": "1234",
    "fabric": "IbFabric1",
    "pci_properties": {
        "slot": "0000:cb:00.0",
        "vendor": "Mellanox Technologies",
        "device": "MT28908 Family [ConnectX-6]"
    }
},{
    "guid": "2345",
    "fabric": "IbFabric2",
    "pci_properties": {
        "slot": "0000:cd:00.0",
        "vendor": "Mellanox Technologies",
        "device": "MT28908 Family [ConnectX-6]"
    }
},{
    "guid": "3456",
    "fabric": "IbFabric1",
    "pci_properties": {
        "slot": "0000:ea:00.0",
        "vendor": "Mellanox Technologies",
        "device": "MT28908 Family [ConnectX-6]"
    }
},{
    "guid": "4567",
    "fabric": "IbFabric2",
    "pci_properties": {
        "slot": "0000:eb:00.0",
        "vendor": "Mellanox Technologies",
        "device": "MT28908 Family [ConnectX-6]"
    }
}]
In this example a selection of
{device: "Mellanox ... MT28908 ...", fabric: "IbFabric1", device_instance: 0}would select the interface with GUID1234.{device: "Mellanox ... MT28908 ...", fabric: "IbFabric1", device_instance: 1}would select the interface with GUID3456.{device: "Mellanox ... MT28908 ...", fabric: "IbFabric2", device_instance: 0}would select the interface with GUID2345.{device: "Mellanox ... MT28908 ...", fabric: "IbFabric2", device_instance: 1}would select the interface with GUID4567.
An alternative seems to be to sort the interfaces by hardware guid instead of
PCI slot. The downside of this mapping is that it won't be stable
across machines of the same instance type. E.g. the selection in our example
might sometimes select a device in slot 4 and sometimes a device in slot 5 in case the
GUIDs are different. Since the PCI slots are assumed to be deterministic
for Machines with the same hardware configuration, tenants can assume their selection
always affects the exact same piece of hardware.
Forge Metadata Service (FMDS)
This will be renamed to something else (likely just NICo Metadata Service as we move from the old code name
The Forge Metadata Service (FMDS) provides the Tenant's software running on instance the capability to identify the infiniband configuration at runtime. It also provides the ability to execute a configuration script which configures the local Infiniband interfaces for the operating mode that the Tenant desired for this instance. This script needs to configure all network interfaces on the host. This includes
- setting the correct number of VFs per physical device
- writing GUIDs that NICo allocated for VF interfaces to the locations the OS expects them it
Applying these settings configure the interfaces in software in a way that allows them to send their traffic successfully to the connected Infiniband switches.
To perform this job, FMDS returns the applied instance configuration -
which is the desired InstanceInfinibandConfig plus the configuration data that
Forge allocates on behalf the tenant. This would be mostly the GUIDs.
Putting it together, the tenant machine would retrieve the following data via FMDS, in a format that is still TBD:
{
    "config": {
        "infiniband": {
            "ib_interfaces": [{
                // Selects the device (NIC and Port)
                "device": "MT28908 Family [ConnectX-6]",
                "fabric": "IbFabric1",
                "device_instance": 0,

                // Select the PF or a specific VF
                "function_type": "VirtualFunction",
                "virtual_function_id": 0,

                // Configures the partition this interface gets attached to
                "ib_partition_id": "some_partition_identifier",
            }]
        }
    },
    "status": {
        "infiniband": {
            "ib_interfaces": [{
                "guid": "1234",
                "lid": 123,
                "addresses": ["5.6.7.8", "::8:1:3:4:5"]
            }]
        }
    }
}
The FMDS client needs to perform the mapping from configuration
parameters to the actual Linux devicename (in /sys/class/infiniband) to apply
the necessary configuration. This requires the same knowledege about
the unique mapping of the configuration to the actual hardware that is residing
in NICo. A challenge here is however that the client running
on a tenants host is not able to resolve the fabric per interface. Since
the fabric is one part of the mapping in a multi-fabric context, the mapping would
no longer be unambiguous. An alternative to this is to extend
status.infiniband.ib_interfaces in a way that allows the software on the tenant
host to easier lookup the necessary device. E.g. we would return the hardware
guid of the associated physical function in every interface. Along:
{
    "status": {
        "infiniband": {
            "ib_interfaces": [{
                "pf_guid": "1234",
                "guid": "1234",
                "lid": 123,
                "addresses": ["5.6.7.8", "::8:1:3:4:5"]
            }, {
                "pf_guid": "1234",
                "guid": "3457",
                "lid": 124,
                "addresses": ["5.6.7.9", "::8:1:3:4:56"]
            }]
        }
    }
}
Alternatives considered
Interface configuration via unique PCI address (device_slot)
The APIs described above make it slightly ambigiuos which device (in terms of
PCI slot) a tenant would use for an interface. They tenant specifies the following
in an instance creation request
{
    "device": "MT28908 Family [ConnectX-6]",
    "fabric": "IbFabric1",
    "device_instance": 2,
    "ib_partition_id": "partition_a"
}
and the system would look up what PCI address device_instance: 2 refers to.
This mapping might not be obvious in a system which features multiple NICs with
one or multiple ports, and each of them connected to a mix of fabrics.
E.g. a tenant could be surprised that device_instance can have the
same value for 2 devices that utilize a different fabric, since the index is
per device & fabric combination. E.g. the following configuration is valid:
[{
    "device": "MT28908 Family [ConnectX-6]",
    "fabric": "IbFabric1",
    "device_instance": 1,
    "ib_partition_id": "Partition_A"

},
{
    "device": "MT28908 Family [ConnectX-6]",
    "fabric": "IbFabric2",
    "device_instance": 1,
    "ib_partition_id": "Partition_B"
}]
It would select the 2nd device of type ConnectX-6 that is connected to IbFabric1
and configure it to use partition Partition_A. Whereas the 2nd device of type
ConnectX-6 that is connected to IbFabric2`` will use partition Partition_B`.
To avoid this concern, we can move towards an API which uses the unique PCI address/slot for instance creation. In this model, a tenant would configure the instance with the following request
{
    "ib_interfaces": [{
        // This single parameters selects the device (NIC, Port and thereby Fabric)
        "device_slot": "0000:ca:00.0",

        // Select the PF or a specific VF. If a VF is required, the parameter
        // `virtual_function_id` also needs to be supplied
        "function_type": "PhysicalFunction",

        // Configures the partition this interface gets attached to
        "ib_partition_id": "some_partition_identifier",
    }, {
        "device_slot": "0000:ca:00.1",

        "function_type": "VirtualFunction",
        "virtual_function_id": 0,

        "ib_partition_id": "some_other_partition_identifier",
    }]
}
The hardware inventory data model already provides the slot address. Therefore
no additional changes are required here.
However the machine capability model needs to be extended to include the slot
information, since it is used by the NICo Admin UI to explain the tenant what devices
can be configured. E.g. the reported machine capability data could be:
[
    {
        "type": "Infiniband",
        "name": "MT28908 Family [ConnectX-6]",
        "vendor": "Mellanox Technologies",
        "count": 1,
        "fabric": "IbFabric1",
        "slot": "0000:ca:00.0"
    },
    {
        "type": "Infiniband",
        "name": "MT28908 Family [ConnectX-6]",
        "vendor": "Mellanox Technologies",
        "count": 1,
        "fabric": "IbFabric2",
        "slot": "0000:ca:00.1"
    }
]
Since the slot is unique per device, the count field could never be anything
different than 1 for Infiniband capabilities.
Downsides of the device_slot based API
The device_slot based API is not preferred, because it makes it harder for API
users to spin up an instance without an excessive amount of "prior knowledge".
In the recommended model tenants that require to configure a single Infiniband
Interface will likely just need to specify the device name which is well known
(e.g. MT28908 Family [ConnectX-6]). The fabric field might not need to be specified
since it would be the site default, and the device_instance could simply be 0.
This simplicity would remain even if machine contains multiple devices that are connected to the same fabric, and where the tenant wants to configure all of them.
The advantages of the device_slot based APIs would only show up in complex
deployments with multiple NICs and multiple Fabrics.
Another downside is that the device_slot based API strictly requires the
PCI slot addresses to be consistent between all machines of a certain instance type.
The preferred model can support different PCI slot addresses to the extent that
instance creation and configuration would still work as expected.
Other considerations
Terminology
A variety of different terms had been used to reference "things to send/receive infiniband traffic":
- Network Interface Cards (NICs)
- Network Adapters
- Host Channel Adapters (HCAs)
- Devices
- Interfaces
Each of those terms is sometimes used to reference to a full Infiniband card that might provide more than 1 port, to just a single port on the card, or even to a purely virtual output that is provided by the card (a VF).
To avoid confusion, The APIs presented in this document are consistently using the following terms with meanings defined as follows:
Devices
- A
deviceis a physical PCI device which can be used to send and receive Infiniband traffic. - The operating system of a Tenants host shows each device separately. E.g.
on Linux, each
deviceshows up under/sys/class/infiniband/. - A Network Interface Card (NIC) can provide 1 or more
devices. - The "Physical Function" (PF) of each PCI device leads to a
devicebeing made available. Besides that the usage of "Virtual Functions" (VFs) allows to configure additionaldevices that share the same hardware.
Interfaces
An interface represents a device that is configured towards a certain purpose.
For example a tenant can configure the first device of a certain type on their
host to be connected to Partition A, and the second device to Partition B.
Therefore, BB refers to interfaces when in instance configuration APIs and
when providing status information about running instances.
Open questions
- Should NICo documentation settle on a specific term to reference a full NIC?
E.g.
NICorAdapter? It might be necessary in order to explain workflows for tools which do only show the complete NIC and not individual devices (e.g.mlxconfig)
Numa Node awareness
We discussed a bit on whether the NUMA node that a device is connected to should be exposed to the user, or whether a tenant should even be able to select a device by NUMA node. This would help the tenant to achieve better locality between the device and a connected GPU for some applications.
While this seems like an interesting feature, it would also complicate the APIs even more by introducing yet another selector.
Even without introducing NUMA awareness on the API layer, tenants should be
able to achieve the same goal by exploiting the fact that the device mapping is
equivalent for all machines of an instance type: The Tenant can create a
test instance, and determine based on introspection of this particular instance
whether they have a suitable device configuration. They can modify the interface
selection (via instance) until they achieve their ideally desired configuration.
Once they have found the desired configuration, they would be able to carry it
over to other instances using the exact same configuration.
Managed Host State Diagrams
This document contains the complete Finite State Machine (FSM) that illustrates the lifecycle of NICo managed hosts from discovery through ingestion through instance assignment and management.
High-Level Overview
The main flow shows the primary states and transitions between them:

DPU Discovery State Details (DpuDiscoveringState)
Shows the complete DPU discovery and configuration process:

DPU Initialization State Details (DpuInitState)
Shows DPU initialization including BFB installation:

Host Initialization State Details (HostInitState)
Shows host initialization including boot order and UEFI setup:

BOM Validation State Details (BomValidating)
Shows the BOM (Bill of Materials) validation process:

Machine Validation State Details (ValidationState)
Shows the machine validation process:

Ready State Details (Ready)
Shows what can happen in Ready state:

Instance Assignment State Details (InstanceState)
Shows the complete instance assignment and management flow:

Host Reprovision State Details (HostReprovisionState)
Shows the host firmware reprovision process:

DPU Reprovision State Details (DpuReprovisionState)
Shows the DPU firmware reprovision process:

WaitingForCleanup State Details

Measuring and PostAssignedMeasuring State Details
Shows the attestation measurement process.

Failed State

Switch State Diagram
This document describes the Finite State Machine (FSM) for Switches in Carbide: lifecycle from creation through configuration, validation, ready, optional reprovisioning, and deletion.
High-Level Overview
The main flow shows the primary states and transitions:

States
| State | Description |
|---|---|
| Created | Switch record exists in Carbide; awaiting first controller tick. |
| Initializing | Controller waits for expected switch NVOS MAC associations. Sub-state: WaitForOsMachineInterface. |
| Configuring | Switch is being configured (rotate OS password). Sub-state: RotateOsPassword. |
| Validating | Switch is being validated. Sub-state: ValidationComplete. |
| BomValidating | BOM (Bill of Materials) validation. Sub-state: BomValidationComplete. |
| Ready | Switch is ready for use. From here it can be deleted, or reprovisioning can be requested. |
| ReProvisioning | Reprovisioning (e.g. firmware update) in progress. Sub-states: Start, WaitFirmwareUpdateCompletion. Completion is driven by firmware_upgrade_status (Completed → Ready, Failed → Error). |
| Error | Switch is in error (e.g. firmware upgrade failed or NVOS MAC conflict). Can transition to Deleting if marked for deletion; otherwise waits for manual intervention or ReProvisioning to take machine out of Error |
| Deleting | Switch is being removed; ends in final delete (terminal). |
Transitions (by trigger)
| From | To | Trigger / Condition |
|---|---|---|
| (create) | Created | Switch created |
| Created | Initializing (WaitForOsMachineInterface) | Controller processes switch |
| Initializing (WaitForOsMachineInterface) | Configuring (RotateOsPassword) | All NVOS interfaces associated for expected switch |
| Initializing (WaitForOsMachineInterface) | Error | Expected switch has empty nvos_mac_addresses or MAC owned by another switch |
| Configuring (RotateOsPassword) | Validating (ValidationComplete) | OS password rotated |
| Validating (ValidationComplete) | BomValidating (BomValidationComplete) | Validation complete |
| BomValidating (BomValidationComplete) | Ready | BOM validation complete |
| Ready | Deleting | deleted set (marked for deletion) |
| Ready | ReProvisioning (Start) | switch_reprovisioning_requested is set |
| ReProvisioning (Start) | ReProvisioning (WaitFirmwareUpdateCompletion) | Reprovision triggered |
| ReProvisioning (WaitFirmwareUpdateCompletion) | Ready | firmware_upgrade_status == Completed |
| ReProvisioning (WaitFirmwareUpdateCompletion) | Error | firmware_upgrade_status == Failed { cause } |
| Error | Deleting | deleted set (marked for deletion) |
| Deleting | (end) | Final delete committed |
Implementation
- State type:
SwitchControllerStateincrates/api-model/src/switch/mod.rs. - Handlers:
crates/api/src/state_controller/switch/— one module per top-level state (created,initializing,configuring,validating,bom_validating,ready,reprovisioning,error_state,deleting). - Orchestration:
SwitchStateHandlerinhandler.rsdelegates to the handler for the currentcontroller_state.
Site Setup Guide
This page outlines the software dependencies for a Kubernetes-based install of NCX Infra Controller (NICo). It includes the validated baseline of software dependencies, as well as the order of operations for site bringup, including what you must configure if you already operate some of the common services yourself.
Important Notes
-
All unknown values that you must supply contain explicit placeholders like
<REPLACE_ME>. -
If you already run one of the core services (e.g. PostgreSQL, Vault, cert‑manager, Temporal), follow the If you already have this service checklist for that service.
-
If you don't already have a core service, deploy the Reference version (images and versions below) and apply the configuration under If you deploy the reference version.
Validated Baseline
This section lists all software dependencies, including the versions validated for this release of NICo.
Kubernetes and Node Runtime
-
Control plane: Kubernetes v1.30.4 (server)
-
Nodes: kubelet v1.26.15, container runtime containerd 1.7.1
-
CNI: Calico v3.28.1 (node & controllers)
-
OS: Ubuntu 24.04.1 LTS
Networking
-
Ingress: Project Contour v1.25.2 (controller) + Envoy v1.26.4 (daemonset)
-
Load balancer: MetalLB v0.14.5 (controller and speaker)
Secret and Certificate Plumbing
-
External Secret Management System: External Secrets Operator v0.8.6
-
Certificate Manager: cert‑manager v1.11.1 (controller/webhook/CA‑injector)
- Approver‑policy v0.6.3 (Pods present as cert-manager, cainjector, webhook, and policy controller.)
State and Identity
-
PostgreSQL: Zalando Postgres Operator v1.10.1 + Spilo‑15 image 3.0‑p1 (Postgres 15)
-
Vault: Vault server v1.14.0, vault‑k8s injector v1.2.1
Temporal and Search
-
Temporal server: Temporal Server v1.22.6 (frontend/history/matching/worker)
- Admin tools v1.22.4, UI v2.16.2
-
Temporal visibility: Elasticsearch 7.17.3
Monitoring and Telemetry (OPTIONAL)
These components are not required for NICo setup, but are recommended site metrics.
-
Monitoring System: Prometheus Operator v0.68.0; Prometheus v2.47.0; Alertmanager v0.26.0
-
Monitoring Platform: Grafana v10.1.2; kube‑state‑metrics v2.10.0
-
Telemetry Processing: OpenTelemetry Collector v0.102.1
-
Log aggregator: Loki v2.8.4
-
Host Monitoring Node exporter v1.6.1
NICo Components
The following services are installed during the NICo installation process.
-
NICo core (forge‑system)
- nvmetal-carbide:v2025.07.04-rc2-0-8-g077781771 (primary carbide-api, plus supporting workloads)
-
cloud‑api: cloud-api:v0.2.72 (two replicas)
-
cloud‑workflow: cloud-workflow:v0.2.30 (cloud‑worker, site‑worker)
-
cloud‑cert‑manager (credsmgr): cloud-cert-manager:v0.1.16
-
elektra-site-agent: forge-elektra:v2025.06.20-rc1-0
Order of Operations
This section provides a high-level order of operations for installing components:
-
Cluster and networking ready
-
Kubernetes, containerd, and Calico (or conformant CNI)
-
Ingress controller (Contour/Envoy) + LoadBalancer (MetalLB or cloud LB)
-
DNS recursive resolvers and NTP available
-
-
Foundation services (in the following order)
-
External Secrets Operator (ESO) - Optional
-
cert‑manager: Issuers/ClusterIssuers in place
-
PostgreSQL: DB/role/extension prerequisites below
-
Vault: PKI engine, K8s auth, policies/paths
-
Temporal: server up; register namespaces
-
-
Carbide core (forge‑system)
- carbide-api and supporting services (DHCP/PXE/DNS/NTP as required)
-
Carbide REST components
-
Deploy cloud‑api, cloud‑workflow (cloud‑worker & site‑worker), and cloud‑cert‑manager (credsmgr)
-
Seed DB and register Temporal namespaces (cloud, site, then site UUID)
-
Create OTP and bootstrap secrets for elektra‑site‑agent; roll restart it.
-
-
Monitoring
- Prometheus operator, Grafana, Loki, OTel, node exporter
Installation Steps
This section provides additional details for each set of components that you need, including additional configuration steps if you already have some of the components.
External Secrets Operator (ESO)
Reference version: ghcr.io/external-secrets/external-secrets:v0.8.6
You must provide the following:
-
A SecretStore/ClusterSecretStore pointing at Vault and, if applicable, a Postgres secret namespace.
-
ExternalSecret objects similar to these (namespaces vary by component):
-
forge-roots-eso: Target secretforge-rootswith keyssite-root,forge-root -
DB credentials ExternalSecrets per namespace (e.g
clouddb-db-eso : forge.forge-pg-cluster.credentials)
-
-
Ensure an image pull secret (e.g.
imagepullsecret) exists in the namespaces that pull from your registry.
cert‑manager (TLS and Trust)
Reference versions:
-
Controller/Webhook/CAInjector:
v1.11.1 -
Approver‑policy:
v0.6.3 -
ClusterIssuers present:
self-issuer,site-issuer,vault-issuer,vault-forge-issuer
If you already have cert‑manager:
-
Ensure the version is greater than
v1.11.1. -
Your
ClusterIssuerobjects must be able to issue the following:- Cluster internal certs (service DNS SANs)
- Any externally‑facing FQDNs you choose
-
Approver flows should allow your teams to create Certificate resources for the NVCarbide namespaces.
If you deploy the reference version:
-
Install cert‑manager
v1.11.1andapprover‑policy v0.6.3. -
Create ClusterIssuers matching your PKI:
<ISSUER_NAME>. -
Typical SANs for NVFORGE services include the following:
-
Internal service names (e.g.
carbide-api.<ns>.svc.cluster.local,carbide-api.forge) -
Optional external FQDNs (your chosen domains)
-
Vault (PKI and Secrets)
Reference versions:
-
Vault server:
v1.14.0(HA Raft) -
Vault injector (vault‑k8s):
v1.2.1
If you already have Vault:
-
Enable PKI engine(s) for the root/intermediate CA chain used by NVFORGE components (where your
forge-roots/site-rootare derived). -
Enable K8s auth at path
auth/kubernetesand create roles that map service accounts in the following namespaces:forge-system,cert-manager,cloud-api,cloud-workflow,elektra-site-agent -
Ensure the following policies/paths (indicative):
-
KV v2 for application material:
<VAULT_PATH_PREFIX>/kv/* -
PKI for issuance:
<VAULT_PATH_PREFIX>/pki/*
-
If you deploy the reference version:
-
Stand up Vault 1.14.0 with TLS (server cert for
vault.vault.svc). -
Configure the following environment variables:
-
VAULT_ADDR(cluster‑internal URL, e.g.https://vault.vault.svc:8200orhttp://vault.vault.svc:8200if testing) -
KV mounts and PKI roles. Components expect the following environment variables:
VAULT_PKI_MOUNT_LOCATIONVAULT_KV_MOUNT_LOCATIONVAULT_PKI_ROLE_NAME=forge-cluster
-
-
Injector (optional) may be enabled for sidecar‑based secret injection.
Vault is used by the following components:

-   **carbide‑api** consumes Vault for PKI and secrets (env VAULT\_\*).

-   **credsmgr** interacts with Vault for CA material exposed to the
    site bootstrap flow.
PostgreSQL (DB)
Reference versions:
-
Zalando Postgres Operator:
v1.10.1 -
Spilo‑15 image:
3.0‑p1(Postgres15)
If you already have Postgres
-
Provide a database
<POSTGRES_DB>and role<POSTGRES_USER>with password<POSTGRES_PASSWORD>. -
Enable TLS (recommended) or allow secure network policy between DB and the NVCarbide namespaces.
-
Create extensions (the apps expect these):
CREATE EXTENSION IF NOT EXISTS btree_gin;
CREATE EXTENSION IF NOT EXISTS pg_trgm;
This can be done with a call like the following:
psql "postgres://<POSTGRES_USER>:<POSTGRES_PASSWORD>@<POSTGRES_HOST>:<POSTGRES_PORT>/<POSTGRES_DB>?sslmode=<POSTGRES_SSLMODE>" \ -c 'CREATE EXTENSION IF NOT EXISTS btree_gin;' \ -c 'CREATE EXTENSION IF NOT EXISTS pg_trgm;' -
Make the DSN available to workloads via ESO targets (per‑namespace credentials). These are some examples:
forge.forge-pg-cluster.credentialsforge-system.carbide.forge-pg-cluster.credentialselektra-site-agent.elektra.forge-pg-cluster.credentials
If you deploy the reference version:
-
Deploy the Zalando operator and a Spilo‑15 cluster sized for your SLOs.
-
Expose a ClusterIP service on
5432and surface credentials through ExternalSecrets to each namespace that needs them.
Temporal
Reference versions:
-
Temporal server:
v1.22.6(frontend/history/matching/worker) -
UI:
v2.16.2 -
Admin tools:
v1.22.4 -
Frontend service endpoint (cluster‑internal):
temporal-frontend.temporal.svc:7233
Required namespaces:
-
Base:
cloud,site -
Per‑site: The
<SITE_UUID>
If you already have Temporal
-
Ensure the
frontend gRPC endpointis reachable from NVCarbide workloads and present the propermTLS/CA if you require TLS. -
Register namespaces:
tctl --ns cloud namespace register
tctl --ns site namespace register
tctl --ns <SITE_UUID> namespace register (once you know the site UUID)
If you deploy our reference
-
Deploy Temporal as described above and expose port
:7233. -
Register the same namespaces as described above.
Site Reference Architecture
This page provides guidelines for hardware and configuration for NCX Infra Controller (NICo) managed sites.
Host Hardware Requirements
The section provides a hardware baseline for the two kinds of hosts, the site controller and compute systems.
The site controller and compute systems must be qualified for one dual-port NVIDIA Bluefield DPU with 2 x 200 Gb network interfaces and a 1 Gb network interface for the BMC. The BlueField-3 B3220 P-Series DPU is suitable (200GbE/NDR200 dual-port QSFP112 Network Adaptor (900-9D3B6-00CV-AA0)). Other network interface controllers on the machine are automatically disabled during site software installation.
Site Controller Requirements
- Server class: Any major OEM Gen5 server (e.g. Dell R760-class)
- Number of servers: 3 or 5
- Server configuration:
- CPU: 2× modern x86_64 sockets (Intel Xeon/AMD EPYC), 24 or greater cores per socket
- Memory: 256 GiB RAM (minimum), 512 GiB RAM (recommended)
- Local storage: 4Tb or greater capacity on NVMe SSDs
- OS: 200–500 GiB (UEFI + Secure Boot)
- K8s data: 1 or more TiB NVMe dedicated to container runtime, Kubelet, and logs
- Secure Erase: All local storage drives should support Secure Erase.
- Networking: 1–2x 25/100 GbE ports (dual‑homed or single‑homed) for the site-controller host
- Out‑of‑band: BMC/iDRAC/iLO/XClarity (DHCP or statically addressed)
- Operating system:
- Ubuntu: 24.04 LTS, kernel 6.8+
- Swap: Disabled (or very small), NUMA enabled, virtualization/IOMMU enabled
- TPM: The TPM 2.0 module must be present on the server and enabled in BIOS/UEFI
Compute System Requirements
- Server class: An NVIDIA-certified system, data center classification
- Server Configuration:
- GPU: NVIDIA GB200/GB300 or newer
- Local storage: NVMe drives that support the following:
- Secure Erase
- Firmware update must be possible only with signed firmware images.
- Rollback to previous firmware version must not be possible.
- Operating System:
- TPM: TPM 2.0 and Secure Boot support
- UEFI: UEFI and host BMC should support the ability to prevent in-band host control
- Chassis BMC: Host BMC should provide the following features over Redfish:
- Power control
- Setting boot order
- UEFI control for enabling and disabling secure boot
- IPv6 capability
- Firmware update support
- Serial-over-LAN capability
Note: NICo does not require any cabling or communication between the DPU and the host.
Kubernetes and Runtime
The following versions indicate the tested baseline for the NICo site controller.
- Kubernetes: v1.30.x (tested with 1.30.4)
- CRI: containerd 1.7.x (tested with 1.7.1)
- CNI: Calico backend or equivalent (VXLAN or BGP; choose per network policy/MTU needs)
- Control-plane footprint: 3-node minimum for HA; 5-node control plane recommended for large GB200-class sites (e.g. YTL deployment)
- Time sync: chrony or equivalent, synced to enterprise NTP
- Logging/metrics: Ship system and pod logs off‑host (e.g. to your centralized stack). All logs are collected and shipped using
otel-collector-contrib(Both Site controller and DPU). All Metrics are scraped and shipped using Prometheus (Both Site controller and DPU).
Networking Best Practices
DPUs on Site Controller (Optional)
- DPUs on site controller nodes are optional and site-owned.
- If DPUs are installed, ensure you order the correct DPU power cable from the server vendor.
- For BF3 DPUs, verify link speed and optics: BF3 can run at 200 Gb, so match server/DPU ports to the correct 200 Gb-capable optics, fiber, or DACs.
- For managed hosts where NVIDIA DPUs provide the primary data-plane connectivity, we generally do not add extra ConnectX NICs; a basic onboard NIC for management is sufficient.
Single Uplink, Logical Separation
Use one physical NIC carrying the following:
- Mgmt VLAN: host/SSH/apt/pkg access
- K8s node traffic: API server, Kubelet
- Pod/Service traffic: Overlay or routed
Dual-homed Uplink (Reference Design)
This design requires the DPU to be in DPU mode in site controllers.
- The site controller typically uses a single DPU/NIC with two uplinks, each cabled to a different ToR switch participating in BGP unnumbered.
- Both links carry management and Kubernetes traffic; isolation is done via VLANs/VRFs and policy, not by dedicating one NIC to mgmt and one to the data plane.
General Guidance
- IP addressing: The site owner supplies their subnets/VLANs--do not hardcode the default NICo subnets.
- MTU: Use 1500 for overlays (VXLAN/Geneve). Use 9000 only if the underlay supports it end‑to‑end.
- DNS: Enterprise resolvers; NodeLocal DNS cache is optional.
- Gateway/routing: Static or routed (BGP) per site standards--no dependency on NICo routes.
- Bonding/LACP: Optional for NIC redundancy; otherwise, you can use simple active/standby.
- Firewalling: Allow Kubernetes control-plane and node ports per the chosen CNI, as well as SSH access from a secure management network or jumpbox. Block everything else by default.
IP Address Pools Required
Control plane Management Network
-
Number of IPs required per node:
- With DPU: 3 (host BMC + DPU ARM OS + DPU BMC)
- Without DPU: 1(host BMC)
-
This is the management network for site controller nodes.
-
IP address allocation in this network must be managed by the parent datacenter via DHCP.
-
This network covers the host BMC, plus DPU management (ARM OS and DPU BMC) where DPUs are present.
Control-Plane Network
Addressing per site controller node:
-
When DPUs are used, one
/31between the DPU and host. -
If DPUs are not used, each node requires one IP address.
-
Each SC node uses a
/31point-to-point subnet between the SC OS and the DPU PF representor -
The IPs are allocated statically at the time the OS is installed (and the DPU is configured if present)
Control Plane Service IP Pool
Typically, this is a /27 pool.
This pool is required for the services running on the control plane cluster.
Management Network(s) for Managed Hosts
-
Number of IPs per host: 1 (host BMC) + 2 × the number of DPUs (DPU ARM OS + DPU BMC per DPU)
-
The IP allocation in this network is managed by NICo.
-
The allocation can be split into multiple pools.
-
These subnets must be configured on the out-of-band connected switches, with a DHCP relay configuration pointing to the NICo DHCP service NICo must be informed about them.
DPU Loopback Pool
-
Number of IPs required per DPU: 1
-
This is the DPU loopback address used during DPU networking.
NICo Managed Admin Network
This is the host IP when there’s no tenant using it.
-
Number of IPs required per managed server: 1
-
The pool should be large enough for one usable IP per managed server, plus any required network and broadcast addresses for the subnet(s).
NICo Managed Tenant Network(s)
-
Number of IPs required per managed host per tenant network: 2 host IPs (PF + VF), provisioned as one
/31per interface.- For example, if you want to provision for two tenant networks, you should provide two pools, each large enough for all servers.
-
When a managed host is allocated to a tenant, it joins a tenant network.
-
There can be multiple tenant networks.
-
IP allocations are managed by NICo.
-
We use
/31point-to-point subnets per interface; for example, a host with 1 DPU using the PF and one VF consumes 2 ×/31subnets per tenant network (one/31for each interface).
Switch Configuration
The following is a minimum configuration for switches.
- Connect TOR ports to the site controller (or its DPU). These portsmust be configured for BGP unnumbered sessions, similar to the configuration used for managed-host DPUs (when in use).
- Enable LACP in sending and receiving mode.
- BGP route maps setup to accept delegated routes from the networking provider
- Enable the EVPN address family.
- Switches should accept dual-stacked IPv4 + EVPN sessions from the site controllers.
- Site controllers export their service VIPs with a dedicated EVPN route-target that all managed-host DPUs import.
- Site controllers import EVPN route-targets for the following:
- All internal tenant networks
- All external tenant networks
- Any additional route-targets required for service connectivity (for example, a default route to the Internet or connectivity to a secure management network).
Storage Layout for K8s (only what we need)
Storage layout for the site controller should keep the OS clean and isolate the container/Kubelet I/O.
- Mount 1.7 Tb on
/(root) on NVMe OS disk (ext4 or xfs)- Usage is typically ~ 200–500 GiB
- Mount /var/lib/containerd and /var/lib/kubelet on a separate NVMe data disk (≥ 1 TiB)
- Format ext4/xfs; mount with noatime; consider a dedicated
/var/logif there is heavy logging.
- Format ext4/xfs; mount with noatime; consider a dedicated
- Use persistent app storage, such as SAN/NAS or an add‑on (e.g. Rook‑Ceph), if required by workloads. This is not required for the NICo controller itself.
Security and Platform Settings
The following are recommended settings for the site controller:
- Enable UEFI + Secure Boot (with signed kernel/modules).
- Enable VT‑x/AMD‑V + IOMMU in BIOS/UEFI.
- Enable SR‑IOV (if using NIC VFs), otherwise leave off.
- Lock NTP to enterprise sources; enable clock drift alarms.
Networking Requirements
This section outlines the networking requirements for NCX Infra Controller (NICo), including the necessary infrastructure, protocols, and performance standards.
Here is an overview of the requirements, which will be detailed in the following sections:
- VNIs: Datacenter-unique VNIs allocated based on the expected number of VPCs.
- ASNs: Globally-unique 32-bit ASNs allocated based on the expected number of DPUs.
- IPv4 prefixes: A single, globally-unique IPv4 prefix with a total number of IP allocation based on the following formula:
(expected number of servers + the expected number of DPUs) * 2 + 2- One or more additional, globally-unique IPv4 prefixes with a total IP allocation amount based on the following formula:
expected number of DPUs * 2. Minimum individual prefix size is /31.
- One or more additional, globally-unique IPv4 prefixes with a total IP allocation amount based on the following formula:
- Routing: A mechanism for route-propagation and a default route for the tenant EVPN overlay network. Options for providing this include the following:
- Allowing additional L2VPN-EVPN sessions with LEAF TORs and configuring the same sessions at each tier of the network (refer to simplified diagram below for reference).
- Configuring a new set of devices to act as tenant gateways with an isolated tenant VRF, peering the new gateways with the core routers, and applying necessary route-leaking to inject a default route into the tenant VRF.

Underlay and BGP Configuration
- Enable eBGP Unnumbered: Configure on all leaf switches facing DPUs (RFC 5549).
- Assign ASNs: Allocate a pool of unique AS numbers based on the expected number of DPUs for the site.
- Advertise Loopbacks: Ensure DPUs advertise
/32loopbacks for VxLAN tunnel endpoints. - VTEP to VTEP Connectivity: Ensure DPUs receive either the
/32advertised by all other DPUs, or an aggregate that contains them, or a default route at a minimum. - Route Filtering:
- Filter DPU announcements to only loopbacks.
- Aggregate routes at the leaf/pod level where possible.
- Set max-prefix limits on leaf switch ports facing DPUs.
Overlay and EVPN Configuration
Overlay Options
-
Option 1 - Dual-stacked Ipv4/EVPN sessions with TOR
- Configure peering as follows:
- TORs should be configured to accept EVPN sessions with the DPUs in addition to the existing IPv4 sessions.
- At a minimum, spines should be configured for EVPN sessions with the TORs. Ideally, all tiers of the network should be configured with EVPN sessions.
- Configure peering as follows:
-
Option 2 - Route-servers
- Deploy Route Servers: Set up at least two redundant BGP route servers (e.g. on-site controllers) for EVPN overlay peering.
- Configure Peering: Establish multi-hop eBGP sessions (EVPN address family only) between DPUs and route servers.
- Disable IPv4 Unicast: Ensure IPv4 unicast is disabled on overlay sessions.
Providing a Default Route
Ensure that a default route is provided to the overlay. Options for providing this include the following:
- Allowing additional L2VPN-EVPN sessions with LEAF TORs and configuring the same sessions at each tier of your network.
- Configuring a new set of devices to act as tenant gateways with an isolated tenant VRF, peering the new gateways with your core routers, and applying the necessary route-leaking to inject a default route into the tenant VRF.
Services and Integration
- OOB DHCP Relay: The OOB network should be configured with a DHCP relay to forward DHCP requests of BMCs to the Carbide DHCP service IP.
Hardware/Physical
- Cabling: Connect DPUs to ToR/EoR switches (dual-homed recommended for redundancy).
- Management Network: Ensure separate out-of-band management connectivity for DPU BMCs.
Autonomous System Number (ASN) Allocations
- Unique ASN per DPU: Every DPU will be assigned a unique ASN from a pool of ASNs given to Carbide. In multi-DPU hosts, each DPU will have its own unique ASN.
- 32-bit ASNs: The use of 32-bit ASNs is required to ensure a sufficient number of unique numbers are available.
- Architecture: The RFC 7938 guidelines should be followed for data center routing to prevent path hunting and loops.
- Route-Servers (Optional): A specific ASN is needed for the BGP Route Servers (typically shared across the redundant route-server set).
IP Allocations
- L3VNI (Layer 3 VNI)
- Tenant-Network: One VNI for each expected VPC in a site. Each VPC requires a unique L3VNI that identifies their VRF.
- L2VNI (Layer 2 VNI)
- Admin Network: A unique L2VNI is required for the admin network in a site.
Route-Targets
The following are the standardized common route targets:
:50100(Control-Plane/Service VIPs): Site Controller DPUs export service VIP routes with this tag.:50200(Internal Tenant Routes): Routes for VPCs designated as internal:50300(Maintenance): Routes for VPCs designated as used for maintenance:50400(Admin Network Routes): Routes belonging to the administrative network:50500(External Tenant Routes): Routes for VPCs designated as external
[!NOTE] The route targets listed above are suggestions and can be changed, as long as all components agree. For example, if you choose an internal-common route target of 45001 instead of 50200, ensure both the config and the network are updated.
Import/Export Policies
To ensure proper communication, the following mutual import/export relationships must be configured:
- Tenant/Admin to Control Plane: Networks exporting
:50200through:50500must import:50100. This ensures tenant, admin, and maintenance networks can reach control-plane VIPs. - Control Plane to Tenant/Admin: Site Controllers (or their routing equivalents) exporting
:50100must import:50200through:50500. This ensures the control plane can reach all managed endpoints.
[!NOTE] While many deployments align the route target number with the VNI for administrative simplicity, the routing policy is strictly governed by the route target import/export configuration, not the VNI itself.
Building NICo Containers
This section provides instructions for building the containers for NCX Infra Controller (NICo).
Installing Prerequisite Software
Before you begin, ensure you have the following prerequisites:
- An Ubuntu 24.04 Host or VM with 150GB+ of disk space (MacOS is not supported)
Use the following steps to install the prerequisite software on the Ubuntu Host or VM. These instructions
assume an apt-based distribution such as Ubuntu 24.04.
apt-get install build-essential cpio direnv mkosi uidmap curl fakeroot git docker.io docker-buildx sccache protobuf-compiler libopenipmi-dev libudev-dev libboost-dev libgrpc-dev libprotobuf-dev libssl-dev libtss2-dev kea-dev systemd-boot systemd-ukify jq zip- Add the correct hook for your shell
- Install rustup:
curl --proto '=https' --tlsv1.2 -sSf https://sh.rustup.rs | sh(select Option 1) - Start a new shell to pick up changes made from direnv and rustup.
- Clone NICo -
git clone git@github.com:NVIDIA/ncx-infra-controller-core.git ncx-infra-controller cd ncx-infra-controllerdirenv allowcd $REPO_ROOT/pxegit clone https://github.com/systemd/mkosi.gitcd mkosi && git checkout 26673f6cd $REPO_ROOT/pxe/ipxegit clone https://github.com/ipxe/ipxe.git upstreamcd upstream && git checkout d7e58c5sudo systemctl enable docker.socketcd $REPO_ROOTcargo install cargo-make cargo-cacheecho "kernel.apparmor_restrict_unprivileged_userns=0" | sudo tee /etc/sysctl.d/99-userns.confsudo usermod -aG docker <username>reboot
Building X86_64 Containers
NOTE: Execute these tasks in order. All commands are run from the top of the ncx-infra-controller directory.
Building the X86 build container
docker build --file dev/docker/Dockerfile.build-container-x86_64 -t nico-buildcontainer-x86_64 .
Building the X86 runtime container
docker build --file dev/docker/Dockerfile.runtime-container-x86_64 -t nico-runtime-container-x86_64 .
Building the boot artifact containers
cargo make --cwd pxe --env SA_ENABLEMENT=1 build-boot-artifacts-x86-host-sa
docker build --build-arg "CONTAINER_RUNTIME_X86_64=alpine:latest" -t boot-artifacts-x86_64 -f dev/docker/Dockerfile.release-artifacts-x86_64 .
Building the Machine Validation images
docker build --build-arg CONTAINER_RUNTIME_X86_64=nico-runtime-container-x86_64 -t machine-validation-runner -f dev/docker/Dockerfile.machine-validation-runner .

docker save --output crates/machine-validation/images/machine-validation-runner.tar machine-validation-runner:latest

// This copies `machine-validation-runner.tar` into the `/images` directory on the `machine-validation-config` container.  When using a kubernetes deployment model
// this is the only `machine-validation` container you need to configure on the `carbide-pxe` pod.

docker build --build-arg CONTAINER_RUNTIME_X86_64=nico-runtime-container-x86_64 -t machine-validation-config -f dev/docker/Dockerfile.machine-validation-config .
Building nico-core container
docker build --build-arg "CONTAINER_RUNTIME_X86_64=nico-runtime-container-x86_64" --build-arg "CONTAINER_BUILD_X86_64=nico-buildcontainer-x86_64" -f dev/docker/Dockerfile.release-container-sa-x86_64 -t nico .
Building the AARCH64 Containers and artifacts
Building the Cross-compile container
docker build --file dev/docker/Dockerfile.build-artifacts-container-cross-aarch64 -t build-artifacts-container-cross-aarch64 .
Building the admin-cli
The admin-cli build does not produce a container. It produces a binary:
$REPO_ROOT/target/release/carbide-admin-cli
BUILD_CONTAINER_X86_URL="nico-buildcontainer-x86_64" cargo make build-cli
Building the DPU BFB
Download and Extracting the HBN container
docker pull --platform=linux/arm64 nvcr.io/nvidia/doca/doca_hbn:3.2.2-doca3.2.2
docker save --output=/tmp/doca_hbn.tar nvcr.io/nvidia/doca/doca_hbn:3.2.2-doca3.2.2
Downloading HBN configuration files and scripts
#!/usr/bin/env bash
HBN_VERSION="3.2.2"
set -e
mkdir -p temp
cd temp || exit 1
files=$(curl -s "https://api.ngc.nvidia.com/v2/resources/org/nvidia/team/doca/doca_hbn/${HBN_VERSION}/files")
printf '%s\n' "$files" |
  jq -c '
    .urls as $u
  | .filepath as $p
  | .sha256_base64 as $s
  | range(0; $u | length) as $i
  | {url: $u[$i], filepath: $p[$i], sha256_base64: $s[$i]}
  ' |
  while IFS= read -r obj; do
    url=$(printf '%s\n' "$obj" | jq -r '.url')
    path=$(printf '%s\n' "$obj" | jq -r '.filepath')
    sha=$(printf '%s\n' "$obj" | jq -r '.sha256_base64' | base64 -d | od -An -vtx1 | tr -d ' \n')
    mkdir -p "$(dirname "$path")"
    curl -sSL "$url" -o "$path"
    printf '%s  %s\n' "$sha" "$path" | sha256sum -c --status || exit 1
  done
cd ..
mkdir -p doca_container_configs
mv temp/scripts/${HBN_VERSION}/ doca_container_configs/scripts
mv temp/configs/${HBN_VERSION}/ doca_container_configs/configs
cd doca_container_configs
zip -r ../doca_container_configs.zip .
After running the script above:
cp doca_container_configs.zip /tmp
cargo make --cwd pxe --env SA_ENABLEMENT=1 build-boot-artifacts-bfb-sa

docker build --build-arg "CONTAINER_RUNTIME_AARCH64=alpine:latest" -t boot-artifacts-aarch64 -f dev/docker/Dockerfile.release-artifacts-aarch64 .
NOTE: The CONTAINER_RUNTIME_AARCH64=alpine:latest build argument must be included. The aarch64 binaries are bundled into an x86 container.
Ingesting Hosts
Once you have NCX Infra Controller (NICo) up and running, you can begin ingesting machines.
Prerequisites
Ensure you have the following prerequisites met before ingesting machines:
-
You have the
admin-clicommand available: You can compile it from sources or you can use the pre-compiled binary. Another choice is to use a containerized version. -
You can access the NICo site using the
admin-cli. -
The NICo API service is running at IP address
NICo_API_EXTERNAL. It is recommended that you add this IP address to your trusted list. -
DHCP requests from all managed host IPMI networks have been forwarded to the NICo service running at IP address
NICo_DHCP_EXTERNAL. -
You have the following information for all hosts that need to be ingested:
- The MAC address of the host BMC
- The chassis serial number
- The host BMC username (typically this is the factory default username)
- The host BMC password (typically this is the factory default password)
Update Site
NICo requires knowledge of the desired BMC and UEFI credentials for hosts and DPUs. NICo will set these credentials on the BMC and UEFI when ingesting a host. You can use these credentials when accessing the host or DPU BMC yourself, and NICo will use these credentials for its automated processes.
The required credentials include the following:
- Host BMC Credential
- DPU BMC Credential
- Host UEFI password
- DPU UEFI password
:::{note}
The following commands use the <api-url> placeholder, which is typically the following:
https://api-<ENVIRONMENT_NAME>.<SITE_DOMAIN_NAME>
:::
Update Host and DPU BMC Password
Run this command to update the desired Host and DPU BMC password:
admin-cli -c <api-url> credential add-bmc --kind=site-wide-root --password='x'
Update Host UEFI Password
Run this command to update the desired host UEFI password:
admin-cli -c <api-url> host generate-host-uefi-password
Run this command to update host uefi password:
admin-cli -c <api-url> credential add-uefi --kind=host --password='x'
Update DPU UEFI Password
TODO: Need to add this command.
Add Expected Machines Table
NICo needs to know the factory default credentials for each BMC, which is expressed as a JSON table of "Expected Machines". The serial number is used to verify the BMC MAC matches the actual serial number of the chassis.
Prepare an expected_machines.json file as follows:
{
  "expected_machines": [
    {
      "bmc_mac_address": "C4:5A:B1:C8:38:0D",
      "bmc_username": "root",
      "bmc_password": "default-password1",
      "chassis_serial_number": "SERIAL-1"
    },
    {
      "bmc_mac_address": "C4:5A:FF:FF:FF:FF",
      "bmc_username": "root",
      "bmc_password": "default-password2",
      "chassis_serial_number": "SERIAL-2"
    }
  ]
}
Only servers listed in this table will be ingested, so you must include all servers in this file.
When the file is ready, upload it to the site with the following command:
admin-cli -c <api-url> credential em replace-all --filename expected_machines.json
Approve all Machines for Ingestion
NICo uses Measured Boot using the on-host Trusted Platform Module (TPM) v2.0 to enforce cryptographic identity of the host hardware and firmware. The following command configures NICo to approve all pending machines based on PCR Registers 0, 3, 5, and 6.
admin-cli -c <api-url> mb site trusted-machine approve \* persist --pcr-registers="0,3,5,6"
Removing Hosts
Removing hosts from being controlled by NCX Infra Controller (NICo).
TODO:
- Write something about removing host from expected Machines and force-deleting it (with releasing IPs)
Updating Expected Hosts Manifest
There is a table in the carbide-api database, that holds the following information about the expected hosts:
- Chassis Serial Number
- BMC MAC Address
- BMC manufacturer's set login
- BMC manufacturer's set password
- DPU's chassis serial number (only needed for DGX-H100, or other machines that do not have NetworkAdapter Serial number available in the host redfish).
There is a carbide-admin-cli command to manipulate expected machines table. update, add, delete commands allow operating on individual elements of the expected machines table. erase and replace-all operate on all the entries at once.
Additionally, the expected machines table can be exported as a JSON file with carbide-admin-cli -f json em show command. Likewise, a JSON file can be used to import and overwrite all existing values with forge-admin-cli em replace-all <filename> command.
Updating Hosts
Write something about Host Firmware and DPU updates - and the manual and automated ways of triggering them.
Host Validation
Table of Contents
How to use Machine Validation feature
How to add new platform support?
Frequently Asked Questions (FAQs)
Getting Started
Overview
This page provides a workflow for machine validation in NCX Infra Controller (NICo).
Machine validation is a process of testing and verifying the hardware components and peripherals of a machine before handing it over to a tenant. The purpose of machine validation is to avoid disruption of tenant usage and ensure that the machine meets the expected benchmarks and performance. Machine validation involves running a series of regression tests and burn-in tests to stress the machine to its maximum capability and identify any potential issues or failures. Machine validation provides several benefits for the tenant. By performing machine validation, NICo ensures that machine is in optimal condition and ready for tenant usage. Machine validation helps to detect and resolve any hardware issues or failures before they affect the tenant's workloads
Machine validation is performed using a different tool, these are available in the discovery image. Most of these tools require root privileges and are non-interactive. The tool(s) runs tests and sends result to Site controller
Purpose
End to end user guide for usage of machine validation feature in NICo
Audience
SRE, Provider admin, Developer
Prerequisites
- Access to NICo sites
Features and Functionalities
Features
Feature gate
The NICo site controller has site settings. These settings provide mechanisms to enable and disable features. Machine Validation feature controlled using these settings. The feature gate enables or disables machine validation features at deploy time.
Test case management
Test Case Management is the process of adding, updating test cases. There are two types of test cases
- Test cases added during deploy- These are common across all the sites and these are read-only test cases. Test cases are added through NICo DB migration.
- Site specific test case - Added by site admin
Enable disable test
If the test case is enabled then forge-scout selects the test case for running.
Verify tests
If site admin adds a test case, by default the test case verified flag will be set to false. The term verify means test case added to NICo datastore but not actually verified on hardware. By default the forge-scout never runs unverified test cases. Using on-demand machine validation, admin can run unverified test cases.
View tests results
Once the forge-scout completes the test cases, the view results feature gives a detailed report of executed test cases.
On Demand tests
If the machine is not allocated for long and the machine remains in ready state, the site admin can run the On-Demand testing. Here the selected tests will run.
List of test cases
    | TestId                   | Name               | Command                    | Timeout | IsVerified | Version              | IsEnabled |

    +--------------------------+--------------------+----------------------------+---------+------------+----------------------+-----------+

    | forge_CpuBenchmarkingFp  | CpuBenchmarkingFp  | /benchpress/benchpress     | 7200    | true       | V1-T1734600519831720 | true      |

    +--------------------------+--------------------+----------------------------+---------+------------+----------------------+-----------+

    | forge_CpuBenchmarkingInt | CpuBenchmarkingInt | /benchpress/benchpress     | 7200    | true       | V1-T1734600519831720 | true      |

    +--------------------------+--------------------+----------------------------+---------+------------+----------------------+-----------+

    | forge_CudaSample         | CudaSample         | /opt/benchpress/benchpress | 7200    | true       | V1-T1734600519831720 | true      |

    +--------------------------+--------------------+----------------------------+---------+------------+----------------------+-----------+

    | forge_FioFile            | FioFile            | /opt/benchpress/benchpress | 7200    | true       | V1-T1734600519831720 | true      |

    +--------------------------+--------------------+----------------------------+---------+------------+----------------------+-----------+

    | forge_FioPath            | FioPath            | /opt/benchpress/benchpress | 7200    | true       | V1-T1734600519831720 | true      |

    +--------------------------+--------------------+----------------------------+---------+------------+----------------------+-----------+

    | forge_FioSSD             | FioSSD             | /opt/benchpress/benchpress | 7200    | true       | V1-T1734600519831720 | true      |

    +--------------------------+--------------------+----------------------------+---------+------------+----------------------+-----------+

    | forge_MmMemBandwidth     | MmMemBandwidth     | /benchpress/benchpress     | 7200    | true       | V1-T1734600519831720 | true      |

    +--------------------------+--------------------+----------------------------+---------+------------+----------------------+-----------+

    | forge_MmMemLatency       | MmMemLatency       | /benchpress/benchpress     | 7200    | true       | V1-T1734600519831720 | true      |

    +--------------------------+--------------------+----------------------------+---------+------------+----------------------+-----------+

    | forge_MmMemPeakBandwidth | MmMemPeakBandwidth | /benchpress/benchpress     | 7200    | true       | V1-T1734600519831720 | true      |

    +--------------------------+--------------------+----------------------------+---------+------------+----------------------+-----------+

    | forge_Nvbandwidth        | Nvbandwidth        | /opt/benchpress/benchpress | 7200    | true       | V1-T1734600519831720 | true      |

    +--------------------------+--------------------+----------------------------+---------+------------+----------------------+-----------+

    | forge_RaytracingVk       | RaytracingVk       | /opt/benchpress/benchpress | 7200    | true       | V1-T1734600519831720 | false     |

    +--------------------------+--------------------+----------------------------+---------+------------+----------------------+-----------+

    | forge_CPUTestLong        | CPUTestLong        | stress-ng                  | 7200    | true       | V1-T1731386879991534 | true      |

    +--------------------------+--------------------+----------------------------+---------+------------+----------------------+-----------+

    | forge_CPUTestShort       | CPUTestShort       | stress-ng                  | 7200    | true       | V1-T1731386879991534 | true      |

    +--------------------------+--------------------+----------------------------+---------+------------+----------------------+-----------+

    | forge_MemoryTestLong     | MemoryTestLong     | stress-ng                  | 7200    | true       | V1-T1731386879991534 | true      |

    +--------------------------+--------------------+----------------------------+---------+------------+----------------------+-----------+

    | forge_MemoryTestShort    | MemoryTestShort    | stress-ng                  | 7200    | true       | V1-T1731386879991534 | true      |

    +--------------------------+--------------------+----------------------------+---------+------------+----------------------+-----------+

    | forge_MqStresserLong     | MqStresserLong     | stress-ng                  | 7200    | true       | V1-T1731386879991534 | true      |

    +--------------------------+--------------------+----------------------------+---------+------------+----------------------+-----------+

    | forge_MqStresserShort    | MqStresserShort    | stress-ng                  | 7200    | true       | V1-T1731386879991534 | true      |

    +--------------------------+--------------------+----------------------------+---------+------------+----------------------+-----------+

    | forge_DcgmFullShort      | DcgmFullShort      | dcgmi                      | 7200    | true       | V1-T1731384539962561 | true      |

    +--------------------------+--------------------+----------------------------+---------+------------+----------------------+-----------+

    | forge_DefaultTestCase    | DefaultTestCase    | echo                       | 7200    | false      | V1-T1731384539962561 | true      |

    +--------------------------+--------------------+----------------------------+---------+------------+----------------------+-----------+

    | forge_DcgmFullLong       | DcgmFullLong       | dcgmi                      | 7200    | true       | V1-T1731383523746813 | true      |

    +--------------------------+--------------------+----------------------------+---------+------------+----------------------+-----------+

    | forge_ForgeRunBook       | ForgeRunBook       |                            | 7200    | true       | V1-T1731382251768493 | false     |

    +--------------------------+--------------------+----------------------------+---------+------------+----------------------+-----------+
How to use Machine Validation feature
Initial setup
NICo has a Machine validation feature gate. By default the feature is disabled.
To enable add below section in api site config toml forged/
[machine_validation_config] enabled = true
Machine Validation allows site operators to configure the NGC container registry. This allows machine validation to use private container in
Finally add the config to site
user:~$ carbide-admin-cli machine-validation external-config add-update --name container_auth --description "NVCR description" --file-name /tmp/config.json
Note: One can copy Imagepullsecret from Kubernetes - kubectl get secrets -n forge-system imagepullsecret -o yaml | awk '$1==".dockerconfigjson:" {print $2}'
Enable test cases
By default all the test cases are disabled.
user@host:admin$ carbide-admin-cli machine-validation tests show

+--------------------------+--------------------+----------------------------+---------+------------+----------------------+-----------+

| TestId                   | Name               | Command                    | Timeout | IsVerified | Version              | IsEnabled |

+==========================+====================+============================+=========+============+======================+===========+

| forge_CpuBenchmarkingFp  | CpuBenchmarkingFp  | /benchpress/benchpress     | 7200    | true       | V1-T1734600519831720 | false     |

+--------------------------+--------------------+----------------------------+---------+------------+----------------------+-----------+

| forge_CpuBenchmarkingInt | CpuBenchmarkingInt | /benchpress/benchpress     | 7200    | true       | V1-T1734600519831720 | false     |

+--------------------------+--------------------+----------------------------+---------+------------+----------------------+-----------+

| forge_CudaSample         | CudaSample         | /opt/benchpress/benchpress | 7200    | true       | V1-T1734600519831720 | false     |

+--------------------------+--------------------+----------------------------+---------+------------+----------------------+-----------+
To enable tests
carbide-admin-cli machine-validation tests enable --test-id <test_id> --version  <test version>

carbide-admin-cli machine-validation tests verify --test-id <test_id> --version  <test version>

Note: There is a bug, a workaround is to use two commands. Will be fixed in coming releases.

Eg:  To enable forge_CudaSample  execute following steps

user@host:admin$ carbide-admin-cli machine-validation tests enable --test-id forge_CudaSample  --version  V1-T1734600519831720

user@host:admin$ carbide-admin-cli machine-validation tests verify --test-id forge_CudaSample  --version  V1-T1734600519831720
Enabling different tests cases
CPU Benchmarking test cases
-
forge_CpuBenchmarkingFp
carbide-admin-cli machine-validation tests enable --test-id forge_CpuBenchmarkingFp --version V1-T1734600519831720 carbide-admin-cli machine-validation tests verify --test-id forge_CpuBenchmarkingFp --version V1-T1734600519831720 -
forge_CpuBenchmarkingInt
 carbide-admin-cli machine-validation tests enable --test-id forge_CpuBenchmarkingInt --version  V1-T1734600519831720

 carbide-admin-cli machine-validation tests verify --test-id forge_CpuBenchmarkingInt --version  V1-T1734600519831720
Cuda sample test cases
-
forge_CudaSample
 carbide-admin-cli machine-validation tests enable --test-id forge_CudaSample --version  V1-T1734600519831720

 carbide-admin-cli machine-validation tests verify --test-id forge_CudaSample --version  V1-T1734600519831720
FIO test cases
-
forge_FioFile
carbide-admin-cli machine-validation tests enable --test-id forge_FioFile --version V1-T1734600519831720 carbide-admin-cli machine-validation tests verify --test-id forge_FioFile --version V1-T1734600519831720 -
forge_FioPath
carbide-admin-cli machine-validation tests enable --test-id forge_FioPath --version V1-T1734600519831720 carbide-admin-cli machine-validation tests verify --test-id forge_FioPath --version V1-T1734600519831720 -
forge_FioSSD
 carbide-admin-cli machine-validation tests enable --test-id forge_FioSSD --version  V1-T1734600519831720

 carbide-admin-cli machine-validation tests verify --test-id forge_FioSSD --version  V1-T1734600519831720
Memory test cases
-
forge_MmMemBandwidth
carbide-admin-cli machine-validation tests enable --test-id forge_MmMemBandwidth --version V1-T1734600519831720 carbide-admin-cli machine-validation tests verify --test-id forge_MmMemBandwidth --version V1-T1734600519831720 -
forge_MmMemLatency
carbide-admin-cli machine-validation tests enable --test-id forge_MmMemLatency --version V1-T1734600519831720 carbide-admin-cli machine-validation tests verify --test-id forge_MmMemLatency --version V1-T1734600519831720 -
forge_MmMemPeakBandwidth
 carbide-admin-cli machine-validation tests enable --test-id forge_MmMemPeakBandwidth --version  V1-T1734600519831720

 carbide-admin-cli machine-validation tests verify --test-id forge_MmMemPeakBandwidth --version  V1-T1734600519831720
NV test cases
-
forge_Nvbandwidth
carbide-admin-cli machine-validation tests enable --test-id forge_Nvbandwidth --version  V1-T1734600519831720

carbide-admin-cli machine-validation tests verify --test-id forge_Nvbandwidth --version  V1-T1734600519831720
Stress ng test cases
-
forge_CPUTestLong
carbide-admin-cli machine-validation tests enable --test-id forge_CPUTestLong --version V1-T1731386879991534 carbide-admin-cli machine-validation tests verify --test-id forge_CPUTestLong --version V1-T1731386879991534 -
forge_CPUTestShort
carbide-admin-cli machine-validation tests enable --test-id forge_CPUTestShort --version V1-T1731386879991534 carbide-admin-cli machine-validation tests verify --test-id forge_CPUTestShort --version V1-T1731386879991534 -
forge_MemoryTestLong
carbide-admin-cli machine-validation tests enable --test-id forge_MemoryTestLong --version V1-T1731386879991534 carbide-admin-cli machine-validation tests verify --test-id forge_MemoryTestLong --version V1-T1731386879991534 -
forge_MemoryTestShort
carbide-admin-cli machine-validation tests enable --test-id forge_MemoryTestShort --version V1-T1731386879991534 carbide-admin-cli machine-validation tests verify --test-id forge_MemoryTestShort --version V1-T1731386879991534 -
forge_MqStresserLong
carbide-admin-cli machine-validation tests enable --test-id forge_MqStresserLong --version V1-T1731386879991534 carbide-admin-cli machine-validation tests verify --test-id forge_MqStresserShort --version V1-T1731386879991534 -
forge_MqStresserShort
carbide-admin-cli machine-validation tests enable --test-id forge_MqStresserShort  --version  V1-T1731386879991534

carbide-admin-cli machine-validation tests verify --test-id forge_MqStresserShort  --version  V1-T1731386879991534
DCGMI test cases
-
forge_DcgmFullShort
carbide-admin-cli machine-validation tests enable --test-id forge_DcgmFullShort --version V1-T1731384539962561 carbide-admin-cli machine-validation tests verify --test-id forge_DcgmFullLong --version V1-T1731384539962561 -
forge_DcgmFullLong
carbide-admin-cli machine-validation tests enable --test-id forge_DcgmFullLong  --version  V1-T1731383523746813

carbide-admin-cli machine-validation tests verify --test-id forge_DcgmFullLong  --version  V1-T1731383523746813
Shoreline Agent test case
-
forge_ForgeRunBook
carbide-admin-cli machine-validation tests enable --test-id forge_ForgeRunBook --version  V1-T1731383523746813

carbide-admin-cli machine-validation tests verify --test-id forge_ForgeRunBook  --version  V1-T1731383523746813
Verify tests
If a test is modified or added by site admin by default the test case verify flag is set to false
    user@host:admin$ carbide-admin-cli machine-validation tests show

    +--------------------------+--------------------+----------------------------+---------+------------+----------------------+-----------+

    | TestId                   | Name               | Command                    | Timeout | IsVerified | Version              | IsEnabled |

    +==========================+====================+============================+=========+============+======================+===========+

    | forge_site_admin         | site               | echo                       | 7200    | false      | V1-T1734009539861341 | true      |

    +--------------------------+--------------------+----------------------------+---------+------------+----------------------+-----------+
To mark test as verified
carbide-admin-cli machine-validation tests verify --test-id <test_id> --version <test version>
Eg: To enable forge_CudaSample execute following steps
user@host:admin$ carbide-admin-cli machine-validation tests verify --test-id forge_site_admin --version V1-T1734009539861341
Add test case
Site admin can add test cases per site.
user@host:admin$ carbide-admin-cli machine-validation tests add --help
Add new test case
Usage: carbide-admin-cli machine-validation tests add [OPTIONS] --name
Options:
  --name <NAME>

      Name of the test case

  --command <COMMAND>

      Command of the test case

  --args <ARGS>

      Args for command

  --contexts <CONTEXTS>

      List of contexts

  --img-name <IMG_NAME>

      Container image name

  --execute-in-host <EXECUTE_IN_HOST>

      Run command using chroot in case of container [possible values: true, false]

  --container-arg <CONTAINER_ARG>

      Container args

  --description <DESCRIPTION>

      Description

  --extra-err-file <EXTRA_ERR_FILE>

      Command output error file

  --extended

      Extended result output.

  --extra-output-file <EXTRA_OUTPUT_FILE>

      Command output file

  --external-config-file <EXTERNAL_CONFIG_FILE>

      External file

  --pre-condition <PRE_CONDITION>

      Pre condition

  --timeout <TIMEOUT>

      Command Timeout

  --supported-platforms <SUPPORTED_PLATFORMS>

      List of supported platforms

  --custom-tags <CUSTOM_TAGS>

      List of custom tags

  --components <COMPONENTS>

      List of system components

  --is-enabled <IS_ENABLED>

      Enable the test [possible values: true, false]

  --read-only <READ_ONLY>

      Is read-only [possible values: true, false]

-h, --help

      Print help
Eg: add test case which prints ‘newtest’
    user@host:admin$ carbide-admin-cli machine-validation tests add   --name NewTest --command echo --args newtest

    user@host:admin$ carbide-admin-cli machine-validation tests show --test-id forge_NewTest

    +---------------+---------+---------+---------+------------+----------------------+-----------+

    | TestId        | Name    | Command | Timeout | IsVerified | Version              | IsEnabled |

    +===============+=========+=========+=========+============+======================+===========+

    | forge_NewTest | NewTest | echo    | 7200    | false      | V1-T1736492939564126 | true      |

    +---------------+---------+---------+---------+------------+----------------------+-----------+
By default the test case’s verify flag is set to false. Set
    user@host:admin$ carbide-admin-cli machine-validation tests verify  --test-id forge_NewTest --version V1-T1736492939564126

    user@host:admin$ carbide-admin-cli machine-validation tests show --test-id forge_NewTest

    +---------------+---------+---------+---------+------------+----------------------+-----------+

    | TestId        | Name    | Command | Timeout | IsVerified | Version              | IsEnabled |

    +===============+=========+=========+=========+============+======================+===========+

    | forge_NewTest | NewTest | echo    | 7200    | true       | V1-T1736492939564126 | true      |

    +---------------+---------+---------+---------+------------+----------------------+-----------+
Update test case
Update existing testcases
user@host:admin$ carbide-admin-cli machine-validation tests update --help
Update existing test case
Usage: carbide-admin-cli machine-validation tests update [OPTIONS] --test-id <TEST_ID> --version
Options:
  --test-id <TEST_ID>

      Unique identification of the test

  --version <VERSION>

      Version to be verify

  --contexts <CONTEXTS>

      List of contexts

  --img-name <IMG_NAME>

      Container image name

  --execute-in-host <EXECUTE_IN_HOST>

      Run command using chroot in case of container [possible values: true, false]

  --container-arg <CONTAINER_ARG>

      Container args

  --description <DESCRIPTION>

      Description

  --command <COMMAND>

      Command

  --args <ARGS>

      Command args

  --extended

      Extended result output.

  --extra-err-file <EXTRA_ERR_FILE>

      Command output error file

  --extra-output-file <EXTRA_OUTPUT_FILE>

      Command output file

  --external-config-file <EXTERNAL_CONFIG_FILE>

      External file

  --pre-condition <PRE_CONDITION>

      Pre condition

  --timeout <TIMEOUT>

      Command Timeout

  --supported-platforms <SUPPORTED_PLATFORMS>

      List of supported platforms

  --custom-tags <CUSTOM_TAGS>

      List of custom tags

  --components <COMPONENTS>

      List of system components

  --is-enabled <IS_ENABLED>

      Enable the test [possible values: true, false]

    -h, --help

      Print help
We can selectively update fields of test cases. Once the test case is updated the verify flag is set to false. Site admin hs to explicitly set the flag as verified.
    user@host:admin$ carbide-admin-cli machine-validation tests update  --test-id forge_NewTest --version V1-T1736492939564126 --args updatenewtest

    user@host:admin$ carbide-admin-cli machine-validation tests show --test-id forge_NewTest

    +---------------+---------+---------+---------+------------+----------------------+-----------+

    | TestId        | Name    | Command | Timeout | IsVerified | Version              | IsEnabled |

    +===============+=========+=========+=========+============+======================+===========+

    | forge_NewTest | NewTest | echo    | 7200    | false      | V1-T1736492939564126 | true      |

    +---------------+---------+---------+---------+------------+----------------------+-----------+

    user@host:admin$ carbide-admin-cli machine-validation tests verify  --test-id forge_NewTest --version V1-T1736492939564126

    user@host:admin$ carbide-admin-cli machine-validation tests show --test-id forge_NewTest

    +---------------+---------+---------+---------+------------+----------------------+-----------+

    | TestId        | Name    | Command | Timeout | IsVerified | Version              | IsEnabled |

    +===============+=========+=========+=========+============+======================+===========+

    | forge_NewTest | NewTest | echo    | 7200    | true       | V1-T1736492939564126 | true      |

    +---------------+---------+---------+---------+------------+----------------------+-----------+

    user@host:admin$
Run On-Demand Validation
Machine validation has 3 Contexts
-
Discovery - Tests cases with this context will be executed during node ingestion time.
-
Cleanup - Tests cases with context will be executed during node cleanup(between tenants).
-
On-Demand - Tests cases with context will be executed when on demand machine validation is triggered.
user@host:admin$ carbide-admin-cli machine-validation on-demand start --help
Start on demand machine validation
Usage: carbide-admin-cli machine-validation on-demand start [OPTIONS] --machine <MACHINE>

Options:

    --help

-m, --machine <MACHINE>              Machine id for start validation

  --tags <TAGS>                    Results history

  --allowed-tests <ALLOWED_TESTS>  Allowed tests

  --run-unverfied-tests            Run un verified tests

  --contexts <CONTEXTS>            Contexts

  --extended                       Extended result output.
Usecase 1 - Run tests whose context is on-demand
user@host:admin$ carbide-admin-cli machine-validation on-demand start -m fm100htq54dmt805ck6k95dfd44itsufqiidd4acrdt811t92hvvlacm8gg
Usecase 2 - Run tests whose context is Discovery
user@host:admin$ carbide-admin-cli machine-validation on-demand start -m fm100htq54dmt805ck6k95dfd44itsufqiidd4acrdt811t92hvvlacm8gg --contexts Discovery
Usecase 3 - Run a specific test case
user@host:admin$ carbide-admin-cli machine-validation on-demand start -m fm100htq54dmt805ck6k95dfd44itsufqiidd4acrdt811t92hvvlacm8gg --allowed-tests forge_CudaSample
Usecase 4 - Run un verified forge_CudaSample test case
user@host:admin$ carbide-admin-cli machine-validation on-demand start -m fm100htq54dmt805ck6k95dfd44itsufqiidd4acrdt811t92hvvlacm8gg --run-unverfied-tests --allowed-tests forge_CudaSample
View results
Feature shows progress of the on-going machine validation
user@host:admin$ carbide-admin-cli machine-validation runs show --help
Show Runs
    Usage: carbide-admin-cli machine-validation runs show [OPTIONS]

    Options:

    -m, --machine <MACHINE>  Show machine validation runs of a machine

        --history            run history

        --extended           Extended result output.

    -h, --help               Print help

    user@host:admin$ carbide-admin-cli machine-validation runs show   -m fm100htq54dmt805ck6k95dfd44itsufqiidd4acrdt811t92hvvlacm8gg

    +--------------------------------------+-------------------------------------------------------------+-----------------------------+-----------------------------+-----------+------------------------+

    | Id                                   | MachineId                                                   | StartTime                   | EndTime

        | Context   | State                  |

    +======================================+=============================================================+=============================+=============================+===========+========================+

    | b8df2faf-dc6e-402d-90ca-781c63e380b9 | fm100htq54dmt805ck6k95dfd44itsufqiidd4acrdt811t92hvvlacm8gg | 2024-12-02T22:54:47.997398Z | 2024-12-02T23:22:00.396804Z | Discovery | InProgress(InProgress) |

    +--------------------------------------+-------------------------------------------------------------+-----------------------------+-----------------------------+-----------+------------------------+

    | 539cea32-60ae-4863-8991-8b8e3c726717 | fm100htq54dmt805ck6k95dfd44itsufqiidd4acrdt811t92hvvlacm8gg | 2025-01-09T14:12:23.243324Z | 2025-01-09T16:51:32.110006Z | OnDemand  | Completed(Success)     |

    +--------------------------------------+-------------------------------------------------------------+-----------------------------+-----------------------------+-----------+------------------------+
To view individual completed test results, by default the result command shows only last run tests in each individual context**(Discovery,Ondemand, Cleanup)**.
user@host:admin$ carbide-admin-cli machine-validation results show --help
Show results
    Usage: carbide-admin-cli machine-validation results show [OPTIONS] <--validation-id <VALIDATION_ID>|--test-name <TEST_NAME>|--machine <MACHINE>>

    Options:

    -m, --machine <MACHINE>              Show machine validation result of a machine

    -v, --validation-id <VALIDATION_ID>  Machine validation id

    -t, --test-name <TEST_NAME>          Name of the test case

        --history                        Results history

        --extended                       Extended result output.

    -h, --help                           Print help

    user@host:admin$ carbide-admin-cli machine-validation results   show   -m fm100htq54dmt805ck6k95dfd44itsufqiidd4acrdt811t92hvvlacm8gg

    +--------------------------------------+----------------+-----------+----------+-----------------------------+-----------------------------+

    | RunID                                | Name           | Context   | ExitCode | StartTime                   | EndTime                     |

    +======================================+================+===========+==========+=============================+=============================+

    | b8df2faf-dc6e-402d-90ca-781c63e380b9 | CPUTestLong    | Discovery | 0        | 2024-12-02T23:08:04.063057Z | 2024-12-02T23:10:03.463683Z |

    +--------------------------------------+----------------+-----------+----------+-----------------------------+-----------------------------+

    | b8df2faf-dc6e-402d-90ca-781c63e380b9 | MemoryTestLong | Discovery | 0        | 2024-12-02T23:10:03.533416Z | 2024-12-02T23:12:06.060216Z |

    +--------------------------------------+----------------+-----------+----------+-----------------------------+-----------------------------+

    | b8df2faf-dc6e-402d-90ca-781c63e380b9 | MqStresserLong | Discovery | 0        | 2024-12-02T23:12:06.134385Z | 2024-12-02T23:14:07.589445Z |

    +--------------------------------------+----------------+-----------+----------+-----------------------------+-----------------------------+

    | b8df2faf-dc6e-402d-90ca-781c63e380b9 | DcgmFullLong   | Discovery | 0        | 2024-12-02T23:14:07.801503Z | 2024-12-02T23:20:11.166087Z |

    +--------------------------------------+----------------+-----------+----------+-----------------------------+-----------------------------+

    | b8df2faf-dc6e-402d-90ca-781c63e380b9 | ForgeRunBook   | Discovery | 0        | 2024-12-02T23:20:30.427153Z | 2024-12-02T23:22:00.202657Z |

    +--------------------------------------+----------------+-----------+----------+-----------------------------+-----------------------------+

    | 539cea32-60ae-4863-8991-8b8e3c726717 | CudaSample     | OnDemand  | 0        | 2025-01-09T16:51:09.046537Z | 2025-01-09T16:51:32.611098Z |

    +--------------------------------------+----------------+-----------+----------+-----------------------------+-----------------------------+
How to add new platform support?
To add a new platform for individual tests
- Get system sku id- # dmidecode -s system-sku-number | tr "[:upper:]" "[:lower:]"
-
 # carbide-admin-cli machine-validation tests update  --test-id  <test_id> --version   <test version> --supported-platforms    <sku>

 Eg: # carbide-admin-cli machine-validation tests update  --test-id  forge_default  --version   V1-T1734009539861341   --supported-platforms    7d9ectOlww
Troubleshooting
Frequently Asked Questions (FAQs)
Contact and Support
slack #swngc-forge-dev
References
SKU Validation
NCX Infra Controller (NICo) supports checking and validating the hardware in a machine, known as "SKU Validation."
Summary
A SKU is a collection of definitions managed by NICo that define a specific configuration of machine. Each host managed by NICo must have a SKU associated with it before it can be made available for use by a tenant (TODO: did we actually implement this?).
Hardware configurations or SKUs are generated from existing machines by an admin and uploaded to forge via the CLI. SKU's can be downloaded for modification or use with other sites.
Machines that are assigned a SKU are automatically validated during ingestion based on their discovery information. Hardware validation occurs during initial ingestion and after an instance is released and new discovery information is received.
New machines are automatically checked against existing SKUs and if a match is found, the machine passes
SKU validation and continues with the normal ingestion process. If no match is found the machine waits until
a matching SKU is available or until the machine is made compatible with an existing SKU, if SKU validation is enabled
in the site (ignore_unassigned_machines configuration option).
Behavior
SKU Validation can be enabled or disabled for a site, however, when it is enabled, it may or may not apply to a given machine. For a machine to have SKU Validation enforced, it must have an assigned SKU, however, note that SKUs will automatically be assigned to machines that match a given SKU, if they are in ready state.
If a machine has an assigned SKU, and NICo (when the machine changes state and is not assigned) detects that the hardware configuration does not match, the machine will have a SKU mismatch health alert placed on it, and it will be prevented from having allocations assigned to it.
Generally, SKUs must be manually added a site to configure its SKUs. At some point, we may do this during the site bring-up process. However, for now, SKUs are only manually added to sites. It is also expected that, generally, the SKU assignments for individual machines are added automatically by NICo as those machines are reconfigured.
BOM Validation States
Verifying a SKU against a machine goes through several steps to aquire updated machine inventory and perform the validation. Depending on the inventory of the machine and the SKU configuration, the state machine needs to handle several situations. The bom validation process is broken down into the following sub-states:
MatchingSku- The state machine will attempt to find an existing SKU that matches the machine inventory.UpdatingInventory- NICo is requesting that scout re-inventory the machine. This ensures that other operations are using a recent version of the machine inventoryVerifyingSku- NICo is comparing the machine inventory against the SKUSkuVerificationFailed- The machine did not match the SKU. Manual intervention is required. Thesku verifycommand may be used to retry the verificationWaitingForSkuAssignment- The machine does not have a SKU assigned and the configuration requires one.SkuMissing- The machine has a SKU assigned, but the SKU does not exist. This happens when a SKU is specified in the expected machines, but was not created. If configured, NICo will attempt to generate a SKU
Versions
NICo maintains a version of the SKU schema used when a SKU is created. This ensures that the same comparison is used during the lifetime of a SKU and ensures that the behavior of BOM validation does not change between NICo versions. When new components are added, or new data sources are used during validation, existing SKUs will not be updated with the change and continue to behave as they did in previous NICo versions. In order to use the new version, a new SKU must be created.
Configuration
SKU validation is enabled or disabled for an entire site at once, using the forge configuration file.
The block that defines it is called bom_validation:
[bom_validation]
enabled = false
ignore_unassigned_machines = false
allow_allocation_on_validation_failure = false
find_match_interval = "300s"
auto_generate_missing_sku = false,
auto_generate_missing_sku_interval = "300s"
enabled- Enables or disables the entire bom validation process. When disabled, machines will skip bom validation and proceed as if all validation has passed.allow_allocation_on_validation_failure- When true, machines are allowed to stay in Ready state and remain allocatable even when SKU validation fails. Validation still occurs but only logs are recorded - health reports are cleared instead of recording validation failures. Machines do not transition into failed states (SkuVerificationFailed, SkuMissing, WaitingForSkuAssignment). When false (default), standard mode applies where validation failures are recorded in health reports and machines enter failed states and become unallocatable until fixed. This is useful for avoiding machine allocation blockage due to SKU validation issues when you only need logging without health report alerts.ignore_unassigned_machines- When true and BOM validation encounters a machine that does not have an associated SKU, it will proceed as if all validation has passed. Only machines with an associated SKU will be validated. This allows existing sites to be upgraded and BOM Validation enabled as SKUs are added to the system without impacting site operation. Machines that do not have an assigned SKU will still be usable and assignable.find_match_interval- determines how often NICo will attempt to find a matching SKU for a machine. NICo will only attempt to find a SKU when the machine is in theReadystate.auto_generate_missing_sku- enable or disable generation of a SKU from a machine. This only applies to a machine with a SKU specified in the expected machine configuration and in theSkuMissingstate.auto_generate_missing_sku_interval- determines how often NICo will attempt to generate a sku from the machine data.
Hardware Validated
Machines will (currently) have the following hardware validated against the SKU:
- Chassis (motherboard): Vendor and model matched
- CPU: Model and count matched
- GPUs: Model, memory capacity, and count matched
- Memory: Type, capacity, and count matched
- Storage: Model and count matched
Design Information
See the design document.
SKU Names
By convention, SKU names (defined per site) are in the following format:
<vendor>.<model>.<node_type>.<idx>
Where:
<vendor>is the first word of the "chassis" "vendor" field, e.g.dellorlenovo<model>is the unique ending to the "chassis" "model" field, e.g.r750orsr670v2<node_type>is one of the following types of node that are deployed in forge:gpucpustoragecontroller(site controller node, if applicable)
<idx>arbitrary index starting at 1 to define different configurations, if required, generally 1
Some example SKU names:
lenovo.sr670v2.gpu.1dell.r750.gpu.1dell.r750.storage.1
Managing SKU Validation
Browse SKUs, their configuration, and assigned machines
You can view all the SKUs for a site, and click into their specific configurations and list assigned machines by visting the admin page for a site and clicking "SKUs" from the left-side navigation bar.
Viewing SKU information
There are 2 commands for showing information related to SKUs:
sku showlists SKUs or shows information related to an existing SKU.sku generateshows what a SKU would look like for a machine. The generate command does not create the SKU or assign the SKU to the machine.
Both commands honor the JSON format flag -f json to change the output to JSON. JSON is used by other commands.
The sku show command can be used to list all SKUs, or show the details of a single SKU:
carbide-admin-cli sku show [<sku id>]

> carbide-admin-cli sku show
+----------------------------------------------------------------+---------------------------------------------------------+------------------------------+-----------------------------+
| ID                                                             | Description                                             | Model                        | Created                     |
+================================================================+=========================================================+==============================+=============================+
| PowerEdge R750 1xGPU 1xIB                                      | PowerEdge R750; 2xCPU; 1xGPU; 128 GiB                   | PowerEdge R750               | 2025-02-27T13:57:19.435162Z |
+----------------------------------------------------------------+---------------------------------------------------------+------------------------------+-----------------------------+

> carbide-admin-cli sku show 'PowerEdge R750 1xGPU 1xIB'
ID                  : PowerEdge R750 1xGPU 1xIB
Schema Version      : 4
Description         : PowerEdge R750; 2xCPU; 1xGPU; 128 GiB
Device Type         :
Model               : PowerEdge R750
Architecture        : x86_64
Created At          : 2025-02-27T13:57:19.435162Z
TPM Version         : 2.0

CPUs:
          +--------------+------------------------------------------+---------+-------+
          | Vendor       | Model                                    | Threads | Count |
          +==============+==========================================+=========+=======+
          | GenuineIntel | Intel(R) Xeon(R) Gold 6354 CPU @ 3.00GHz | 36      | 2     |
          +--------------+------------------------------------------+---------+-------+
GPUs:
          +--------+--------------+------------------+-------+
          | Vendor | Total Memory | Model            | Count |
          +========+==============+==================+=======+
          | NVIDIA | 81559 MiB    | NVIDIA H100 PCIe | 1     |
          +--------+--------------+------------------+-------+
Memory (128 GiB):
          +------+----------+-------+
          | Type | Capacity | Count |
          +======+==========+=======+
          | DDR4 | 16 GiB   | 8     |
          +------+----------+-------+
IB Devices:
          +-----------------------+-----------------------------+-------+------------------+
          | Vendor                | Model                       | Count | Inactive Devices |
          +=======================+=============================+=======+==================+
          | Mellanox Technologies | MT28908 Family [ConnectX-6] | 2     | [0,1]            |
          +-----------------------+-----------------------------+-------+------------------+
The sku generate command can be used to show what would match a given machine.
carbide-admin-cli sku generate <machineid>

> carbide-admin-cli sku generate fm100hts7tqfqtgn3imi7ipd2jk7r37idk5r4aa41krpcelg498hasoqtkg
ID                  : PowerEdge R750 1xGPU 1xIB
Schema Version      : 4
Description         : PowerEdge R750; 2xCPU; 1xGPU; 128 GiB
Device Type         :
Model               : PowerEdge R750
Architecture        : x86_64
Created At          : 2025-02-27T13:57:19.435162Z
TPM Version         : 2.0

CPUs:
          +--------------+-------------------------------+---------+-------+
          | Vendor       | Model                         | Threads | Count |
          +==============+===============================+=========+=======+
          | GenuineIntel | Intel(R) Xeon(R) Silver 4416+ | 40      | 2     |
          +--------------+-------------------------------+---------+-------+
GPUs:
          +--------+--------------+-------+-------+
          | Vendor | Total Memory | Model | Count |
          +========+==============+=======+=======+
          +--------+--------------+-------+-------+
Memory (256 GiB):
          +------+----------+-------+
          | Type | Capacity | Count |
          +======+==========+=======+
          | DDR5 | 16 GiB   | 16    |
          +------+----------+-------+
IB Devices:
          +--------+-------+-------+------------------+
          | Vendor | Model | Count | Inactive Devices |
          +========+=======+=======+==================+
          +--------+-------+-------+------------------+
Storage Devices:
          +----------------------------+-------+
          | Model                      | Count |
          +============================+=======+
          | Dell DC NVMe CD7 U.2 960GB | 1     |
          +----------------------------+-------+
          | KIOXIA KCD8DRUG7T68        | 8     |
          +----------------------------+-------+
Creating SKUs for a Site
To create a SKU, the easiest method is generally taking the configuration of an example, known good machine (this can be verified during creation) and applying that to the site.
Using information from the viewed SKU information above (vendor, model, and node type), you should be able to
create the sku_name, and using the example machine, then create the SKU config and upload it to the
site controller.
Save the SKU information (on your local machine, written to an output file):
carbide-admin-cli -f json -o <sku_name>.json sku generate <machineid> --id <sku_name>
This will create a file in the current directory with the name <sku_name>.json, at this point you can create the
SKU on the site controller:
carbide-admin-cli sku create <sku_name>.json
Assign a SKU to a machine
Note that generally, you do not need to assign a SKU to a machine, since the SKU is automatically assigned when the machine goes to ready (not assigned) state, or goes through a machine validation workflow.
carbide-admin-cli sku assign <sku_name> <machineid>
Remove a SKU assignment from a machine
To remove the assignment of a SKU from a machine, the sku unassign can be used. Note that if a machine already matches
a SKU in the given site, and it is not in an assigned state, it will likely be quickly reassigned automatically by
the site controller after this command is run.
carbide-admin-cli sku unassign <machineid>
Replacing an existing SKU
If a SKU has a set of components that do not work for a set of machines (either due to bugs, or Carbide software updates) updating machines by unassigning and assigning a SKU would be challenging. Replacing the components of a SKU can be done with the sku replace command. This will force all machines to go through verification when no instance is allocated to the machine (all machines are verified when an instance is released).
forge-acmin-cli sku replace <filename> [--id <sku_name>]
Remove a SKU from a site
To remove a SKU from a site, you must first remove all machines that have been assigned that SKU manually, you may want
to run the sku unassign command above in a shell loop to remove all the machines quickly. Note that you can query which
machines have a given SKU using the command below, sku show-machines then follow it with the
following command to remove the SKU:
carbide-admin-cli sku delete <sku_name>
Upgrading a SKU to the current version example
When a new version of NICo is released that changes how SKUs behave, existing SKUs maintain their previous behavior. In order to use the new version of the SKU, a manual "upgrade" process is required using the the sku replace command.
The existing SKU is below. Note that the "Storage Devices" section includes a device with a model of "NO_MODEL" and there is no TPM. The extra storage device is created by the raid card and may not always exist and should not have been included in the SKU.
carbide-admin-cli sku show XE9680
ID:              XE9680
Schema Version:  2
Description:     PowerEdge XE9680; 2xCPU; 8xGPU; 2 TiB
Device Type:
Model:           PowerEdge XE9680
Architecture:    x86_64
Created At:      2025-04-18T16:30:58.748991Z
CPUs:
          +--------------+---------------------------------+---------+-------+
          | Vendor       | Model                           | Threads | Count |
          +==============+=================================+=========+=======+
          | GenuineIntel | Intel(R) Xeon(R) Platinum 8480+ | 56      | 2     |
          +--------------+---------------------------------+---------+-------+
GPUs:
          +--------+--------------+-----------------------+-------+
          | Vendor | Total Memory | Model                 | Count |
          +========+==============+=======================+=======+
          | NVIDIA | 81559 MiB    | NVIDIA H100 80GB HBM3 | 8     |
          +--------+--------------+-----------------------+-------+
Memory (2 TiB):
          +------+----------+-------+
          | Type | Capacity | Count |
          +======+==========+=======+
          | DDR5 | 64 GiB   | 32    |
          +------+----------+-------+
IB Devices:
          +--------+-------+-------+------------------+
          | Vendor | Model | Count | Inactive Devices |
          +========+=======+=======+==================+
          +--------+-------+-------+------------------+
Storage Devices:
          +----------------------------------+-------+
          | Model                            | Count |
          +==================================+=======+
          | Dell Ent NVMe FIPS CM6 RI 3.84TB | 8     |
          +----------------------------------+-------+
          | NO_MODEL                         | 1     |
          +----------------------------------+-------+
Using the sku generate command, we can see what the updated SKU looks like for the same machine. This is the same machine that generated the older SKU in a previous release. Note that the "NO_MODEL" device is gone, the RAID controller is now shown as Dell BOSS-N1 and the version of the TPM is shown.
carbide-admin-cli sku generate fm100hti7olik00gefc9qlma831n6q49d1odkksp86q639cugt5afjnm4s0
ID                  : PowerEdge R750 1xGPU 1xIB
Schema Version      : 4
Description         : PowerEdge R750; 2xCPU; 1xGPU; 128 GiB
Device Type         :
Model               : PowerEdge R750
Architecture        : x86_64
Created At          : 2025-02-27T13:57:19.435162Z
TPM Version         : 2.0

CPUs:
          +--------------+---------------------------------+---------+-------+
          | Vendor       | Model                           | Threads | Count |
          +==============+=================================+=========+=======+
          | GenuineIntel | Intel(R) Xeon(R) Platinum 8480+ | 56      | 2     |
          +--------------+---------------------------------+---------+-------+
GPUs:
          +--------+--------------+-----------------------+-------+
          | Vendor | Total Memory | Model                 | Count |
          +========+==============+=======================+=======+
          | NVIDIA | 81559 MiB    | NVIDIA H100 80GB HBM3 | 8     |
          +--------+--------------+-----------------------+-------+
Memory (2 TiB):
          +------+----------+-------+
          | Type | Capacity | Count |
          +======+==========+=======+
          | DDR5 | 64 GiB   | 32    |
          +------+----------+-------+
IB Devices:
          +--------+-------+-------+------------------+
          | Vendor | Model | Count | Inactive Devices |
          +========+=======+=======+==================+
          +--------+-------+-------+------------------+
Storage Devices:
          +----------------------------------+-------+
          | Model                            | Count |
          +==================================+=======+
          | Dell BOSS-N1                     | 1     |
          +----------------------------------+-------+
          | Dell Ent NVMe FIPS CM6 RI 3.84TB | 8     |
          +----------------------------------+-------+
Create a new SKU file using the generate command again, but create a json file. Note that the same ID needs to be specified as the existing SKU in order for the replace command to find the old SKU.
carbide-admin-cli -f json -o /tmp/xe9680.json sku g fm100hti7olik00gefc9qlma831n6q49d1odkksp86q639cugt5afjnm4s0 --id XE9680
Then replace the old SKU
carbide-admin-clisku replace /tmp/xe9680.json
+--------+---------------------------------------+------------------+-----------------------------+
| ID     | Description                           | Model            | Created                     |
+========+=======================================+==================+=============================+
| XE9680 | PowerEdge XE9680; 2xCPU; 8xGPU; 2 TiB | PowerEdge XE9680 | 2025-04-18T16:30:58.748991Z |
+--------+---------------------------------------+------------------+-----------------------------+
The show sku command now shows the updated components (and version)
carbide-admin-cli sku show XE9680
ID                  : XE9680
Schema Version      : 4
Description         : PowerEdge R750; 2xCPU; 1xGPU; 128 GiB
Device Type         :
Model               : PowerEdge R750
Architecture        : x86_64
Created At          : 2025-02-27T13:57:19.435162Z
TPM Version         : 2.0

CPUs:
          +--------------+---------------------------------+---------+-------+
          | Vendor       | Model                           | Threads | Count |
          +==============+=================================+=========+=======+
          | GenuineIntel | Intel(R) Xeon(R) Platinum 8480+ | 56      | 2     |
          +--------------+---------------------------------+---------+-------+
GPUs:
          +--------+--------------+-----------------------+-------+
          | Vendor | Total Memory | Model                 | Count |
          +========+==============+=======================+=======+
          | NVIDIA | 81559 MiB    | NVIDIA H100 80GB HBM3 | 8     |
          +--------+--------------+-----------------------+-------+
Memory (2 TiB):
          +------+----------+-------+
          | Type | Capacity | Count |
          +======+==========+=======+
          | DDR5 | 64 GiB   | 32    |
          +------+----------+-------+
IB Devices:
          +--------+-------+-------+------------------+
          | Vendor | Model | Count | Inactive Devices |
          +========+=======+=======+==================+
          +--------+-------+-------+------------------+
Storage Devices:
          +----------------------------------+-------+
          | Model                            | Count |
          +==================================+=======+
          | Dell BOSS-N1                     | 1     |
          +----------------------------------+-------+
          | Dell Ent NVMe FIPS CM6 RI 3.84TB | 8     |
          +----------------------------------+-------+
Finding assigned machines for a SKU
To find all the assigned machines for a given SKU:
carbide-admin-cli sku show-machines <sku_name>
Force SKU revalidation
It may be beneficial when diagnosing a machine to force NICo to revalidate a SKU on a machine, if the machine is suspected of issues, or if you believe that the validation may be out of date. You can force a revalidation with the command below, it will be validated the next time the machine is unassigned. Note that you cannot validate an assigned machine, and NICo will refrain from doing so automatically.
carbide-admin-cli sku verify <sku_name>
Issues
What to do if a machine is failing validation
For a given machine, if it has already been assigned a SKU manually or automatically, it likely was correct at some point, and the effort of the investigation should be to determine what has changed on the machine to cause it to now fail validation.
For example, the machine may have gone through maintenance and is now missing one of its GPUs or
storage drives. The health alert generated by failing the validation should provide some context
as to where the mismatch is believed to be. Using this, it should be possible to diagnose if the
machine is actually configured incorrectly, or in the case that the new configuration should be
correct, you can remove the SKU from the machine sku unassign and create a new SKU as shown
above to represent this machine.
NVLink Partitioning
NVIDIA NVLink is a high-speed interconnect technology that allows for memory-sharing between GPUs. Sharing is allowed between all GPUs in an NVLink partition, and a partition is made up of GPUs within the same NVLink domain, which can be a single NVL72 rack or two NVL36 racks cabled together.
NCX Infra Controller (NICo) allows you to do the following with NVLink:
- Create, update, and delete NVLink partitions using the NICo API.
- Allocate instances to NVLink domains without knowledge of the underlying NVLink topology.
- Monitor NVLink partition status using telemetry.
NICo extends the concept of an NVLink partition with the logical partition structure, which allows users to manage NVLink partitions without knowing the datacenter topology. NICo users interact with logical partitions through the instance creation process, as described in the following sections.
Note: The following steps only apply to creating instances for GB200 compute nodes.
Creating a Logical Partition
NICo users can create logical partitions and manually assign instances to them (as described in steps 1-2). NICo can also automatically generate logical partitions and assign instances to them (as described in step 3).
-
The user creates a logical partition using the
POST /v2/org/{org}/nico/nvlink-logical-partitioncall. NICo creates an entry in the database and returns a logical partition ID. At this point, there is no underlying NVLink partition associated with the logical partition. -
When creating an instance, the user can specify a logical partition for the instance by passing the logical partition ID with the
POST /v2/org/{org}/carbide/instancecall.a. If this is the first instance to be added to the logical partition, NICo will create a new NVLink partition and add the instance GPUs to it.
Note: To ensure that machines in the same rack are assigned to the same partition, create one instance type per rack.
-
If the users does not specify a logical partition when creating an instance, NICo will perform the following steps:
a. NICo automatically generates a logical partition with the name
<vpc-name>-default.b. NICo creates a new NVLink partition and adds the instance GPUs to it.
c. When the user creates additional instances within the same VPC, NICo will add the instance GPUs to the same logical partition, as well as the same NVLink partition if there is space in the rack.
d. If there is no space in the rack, NICo will create a new NVLink partition within the same logical partition and add the instance GPUs to it.
Important: When NICo creates a new NVLink partition within the same logical partition, the new instance GPUs in the logical partition will not be able to share memory with the other instances that were previously added to the logical partition.
Removing Instances from a Logical Partition
If a NICo user de-provisions an instance, NICo will remove the instance GPUs from the logical partition.
Deleting a Logical Partition
A NICo user can call DELETE /v2/org/{org}/nico/nvlink-logical-partition/{nvLinkLogicalPartitionId} to delete a logical partition. This call will only succeed if there are no physical partitions associated with the logical partition.
Retrieving Partition Information for an Instance
A NICo user can call GET /v2/org/{org}/nico/instance/{instance-id} to retrieve information about an instance. As part of the 200 response body, NICo will return a nvLinkInterfaces list that includes both the nvLinkLogicalPartitionId and nvLinkDomainId for each GPU in the instance.
The nvLinkDomainId can be useful in some use cases. For example, when NICo is being used to provide Virtual Machines as a Service (VMaaS), instances are created up front with no NVLink partition configured yet. Then, when a user spins up a virtual machine (VM), VMaaS schedules it on one of these instances. Once the user has a group of VMs, they configure an NVLink partition. However, the instances selected by VMaaS may all be in different NVLink domains, and won't be able to be added to a single partition. The NVLink domain IDs can be used by the VMaaS to make an informed decision regarding where to schedule the VMs.
Release Instance API Enhancements
What's New
The Release Instance API for NCX Infra Controller (NICo) now supports issue reporting and automated repair workflows. When releasing an instance, you can report problems to help improve system reliability.
Key Features
- Report Issues: Hardware, Network, Performance, or Other problems
- Auto-Repair: Makes machines available for repair plugins/systems to fix issues
- Repair Integration: Special handling for repair systems
- Enhanced Labels: Machine metadata labels for repair status tracking
Quick Start
REST API:
Basic Release (No Issues)
curl -X POST /api/v1/instances/release \
  -d '{"id": "instance-12345"}'
Release with Issue Report
curl -X POST /api/v1/instances/release \
  -d '{
    "id": "instance-12345",
    "issue": {
      "category": "HARDWARE",
      "summary": "Memory errors during training",
      "details": "Job crashed with ECC errors on DIMM slot 2"
    }
  }'
Issue Categories
| Category | When to Use | Examples |
|---|---|---|
| HARDWARE | Physical component failures | Memory errors, GPU failures, disk problems |
| NETWORK | Connectivity issues | Slow InfiniBand, packet loss, timeouts |
| PERFORMANCE | Slower than expected | Thermal throttling, reduced GPU performance |
| OTHER | Software/config issues | Driver problems, CUDA version mismatches |
What Happens When You Report Issues
When you release an instance with issue reporting, the system automatically takes several actions to fix the machine and prevent the issue-reported machine from being allocated to tenants until resolved:
Immediate Actions
- Health Override Application - Marks machine with health status and prevents new allocations
- Issue Logging - Records problem details for tracking and analysis
- Auto-Repair Signal - Makes machine available for repair plugins to act on (if enabled)
Health Override Types
The system uses two complementary health overrides to manage the repair workflow:
| Override | Purpose | Behavior | When Applied |
|---|---|---|---|
tenant-reported-issue | Documents tenant-reported problems | Prevents machine allocation until resolved | Always when issue is reported |
repair-request | Signals automated repair needed | Triggers breakfix system to claim machine | When auto-repair is enabled or manually applied |
Auto-Repair Behavior
- Enabled: Machine gets both overrides (
tenant-reported-issue+repair-request) - repair plugins can act on the machine - Disabled: Machine gets only
tenant-reported-issueoverride (manual intervention needed)
NICo - Breakfix Integration Workflow
Workflow Overview
The breakfix integration follows this automated repair cycle:
- Issue Reporting: Tenant releases instance and reports hardware/software problems via API
- Health Override Application: System applies appropriate health overrides based on configuration
- Repair System Activation: Breakfix system detects machines marked for repair and claims them
- Automated Repair: Repair tenant diagnoses and fixes the reported issues
- Validation & Release: Successfully repaired machines return to the available pool
Stage Details
- Normal Operation: Machine serves tenant workloads without issues
- Issue Reported: Tenant releases instance with problem details via API
- Quarantined: Machine marked with health overrides, preventing new allocations
- Repair Process:
- If auto-repair enabled: Repair plugins automatically attempt fixes
- If auto-repair disabled: Manual intervention required by operations team
- Resolution: Machine either gets repaired successfully or escalated for further action
- Return to Pool: Successfully repaired machines with
repair_status="Completed"return to the available pool
Repair Status Labels
Repair systems use machine metadata labels to communicate repair outcomes back to Forge:
Critical Label: repair_status
| Value | Meaning | Result |
|---|---|---|
"Completed" | Repair successful | Machine returns to available pool |
"Failed" | Repair couldn't fix issue | Escalated to operations team |
"InProgress" | Repair still running | Treated as failed if instance released |
⚠️ Important: Repair systems must set
repair_statusbefore releasing instances. Missing or invalid labels result in failed repair handling.
Optional Labels
repair_details: Explanation of what was done (e.g.,"thermal_paste_replaced")repair_eta: Expected completion time for planning purposes
Configuration
Auto-Repair Settings
>>carbide-api-site-config.toml
...
[auto_machine_repair_plugin]
enabled = true
...
Frequently Asked Questions (FAQ)
Q1: Tenant releases machine reporting issue but auto_machine_repair_plugin.enabled is false
Scenario: A tenant calls the release API with issue details, but automatic repair is disabled in the site configuration.
What happens:
- Machine is released and marked with issue details
- Health override
tenant-reported-issueIS applied (issue is documented) - Health override
repair-requestis NOT applied (no automatic repair triggered) - Machine becomes unavailable for normal allocation due to tenant-reported-issue override
Resolution:
# Check current configuration (requires server access to config file)
# Auto-repair setting is in carbide-api-site-config.toml

# Manually trigger repair using health override
carbide-admin-cli machine health-override add <machine-id> --template RequestRepair \
  --message "Manual repair trigger for tenant-reported issue"

# To enable auto-repair site-wide, update carbide-api-site-config.toml:
# [auto_machine_repair_plugin]
# enabled = true
Best Practice: Enable auto-repair in production environments to ensure tenant-reported issues are automatically handled.
Q2: Tenant releases machine reporting issue but repair tenant hasn't picked up the machine
Scenario: Auto-repair is enabled, tenant reports issue, health override is applied, but repair tenant hasn't started working on the machine.
What happens:
- Machine gets
tenant-reported-issuehealth override (documents the issue) - Machine gets
repair-requesthealth override (signals repair system) - Machine becomes unavailable for normal tenant allocation
- Repair plugins should detect and claim the machine
- If repair tenant doesn't pick up machine, it remains in limbo
Troubleshooting:
# Check machine status and health overrides
carbide-admin-cli machine show <machine-id>
carbide-admin-cli machine health-override show <machine-id>

# Check repair system status (requires monitoring tools)
# - Check repair tenant instances
# - Verify repair system connectivity

# Manually assign repair override if needed
carbide-admin-cli machine health-override add <machine-id> --template RequestRepair \
  --message "Manual assignment for repair system"
Common Causes:
- Repair tenant is at capacity
- Repair plugins are not running
- Machine doesn't match repair tenant's allocation criteria
- Network connectivity issues between repair systems
Q3: Repair tenant releases machine as "fixed" but machine still needs repair
Scenario: Repair tenant completes work and releases machine claiming it's fixed, but the underlying issue persists.
What happens:
- Health override
repair-requestis removed (repair claimed complete) - If repair tenant reports new issues:
tenant-reported-issueoverride is applied - If repair tenant reports new issues: Machine does NOT return to available pool
- If no new issues reported: Both overrides removed, machine returns to available pool
- Auto-repair is NOT triggered again (prevents infinite repair loops)
Detection and Response:
# Check machine status and current health overrides
carbide-admin-cli machine show <machine-id>
carbide-admin-cli machine health-override show <machine-id>

# Check repair work status (requires access to repair system logs)
# - Review repair tenant instance logs
# - Check repair system monitoring

# If issue persists, escalate to manual intervention
carbide-admin-cli machine health-override add <machine-id> --template OutForRepair \
  --message "Repair unsuccessful, requires manual investigation"
Prevention:
- Implement repair validation tests
- Require repair tenants to provide detailed fix reports
- Set up monitoring to detect recurring issues on same machines
- Establish escalation procedures for failed repairs
Q4: Repair tenant successfully fixes machine and reports completion
Scenario: The ideal case where repair tenant successfully resolves the issue and properly reports completion.
What happens:
- Repair tenant releases machine with success status (repair_status = "Completed")
- Health override
repair-requestis automatically removed - Health override
tenant-reported-issueis automatically removed - Machine returns to healthy, available state
- Machine becomes available for normal tenant allocation
Verification Steps:
# Confirm machine is healthy and available
carbide-admin-cli machine show <machine-id>

# Check that health overrides are cleared
carbide-admin-cli machine health-override show <machine-id>

# Verify machine status (should show as available)
# Machine should appear in normal allocation pool

# Review repair work (requires access to repair system)
# - Check repair tenant instance completion status
# - Review repair system logs and reports
Success Indicators:
- ✅ Machine status:
Available - ✅ Health overrides: None or only non-blocking ones
- ✅ Recent allocation tests pass
- ✅ Repair logs show successful completion
- ✅ No recurring issues reported
Q5: Repair tenant releases machine without setting repair_status
Scenario: Repair tenant completes work and releases machine but forgets to set the repair_status metadata or sets it to something other than "Completed".
What happens:
- Machine has existing
repair-requesthealth override - Repair tenant releases machine without
repair_status = "Completed" - System treats this as failed/incomplete repair
- Health override
repair-requestis automatically removed - Health override
tenant-reported-issueis applied (or updated if already exists) - Machine does NOT return to available pool
- Auto-repair is NOT triggered again (prevents infinite loops)
Detection:
# Check machine status after repair tenant release
carbide-admin-cli machine show <machine-id>
carbide-admin-cli machine health-override show <machine-id>

# Look for:
# - repair-request override: REMOVED
# - tenant-reported-issue override: PRESENT
# - Machine status: NOT available for allocation
Resolution:
# If repair was actually successful, manually clear the issue
carbide-admin-cli machine health-override remove <machine-id> tenant-reported-issue

# If repair was incomplete, escalate properly
carbide-admin-cli machine health-override add <machine-id> --template OutForRepair \
  --message "Repair incomplete - requires manual investigation"
Prevention:
- Train repair tenants to always set repair_status metadata
- Implement validation in repair workflows to ensure status is set
- Monitor for machines released by repair tenant without "Completed" status
- Set up alerts for machines with tenant-reported-issue after repair tenant release
Best Practice:
# Repair tenants should always set metadata before release:
# repair_status = "Completed"  # for successful repairs
# repair_status = "Failed"     # for unsuccessful repairs
# repair_status = "InProgress" # repair in progress
General Troubleshooting Commands
Check Auto-Repair Configuration:
# Auto-repair settings are in carbide-api-site-config.toml
# [auto_machine_repair_plugin]
# enabled = true|false

# Check current runtime configuration
carbide-admin-cli version --show-runtime-config
Monitor Issue Reporting:
# Check machine status and health overrides
carbide-admin-cli machine show <machine-id>
carbide-admin-cli machine health-override show <machine-id>

# Monitor machine through repair cycle (requires external monitoring)
Manual Intervention:
# Remove specific health overrides
carbide-admin-cli machine health-override remove <machine-id> repair-request
carbide-admin-cli machine health-override remove <machine-id> tenant-reported-issue

# Apply manual repair override
carbide-admin-cli machine health-override add <machine-id> --template RequestRepair \
  --message "Manual repair assignment"

# Escalate to operations team
carbide-admin-cli machine health-override add <machine-id> --template OutForRepair \
  --message "Automated repair failed, requires manual investigation"
This enhanced API improves system reliability by enabling structured issue reporting, automated repairs, and better coordination between tenants, repair systems, and operations teams.
VPC Routing Profiles
This page describes how to create VPCs based on the routing profile configuration of the site. Routing profile configuration is part of the required baseline server configuration for successful VPC creation.
This page is intended for engineers who are responsible for configuring or operating a production API server.
Core Concepts
VPC
A VPC is the logical network container used for tenant workloads. It defines the tenant boundary for networking behavior and provides the parent context for related resources such as prefixes and segments.
Network Virtualization Type
A VPC has a network_virtualization_type that determines how the platform implements networking for that VPC. There are two supported values:
FNN: The production networking modelETHERNET_VIRTUALIZER: A legacy, deprecated, and not officially supported model. It may still appear in existing objects or older workflows, but it should not be treated as the target model for production planning.
Important: If no virtualization type is supplied when a VPC is created, the API currently defaults the VPC to
ETHERNET_VIRTUALIZER. This default should be understood as compatibility behavior, not as a production recommendation. TheFNNoption should always be sepcified for VPCs on a production site.
Routing Profile Type
A VPC also has a routing_profile_type, which determines the routing policy class associated with that VPC. Supported profile types include the following:
EXTERNALINTERNALMAINTENANCEPRIVILEGED_INTERNAL
This setting determines which routing behavior the VPC is expected to follow.
API Server Routing Profiles
The API server must define the available routing profiles under the fnn.routing_profiles section of the configuration file.
Each entry is keyed by the routing profile name and contains the site-specific routing behavior associated with that profile. This includes whether the profile is treated as internal or external and which route-policy settings apply.
Relationship between network_virtualization_type and routing_profile_type
The network_virtualization_type and routing_profile_type settings are related, but they serve different purposes.
- The
network_virtualization_typedetermines how the VPC is implemented (i.e. it selects the networking model). - The
routing_profile_typedetermines which routing policy the VPC uses. - The API server
fnn.routing_profilesconfiguration defines what each routing profile means at that site.
How the API Selects a VPC Routing Profile
When a VPC is created, the API determines the routing profile as follows:
- If the create request includes
routing_profile_type, that value is used. - If the request does not include
routing_profile_type, the API uses the tenant’srouting_profile_type. - The API then looks for a routing profile with the same name in
fnn.routing_profiles.
The API also enforces privilege boundaries. A VPC cannot request a routing profile that is more privileged than the tenant’s allowed routing profile. For example, a tenant that is limited to EXTERNAL cannot create an INTERNAL VPC.
Why Routing Profile Configuration Is Required in Production
Routing profile resolution is part of standard production-site VPC creation. The API uses the selected routing profile during VPC setup, including VNI allocation behavior. As a result, a production site must define the routing profiles that tenants and VPCs are expected to use.
Even if a site has legacy objects that use ETHERNET_VIRTUALIZER, production operations should still be planned around the FNN routing-profile model. The presence of the legacy virtualization type does not remove the need for correct FNN routing profile configuration.
Required API Server Configuration
At a minimum, the API server should define every routing profile type that may be assigned to a tenant or used by a VPC.
A representative TOML example is shown below:
[fnn]

[fnn.routing_profiles.EXTERNAL]
internal = false
route_target_imports = []
route_targets_on_exports = []
leak_default_route_from_underlay = false
leak_tenant_host_routes_to_underlay = false

[fnn.routing_profiles.INTERNAL]
internal = true
route_target_imports = []
route_targets_on_exports = []
leak_default_route_from_underlay = false
leak_tenant_host_routes_to_underlay = false
If the site needs to support additional routing profile types, they should also be defined explicitly:
[fnn]

[fnn.routing_profiles.EXTERNAL]
internal = false
route_target_imports = []
route_targets_on_exports = []
leak_default_route_from_underlay = false
leak_tenant_host_routes_to_underlay = false

[fnn.routing_profiles.INTERNAL]
internal = true
route_target_imports = []
route_targets_on_exports = []
leak_default_route_from_underlay = false
leak_tenant_host_routes_to_underlay = false

[fnn.routing_profiles.MAINTENANCE]
internal = true
route_target_imports = []
route_targets_on_exports = []
leak_default_route_from_underlay = false
leak_tenant_host_routes_to_underlay = false

[fnn.routing_profiles.PRIVILEGED_INTERNAL]
internal = true
route_target_imports = []
route_targets_on_exports = []
leak_default_route_from_underlay = false
leak_tenant_host_routes_to_underlay = false
The exact route-target values and leak settings are site-specific, but the profile names must exist and must match the API values exactly.
How Tenant Routing Profiles Affect VPC Creation
Each tenant may have a routing_profile_type. In a production site, this serves as the default routing profile for VPCs created under that tenant. This has two important consequences:
- If a VPC creation request does not specify
routing_profile_type, the tenant's routing profile is used automatically. - If the tenant is configured with a profile that is not present in
fnn.routing_profiles, VPC creation will fail.
For this reason, tenant configuration and API server routing profile configuration must be managed together.
Changing a Tenant’s Routing Profile
A tenant's routing profile can only be changed if the tenant has no active VPCs. Otherwise, the API server rejects the update.
This restriction exists because VPC behavior depends on the tenant's permitted routing profile, and changing the tenant's profile while VPCs already exist could invalidate assumptions made when those VPCs were created.
Process for Changing a Tenant's Routing Profile
The following is a safe operational sequence for changing a tenant's routing profile:
- Confirm that the destination routing profile is already defined in
fnn.routing_profileson the API server. - Verify that the tenant has no active VPCs.
- Update the tenant's
routing_profile_type. - Create new VPCs for that tenant using the updated profile policy.
If the tenant has active VPCs, those VPCs must be deleted before the tenant profile can be changed.
Using the admin-cli
The REST API currently creates tenants with a default routing-profile of EXTERNAL.
For deployments where this is insufficient, the gRPC admin-cli supports tenant profile updates through the tenant update command.
The tenant organization ID is required as a positional argument:
admin-cli tenant update <tenant-org> -p <profile>
Examples
admin-cli tenant update example-org -p external
admin-cli tenant update example-org -p internal
admin-cli tenant update example-org -p privileged-internal
admin-cli tenant update example-org -p maintenance
The following are supported CLI values:
externalinternalprivileged-internalmaintenance
This is the recommended workflow for changing a tenant's routing profile using the admin-cli:
-
Review the current tenant record:
admin-cli tenant show <tenant-org> -
Confirm that the tenant has no active VPCs.
-
Apply the update:
admin-cli tenant update <tenant-org> -p internal
The CLI also supports an optional version-match flag:
admin-cli tenant update <tenant-org> -p internal -v <current-version>
This flag is optional. It is not a verbosity setting, but is used for optimistic concurrency checking and causes the update to be rejected if the tenant record has changed since it was last reviewed.
If the tenant still has active VPCs, the command will fail. In this case, the existing VPCs must be removed before the tenant routing profile can be changed.
Operational implication
This means the tenant routing profile should be treated as a planning decision rather than a casual runtime toggle. It is possible to change, but only when the tenant has been returned to a state with no active VPCs.
Troubleshooting Example
Consider the following example error returned during VPC creation:
routing_profile_type not found: EXTERNAL
This error should be interpreted as a routing profile lookup failure during VPC creation.
What This Means
The API determined that the effective routing profile type of the VPC was EXTERNAL. It then attempted to look up a routing profile named EXTERNAL in the fnn.routing_profiles configuration for the API server. That lookup failed because no matching entry was defined.
Why This Happens
This commonly occurs in the following situations:
- The tenant's routing profile type is
EXTERNAL, and the VPC request did not override it. - The VPC request explicitly requested
EXTERNAL. - The API server configuration does not contain
[fnn.routing_profiles.EXTERNAL]. - The configuration contains a similar profile, but the key name does not exactly match
EXTERNAL.
How to Resolve This Issue
The appropriate resolution is to add the missing routing profile definition to the API server configuration and ensure that the tenant and VPC are using a profile that is intentionally supported by the site.
A minimal TOML example is shown below:
[fnn]

[fnn.routing_profiles.EXTERNAL]
internal = false
route_target_imports = []
route_targets_on_exports = []
leak_default_route_from_underlay = false
leak_tenant_host_routes_to_underlay = false
After adding the profile, also verify the following:
- The tenant exists.
- The tenant's
routing_profile_typeis the one you intend to use. - The VPC request is either inheriting the correct tenant profile or explicitly requesting the correct profile.
- The profile name in the configuration exactly matches the API value.
Broader Lessons
This example illustrates an important operational rule: In a production site, all routing profile types that may be assigned to tenants or requested by VPCs must already be defined in the API server configuration.
Additional Troubleshooting Checklist
When investigating VPC creation failures related to routing profiles, the following checks are recommended:
- Confirm that
FNNis enabled on the site. - Confirm that the required routing profile exists under
fnn.routing_profiles. - Confirm that the profile name is spelled exactly as expected.
- Check the tenant’s
routing_profile_type. - Check whether the VPC request explicitly supplied the
routing_profile_type. - Confirm that the requested or inherited routing profile is permitted for that tenant.
- Confirm that the routing profile definitions needed by the site are present before creating or updating tenants and VPCs.
VPC Peering
VPC peering allows you to connect two VPCs together, enabling bi-directional network communication between instances in different VPCs. This page explains how to manage VPC peering connections using carbide-admin-cli.
VPC Peering Commands
The carbide-admin-cli vpc-peering command provides three main operations:
carbide-admin-cli vpc-peering <COMMAND>

Commands:
  create  Create VPC peering connection
  show    Show list of VPC peering connections
  delete  Delete VPC peering connection
Creating VPC Peering Connections
To create a new VPC peering connection between two VPCs:
carbide-admin-cli vpc-peering create <VPC1_ID> <VPC2_ID>
Example:
carbide-admin-cli vpc-peering create e65a9d69-39d2-4872-a53e-e5cb87c84e75 366de82e-1113-40dd-830a-a15711d54ef1
Notes:
- The operator should confirm with both VPC owners (VPC tenant org) that they approve the peering before creating the connection
- The VPC IDs can be provided in any order
- The system will automatically enforce canonical ordering (smaller ID becomes
vpc1_id) - If a peering connection already exists between the two VPCs, the command will return error indicating a peering connection already exists
- Both VPCs must exist before creating the peering connection
Listing VPC Peering Connections
To view VPC peering connections, you can either show all connections or filter by a specific VPC:
Show all peering connections:
carbide-admin-cli vpc-peering show
Show peering connections for a specific VPC:
carbide-admin-cli vpc-peering show --vpc-id <VPC_ID>
Example:
# Show all peering connections
carbide-admin-cli vpc-peering show

# Show peering connections for a specific VPC
carbide-admin-cli vpc-peering show --vpc-id 550e8400-e29b-41d4-a716-446655440000
The output will display:
- Peering connection ID
- VPC1 ID (smaller UUID)
- VPC2 ID (larger UUID)
- Connection status
- Creation timestamp
Deleting VPC Peering Connections
To delete an existing VPC peering connection:
carbide-admin-cli vpc-peering delete <PEERING_CONNECTION_ID>
Example:
carbide-admin-cli vpc-peering delete 123e4567-e89b-12d3-a456-426614174000
Notes:
- You need the peering connection ID (not the VPC IDs) to delete a connection
- Use the
showcommand to find the peering connection ID
NCX Infra Controller (NICo) core metrics
This file contains a list of metrics exported by NCX Infra Controller (NICo). The list is auto-generated from an integration test (test_integration). Metrics for workflows which are not exercised by the test are missing.
| Name | Type | Description | |
| carbide_active_host_firmware_update_count | gauge | The number of host machines in the system currently working on updating their firmware. | |
| carbide_api_db_queries_total | counter | The amount of database queries that occured inside a span | |
| carbide_api_db_span_query_time_milliseconds | histogram | Total time the request spent inside a span on database transactions | |
| carbide_api_grpc_server_duration_milliseconds | histogram | Processing time for a request on the carbide API server | |
| carbide_api_ready | gauge | Whether the Forge Site Controller API is running | |
| carbide_api_tls_connection_attempted_total | counter | The amount of tls connections that were attempted | |
| carbide_api_tls_connection_success_total | counter | The amount of tls connections that were successful | |
| carbide_api_tracing_spans_open | gauge | Whether the Forge Site Controller API is running | |
| carbide_api_vault_request_duration_milliseconds | histogram | the duration of outbound vault requests, in milliseconds | |
| carbide_api_vault_requests_attempted_total | counter | The amount of tls connections that were attempted | |
| carbide_api_vault_requests_failed_total | counter | The amount of tcp connections that were failures | |
| carbide_api_vault_requests_succeeded_total | counter | The amount of tls connections that were successful | |
| carbide_api_vault_token_time_until_refresh_seconds | gauge | The amount of time, in seconds, until the vault token is required to be refreshed | |
| carbide_api_version | gauge | Version (git sha, build date, etc) of this service | |
| carbide_available_ips_count | gauge | The total number of available ips in the site | |
| carbide_concurrent_machine_updates_available | gauge | The number of machines in the system that we will update concurrently. | |
| carbide_db_pool_idle_conns | gauge | The amount of idle connections in the carbide database pool | |
| carbide_db_pool_total_conns | gauge | The amount of total (active + idle) connections in the carbide database pool | |
| carbide_dpu_agent_version_count | gauge | The amount of Forge DPU agents which have reported a certain version. | |
| carbide_dpu_firmware_version_count | gauge | The amount of DPUs which have reported a certain firmware version. | |
| carbide_dpus_healthy_count | gauge | The total number of DPUs in the system that have reported healthy in the last report. Healthy does not imply up - the report from the DPU might be outdated. | |
| carbide_dpus_up_count | gauge | The total number of DPUs in the system that are up. Up means we have received a health report less than 5 minutes ago. | |
| carbide_endpoint_exploration_duration_milliseconds | histogram | The time it took to explore an endpoint | |
| carbide_endpoint_exploration_expected_machines_missing_overall_count | gauge | The total number of machines that were expected but not identified | |
| carbide_endpoint_exploration_expected_power_shelves_missing_overall_count | gauge | The total number of power shelves that were expected but not identified | |
| carbide_endpoint_exploration_identified_managed_hosts_overall_count | gauge | The total number of managed hosts identified by expectation | |
| carbide_endpoint_exploration_machines_explored_overall_count | gauge | The total number of machines explored by machine type | |
| carbide_endpoint_exploration_success_count | gauge | The amount of endpoint explorations that have been successful | |
| carbide_endpoint_explorations_count | gauge | The amount of endpoint explorations that have been attempted | |
| carbide_gpus_in_use_count | gauge | The total number of GPUs that are actively used by tenants in instances in the Forge site | |
| carbide_gpus_total_count | gauge | The total number of GPUs available in the Forge site | |
| carbide_gpus_usable_count | gauge | The remaining number of GPUs in the Forge site which are available for immediate instance creation | |
| carbide_hosts_by_sku_count | gauge | The amount of hosts by SKU and device type ('unknown' for hosts without SKU) | |
| carbide_hosts_health_overrides_count | gauge | The amount of health overrides that are configured in the site | |
| carbide_hosts_health_status_count | gauge | The total number of Managed Hosts in the system that have reported any a healthy nor not healthy status - based on the presence of health probe alerts | |
| carbide_hosts_in_use_count | gauge | The total number of hosts that are actively used by tenants as instances in the Forge site | |
| carbide_hosts_usable_count | gauge | The remaining number of hosts in the Forge site which are available for immediate instance creation | |
| carbide_hosts_with_bios_password_set | gauge | The total number of Hosts in the system that have their BIOS password set. | |
| carbide_ib_partitions_enqueuer_iteration_latency_milliseconds | histogram | The overall time it took to enqueue state handling tasks for all carbide_ib_partitions in the system | |
| carbide_ib_partitions_iteration_latency_milliseconds | histogram | The elapsed time in the last state processor iteration to handle objects of type carbide_ib_partitions | |
| carbide_ib_partitions_object_tasks_enqueued_total | counter | The amount of types that object handling tasks that have been freshly enqueued for objects of type carbide_ib_partitions | |
| carbide_ib_partitions_total | gauge | The total number of carbide_ib_partitions in the system | |
| carbide_machine_reboot_duration_seconds | histogram | Time taken for machine/host to reboot in seconds | |
| carbide_machine_updates_started_count | gauge | The number of machines in the system that in the process of updating. | |
| carbide_machine_validation_completed | gauge | Count of machine validation that have completed successfully | |
| carbide_machine_validation_failed | gauge | Count of machine validation that have failed | |
| carbide_machine_validation_in_progress | gauge | Count of machine validation that are in progress | |
| carbide_machine_validation_tests | gauge | The details of machine validation tests | |
| carbide_machines_enqueuer_iteration_latency_milliseconds | histogram | The overall time it took to enqueue state handling tasks for all carbide_machines in the system | |
| carbide_machines_handler_latency_in_state_milliseconds | histogram | The amount of time it took to invoke the state handler for objects of type carbide_machines in a certain state | |
| carbide_machines_in_maintenance_count | gauge | The total number of machines in the system that are in maintenance. | |
| carbide_machines_iteration_latency_milliseconds | histogram | The elapsed time in the last state processor iteration to handle objects of type carbide_machines | |
| carbide_machines_object_tasks_completed_total | counter | The amount of object handling tasks that have been completed for objects of type carbide_machines | |
| carbide_machines_object_tasks_dispatched_total | counter | The amount of types that object handling tasks that have been dequeued and dispatched for processing for objects of type carbide_machines | |
| carbide_machines_object_tasks_enqueued_total | counter | The amount of types that object handling tasks that have been freshly enqueued for objects of type carbide_machines | |
| carbide_machines_object_tasks_requeued_total | counter | The amount of object handling tasks that have been requeued for objects of type carbide_machines | |
| carbide_machines_per_state | gauge | The number of carbide_machines in the system with a given state | |
| carbide_machines_per_state_above_sla | gauge | The number of carbide_machines in the system which had been longer in a state than allowed per SLA | |
| carbide_machines_state_entered_total | counter | The amount of types that objects of type carbide_machines have entered a certain state | |
| carbide_machines_state_exited_total | counter | The amount of types that objects of type carbide_machines have exited a certain state | |
| carbide_machines_time_in_state_seconds | histogram | The amount of time objects of type carbide_machines have spent in a certain state | |
| carbide_machines_total | gauge | The total number of carbide_machines in the system | |
| carbide_machines_with_state_handling_errors_per_state | gauge | The number of carbide_machines in the system with a given state that failed state handling | |
| carbide_measured_boot_bundles_total | gauge | The total number of measured boot bundles. | |
| carbide_measured_boot_machines_per_bundle_state_total | gauge | The total number of machines per a given measured boot bundle state. | |
| carbide_measured_boot_machines_per_machine_state_total | gauge | The total number of machines per a given measured boot machine state. | |
| carbide_measured_boot_machines_total | gauge | The total number of machines reporting measurements. | |
| carbide_measured_boot_profiles_total | gauge | The total number of measured boot profiles. | |
| carbide_network_segments_enqueuer_iteration_latency_milliseconds | histogram | The overall time it took to enqueue state handling tasks for all carbide_network_segments in the system | |
| carbide_network_segments_handler_latency_in_state_milliseconds | histogram | The amount of time it took to invoke the state handler for objects of type carbide_network_segments in a certain state | |
| carbide_network_segments_iteration_latency_milliseconds | histogram | The elapsed time in the last state processor iteration to handle objects of type carbide_network_segments | |
| carbide_network_segments_object_tasks_completed_total | counter | The amount of object handling tasks that have been completed for objects of type carbide_network_segments | |
| carbide_network_segments_object_tasks_dispatched_total | counter | The amount of types that object handling tasks that have been dequeued and dispatched for processing for objects of type carbide_network_segments | |
| carbide_network_segments_object_tasks_enqueued_total | counter | The amount of types that object handling tasks that have been freshly enqueued for objects of type carbide_network_segments | |
| carbide_network_segments_object_tasks_requeued_total | counter | The amount of object handling tasks that have been requeued for objects of type carbide_network_segments | |
| carbide_network_segments_per_state | gauge | The number of carbide_network_segments in the system with a given state | |
| carbide_network_segments_per_state_above_sla | gauge | The number of carbide_network_segments in the system which had been longer in a state than allowed per SLA | |
| carbide_network_segments_state_entered_total | counter | The amount of types that objects of type carbide_network_segments have entered a certain state | |
| carbide_network_segments_state_exited_total | counter | The amount of types that objects of type carbide_network_segments have exited a certain state | |
| carbide_network_segments_time_in_state_seconds | histogram | The amount of time objects of type carbide_network_segments have spent in a certain state | |
| carbide_network_segments_total | gauge | The total number of carbide_network_segments in the system | |
| carbide_network_segments_with_state_handling_errors_per_state | gauge | The number of carbide_network_segments in the system with a given state that failed state handling | |
| carbide_nvlink_partition_monitor_nmxm_changes_applied_total | counter | Number of changes requested to Nmx-M | |
| carbide_pending_dpu_nic_firmware_update_count | gauge | The number of machines in the system that need a firmware update. | |
| carbide_pending_host_firmware_update_count | gauge | The number of host machines in the system that need a firmware update. | |
| carbide_power_shelves_enqueuer_iteration_latency_milliseconds | histogram | The overall time it took to enqueue state handling tasks for all carbide_power_shelves in the system | |
| carbide_power_shelves_iteration_latency_milliseconds | histogram | The elapsed time in the last state processor iteration to handle objects of type carbide_power_shelves | |
| carbide_power_shelves_object_tasks_enqueued_total | counter | The amount of types that object handling tasks that have been freshly enqueued for objects of type carbide_power_shelves | |
| carbide_power_shelves_total | gauge | The total number of carbide_power_shelves in the system | |
| carbide_preingestion_total | gauge | The amount of known machines currently being evaluated prior to ingestion | |
| carbide_preingestion_waiting_download | gauge | The amount of machines that are waiting for firmware downloads on other machines to complete before doing thier own | |
| carbide_preingestion_waiting_installation | gauge | The amount of machines which have had firmware uploaded to them and are currently in the process of installing that firmware | |
| carbide_racks_enqueuer_iteration_latency_milliseconds | histogram | The overall time it took to enqueue state handling tasks for all carbide_racks in the system | |
| carbide_racks_handler_latency_in_state_milliseconds | histogram | The amount of time it took to invoke the state handler for objects of type carbide_racks in a certain state | |
| carbide_racks_iteration_latency_milliseconds | histogram | The elapsed time in the last state processor iteration to handle objects of type carbide_racks | |
| carbide_racks_object_tasks_completed_total | counter | The amount of object handling tasks that have been completed for objects of type carbide_racks | |
| carbide_racks_object_tasks_dispatched_total | counter | The amount of types that object handling tasks that have been dequeued and dispatched for processing for objects of type carbide_racks | |
| carbide_racks_object_tasks_enqueued_total | counter | The amount of types that object handling tasks that have been freshly enqueued for objects of type carbide_racks | |
| carbide_racks_per_state | gauge | The number of carbide_racks in the system with a given state | |
| carbide_racks_per_state_above_sla | gauge | The number of carbide_racks in the system which had been longer in a state than allowed per SLA | |
| carbide_racks_total | gauge | The total number of carbide_racks in the system | |
| carbide_racks_with_state_handling_errors_per_state | gauge | The number of carbide_racks in the system with a given state that failed state handling | |
| carbide_reboot_attempts_in_booting_with_discovery_image | histogram | The amount of machines rebooted again in BootingWithDiscoveryImage since there is no response after a certain time from host. | |
| carbide_reserved_ips_count | gauge | The total number of reserved ips in the site | |
| carbide_resourcepool_free_count | gauge | Count of values in the pool currently available for allocation | |
| carbide_resourcepool_used_count | gauge | Count of values in the pool currently allocated | |
| carbide_running_dpu_updates_count | gauge | The number of machines in the system that running a firmware update. | |
| carbide_site_exploration_expected_machines_sku_count | gauge | The total count of expected machines by SKU ID and device type | |
| carbide_site_exploration_identified_managed_hosts_count | gauge | The amount of Host+DPU pairs that has been identified in the last SiteExplorer run | |
| carbide_site_explorer_bmc_reset_count | gauge | The amount of BMC resets initiated in the last SiteExplorer run | |
| carbide_site_explorer_create_machines_latency_milliseconds | histogram | The time it to perform create_machines inside site-explorer | |
| carbide_site_explorer_created_machines_count | gauge | The amount of Machine pairs that had been created by Site Explorer after being identified | |
| carbide_site_explorer_created_power_shelves_count | gauge | The amount of Power Shelves that had been created by Site Explorer after being identified | |
| carbide_site_explorer_iteration_latency_milliseconds | histogram | The time it took to perform one site explorer iteration | |
| carbide_switches_enqueuer_iteration_latency_milliseconds | histogram | The overall time it took to enqueue state handling tasks for all carbide_switches in the system | |
| carbide_switches_iteration_latency_milliseconds | histogram | The elapsed time in the last state processor iteration to handle objects of type carbide_switches | |
| carbide_switches_object_tasks_enqueued_total | counter | The amount of types that object handling tasks that have been freshly enqueued for objects of type carbide_switches | |
| carbide_switches_total | gauge | The total number of carbide_switches in the system | |
| carbide_total_ips_count | gauge | The total number of ips in the site | |
| carbide_unavailable_dpu_nic_firmware_update_count | gauge | The number of machines in the system that need a firmware update but are unavailble for update. |
| Version | Date | Modified By | Description |
|---|---|---|---|
| 0.1 | 02/24/2026 | Binu Ramakrishnan | Initial version |
| 0.2 | 03/11/2026 | Binu Ramakrishnan | gRPC/API updates and incorporated reivew feedback |
1. Introduction
This design document specifies how the Bare Metal Manager project will integrate the SPIFFE identity framework to issue and manage machine identities using SPIFFE Verifiable Identity Documents (SVIDs). SPIFFE provides a vendor-agnostic standard for service identity that enables cryptographically verifiable identities for workloads, removing reliance on static credentials and supporting zero-trust authentication across distributed systems.
The document outlines the architecture, data models, APIs, security considerations, and interactions between Bare Metal Manager components and SPIFFE-compliant systems.
1.1 Purpose
The purpose of this document is to articulate the design of the software system, ensuring all stakeholders have a shared understanding of the solution, its components, and their interactions. It details the high-level and low-level design choices, architecture, and implementation details necessary for the development.
1.2 Definitions and Acronyms
| Term/Acronym | Definition |
|---|---|
| Carbide | NVIDIA bare-metal life-cycle management system (project name: Bare metal manager) |
| SDD | Software Design Document |
| API | Application Programming Interface |
| Tenant | A Carbide client/org/account that provisions/manages BM nodes through Carbide APIs. |
| DPU | Data Processing Unit - aka SmartNIC |
| Carbide API server | A gRPC server deployed as part of Carbide site controller |
| Vault | Secrets management system (OSS version: openbao) |
| Carbide REST server | An HTTP REST-based API server that manages/proxies multiple site controllers |
| Carbide site controller | Carbide control plane services running on a local K8S cluster |
| JWT | JSON Web Token |
| SPIFFE | SPIFFE is an industry standard that provides strongly attested, cryptographic identities to workloads across a wide variety of platforms. |
| SPIRE | A specific open source software implementation of SPIFFE standard |
| SVID | SPIFFE Verifiable Identity Document (SVID). An SVID is the document with which a workload proves its identity to a resource or caller. |
| JWT-SVID | JWT-SVID is a JWT-based SVID based on the SPIFFE specification set. |
| JWKS | A JSON Web Key (JWK) is a JavaScript Object Notation (JSON) data structure that represents a cryptographic key. JSON Web Key Set (JWKS) defines a JSON data structure that represents a set of JWKs. |
| IMDS | Instance Meta-data Service |
| BM | A bare metal machine - often referred as a machine or node in this document. |
| Token Exchange Server | A service capable of validating security tokens provided to it and issuing new security tokens in response, which enables clients to obtain appropriate access credentials for resources in heterogeneous environments or across security domains. Defined in RFC 8693. This document also refer this as 'token endpoints' and 'token delegation server' |
1.3 Scope
This SDD covers the design for Carbide issuing SPIFFE compliant JWTs to nodes it manages. This includes the initial configuration, run-time and operational flows.
1.3.1 Assumptions, Constraints, Dependencies
- Must implement SPIFFE SVIDs as Carbide node identity
- Must rotate and expire SVIDs
- Must provide configurable audience in SVIDs
- Must enable delegating node identity signing
- Must support per-tenant key for signing JWT-SVIDs
- Must produce tokens consumable by SPIFFE-enabled services.
2. System Architecture
2.1 High-Level Architecture
From a high level, the goal for Carbide is to issue a JWT-SVID identity to the requesting nodes under Carbide’s management. A Carbide managed node will be part of a tenant (aka org), and the issued JWT-SVID embodies both tenant and machine identity that complies with the SPIFFE format.

Figure-1 High-level architecture and flow diagram
- The bare metal (BM) tenant process makes HTTP requests to the Carbide meta-data service (IMDS) over a link-local address(169.254.169.254). IMDS is running inside the DPU as part of the Carbide DPU agent.
- IMDS in turn makes an mTLS authenticated request to the Carbide site controller gRPC server to sign a SPIFFE compliant node identity token (JWT-SVID).
a. Pull keys and machine and org metadata from the database, decrypt private key and sign JWT-SVID. The token is returned to Host’s tenant process (implicit, not shown in the diagram). - The tenant process subsequently makes a request to a service (say OpenBao/Vault) with the JWT-SVID token passed in the authentication header.
a. The server-x using the prefetched public keys from Carbide will validate JWT-SVID
An additional requirement for Carbide is to delegate the issuance of a JWT-SVID to an external system. The solution is to offer a callback API for Carbide tenants to intercept the signing request, validate the Carbide node identity, and issue new tenant specific JWT-SVID token (Figure-2). The delegation model offers tenants flexibility to customize their machine SVIDs.

Figure-2 Token exchange delegation flow diagram
2.2 Component Breakdown
The system is composed of the following major components:
| Component | Description |
|---|---|
| Meta-data service (IMDS) | A service part of Carbide DPU agent running inside DPU, listening on port 80 (def) |
| Carbide API (gRPC) server | Site controller Carbide control plane API server |
| Carbide REST | Carbide REST API server, an aggregator service that controls multiple site controllers |
| Database (Postgres) | Store Carbide node-lifecycle and accounting data |
| Token Exchange Server | Optional - hosted by tenants to exchange Carbide node JWT-SVIDs with tenant-customized workload JWT-SVIDs. Follows token exchange API model defined in RFC-8693 |
3. Detailed Design
There are three different flows associated with implementing this feature:
- Per-tenant signing key provisioning: Describes how a new signing key associated with a tenant is provisioned, and optionally the token delegation/exchange flows.
- SPIFFE key bundle discovery: Discuss about how the signing public keys are distributed to interested parties (verifiers)
- JWT-SVID node identity request flow: The run time flow used by tenant applications to fetch JWT-SVIDs from Carbide.
Each of these flows are discussed below.
3.1 Per-tenant Identity Configuration and Signing Key Provisioning
Per-org signing keys are created when an admin first configures machine identity for an org via PUT identity/config (SetIdentityConfiguration).
SetIdentityConfiguration (PUT identity/config)
              │
              ▼
┌───────────────────────────────┐
│ 1. Validate prerequisites     │
│    (global enabled, config)   │
└───────────────────────────────┘
              │
              ▼
┌───────────────────────────────┐
│ 2. Persist identity config    │
│    (issuer, audiences, TTL)   │
└───────────────────────────────┘
              │
              ▼
┌───────────────────────────────┐
│ 3. If org has no key yet:     │
│    Generate per-org keypair   │
│    using global algorithm,    │
│    encrypt with master key,   │
│    store in tenant_identity_  │
│    config                     │
│ If rotate_key=true: same      │
└───────────────────────────────┘
              │
              ▼
┌───────────────────────────────┐
│ 4. Return IdentityConfigResp  │
└───────────────────────────────┘
Figure-3 Per-tenant identity configuration and signing key provisioning flow
3.2 Per-tenant SPIFFE Key Bundle Discovery
SPIFFE bundles are represented as an RFC 7517 compliant JWK Set. Carbide exposes the signing public keys through Carbide-rest OIDC discovery and JWKS endpoints. Services that require JWT-SVID verification pull public keys to verify token signature. Review sequence diagrams Figure-4 and 5 for more details.
┌────────┐       ┌───────────────┐       ┌─────────────┐       ┌──────────┐
│ Client │       │ Carbide-rest  │       │ Carbide API │       │ Database │
│(e.g LL)│       │   (REST)      │       │   (gRPC)    │       │(Postgres)│
└───┬────┘       └──────┬────────┘       └──────┬──────┘       └────┬─────┘
    │                   │                       │                   │
    │ GET /v2/{org-id}/ │                       │                   │
    │ {site-id}/.well-known/                    │                   │
    │ openid-configuration│                     │                   │
    │──────────────────>│                       │                   │
    │                   │                       │                   │
    │                   │ gRPC: GetOpenIDConfiguration              │
    │                   │ (org_id)              │                   │
    │                   │──────────────────────>│                   │
    │                   │                       │                   │
    │                   │                       │ SELECT tenant, pubkey
    │                   │                       │ WHERE org_id=?    │
    │                   │                       │──────────────────>│
    │                   │                       │                   │
    │                   │                       │ Key record        │
    │                   │                       │ (org + pubkey)    │
    │                   │                       │                   │
    │                   │                       │<──────────────────│
    │                   │                       │                   │
    │                   │                       │ ┌─────────────────────────────────┐
    │                   │                       │ │ Build OIDC Discovery Document   │
    │                   │                       │ └─────────────────────────────────┘
    │                   │                       │                   │
    │                   │ gRPC Response:        │                   │
    │                   │ OidcConfigResponse    │                   │
    │                   │<──────────────────────│                   │
    │                   │                       │                   │
    │ 200 OK            │                       │                   │
    │ {                 │                       │                   │
    │  "issuer": "...", │                       │                   │
    │  "jwks_uri": ".", │                       │                   │
    │  ...              │                       │                   │
    │ }                 │                       │                   │
    │<──────────────────│                       │                   │
    │                   │                       │                   │
Figure-4 Per-tenant OIDC discovery URL flow
┌────────┐       ┌───────────────┐       ┌─────────────┐       ┌──────────┐
│ Client │       │ Carbide-rest  │       │ Carbide API │       │ Database │
│        │       │   (REST)      │       │   (gRPC)    │       │(Postgres)│
└───┬────┘       └──────┬────────┘       └──────┬──────┘       └────┬─────┘
    │                   │                       │                   │
    │ GET /v2/{org-id}/ │                       │                   │
    │ {site-id}/.well-known/                    │                   │
    │ jwks.json         │                       │                   │
    │──────────────────►│                       │                   │
    │                   │                       │                   │
    │                   │ GetJWKS(org_id)       │                   │
    │                   │ (gRPC)                │                   │
    │                   │──────────────────────►│                   │
    │                   │                       │                   │
    │                   │                       │ SELECT * FROM     │
    │                   │                       │ tenants WHERE     │
    │                   │                       │ org_id=?          │
    │                   │                       │──────────────────►│
    │                   │                       │                   │
    │                   │                       │ Key record        │
    │                   │                       │◄──────────────────│
    │                   │                       │                   │
    │                   │                       │                   │
    │                   │                       │ ┌─────────────────────────────────┐
    │                   │                       │ │ Convert key info to JWKS:       │
    │                   │                       │ │ - Generate kid from org+version │
    │                   │                       │ │ - Set other key fields          │
    │                   │                       │ └─────────────────────────────────┘
    │                   │                       │                   │
    │                   │ gRPC JWKS Response    │                   │
    │                   │ {keys: [...]}         │                   │
    │                   │◄──────────────────────│                   │
    │                   │                       │                   │
    │ 200 OK            │                       │                   │
    │ Content-Type:     │                       │                   │
    │ application/json  │                       │                   │
    │                   │                       │                   │
    │ {"keys":[{        │                       │                   │
    │  "kty":"EC",      │                       │                   │
    │  "alg":"ES256",   │                       │                   │
    │  "use":"sig",     │                       │                   │
    │  "kid":"...",     │                       │                   │
    │  "crv":"P-256",   │                       │                   │
    │  "x":"...",       │                       │                   │
    │  "y":"..."        │                       │                   │
    │ }]}               │                       │                   │
    │◄──────────────────│                       │                   │
    │                   │                       │                   │
Figure-5 Per-tenant SPIFFE OIDC JWKS flow
3.3 JWT-SVID Node Identity Request Flow
This is the core part of this SDD – issuing JWT-SVID based node identity tokens to the tenant node. The tenant can then use this token to authenticate with other services based on the standard SPIFFE scheme.
[ Tenant Workload ]
      │
      │ GET http://169.254.169.254:80/v1/meta-data/identity?aud=openbao
      ▼
[ DPU Carbide IMDS ]
      │
      │ SignMachineIdentity(..)
      ▼
[ Carbide API Server ]
      │
      │ Validates the request (and attest)
      ▼
JWT-SVID issued to workload/tenant
Figure-6 Node Identity request flow (direct, no callback)
[ Tenant Workload ]
      │
      │ GET http://169.254.169.254:80/v1/meta-data/identity?aud=openbao
      ▼
[ DPU Carbide IMDS ]
      │
      │ SignMachineIdentity(..)
      ▼
[ Carbide API Server ]
      │
      │ Attest requesting machine and issue a scoped machine JWT-SVID
      ▼
[ Tenant Token Exchange Server Callback API ]
      │
      │ - Validates Carbide JWT-SVID signature using SPIFFE bundle
      │ - Verifies iss, audience, TTL and additional lookups/checks
      ▼
Carbide Tenant issue JWT-SVID to tenant workload, routed back through Carbide
Figure-7 Node Identity request flow with token exchange delegation
3.4 Data Model and Storage
3.4.1 Database Design
A new table will be created to store tenant signing key pairs and optional token delegation config. The private key will be encrypted with a master key stored in Vault. Token delegation columns are nullable when an org does not use delegation.
| tenant_identity_config | ||
|---|---|---|
VARCHAR(255) | tenant_organization_id | PK |
TEXT | encrypted_signing_key | Encrypted private key |
VARCHAR(255) | signing_key_public | Public key |
VARCHAR(255) | key_id | Key identifier (e.g. for JWKS kid) |
VARCHAR(255) | algorithm | Signing algorithm |
VARCHAR(255) | encryption_key_id | To identify encryption key used for encrypting signing key |
BOOLEAN | enabled | Key signing enabled by default. Set enable=false to disable |
TIMESTAMPTZ | created_at | When identity config was first created |
TIMESTAMPTZ | updated_at | When identity config or token delegation was last updated |
VARCHAR(512) | token_endpoint | Token exchange endpoint URL (optional; from PUT identity/token-delegation) |
token_delegation_auth_method_t (ENUM) | auth_method | none, client_secret_basic. (optional) |
TEXT | encrypted_auth_method_config | Encrypted blob of method-specific fields. For example: to store client_id and client_secret. (optional) |
VARCHAR(255) | subject_token_audience | Audience to include in Carbide JWT-SVID sent to exchange. (optional) |
TIMESTAMPTZ | token_delegation_created_at | When token delegation was first configured. (optional) |
3.4.2 Configuration
The JWT spec and vault related configs are passed to the Carbide API server during startup through site_config.toml config file.
# In site config file (e.g., site_config.toml)
[machine_identity]
enabled = true
algorithm = "ES256"
# `current_encryption_key_id`: master key id for encrypting per-org signing keys; must match an entry under
# site secrets `machine_identity.encryption_keys`. Required when `enabled = true` (startup fails if missing).
current_encryption_key_id = "primary"
token_ttl_min_sec = 60 # min ttl permitted in seconds
token_ttl_max_sec = 86400 # max ttl permitted in seconds
token_endpoint_http_proxy = "https://carbide-ext.com" # optional, SSRF mitigation for token exchange
# Optional operator allowlists (hostname / DNS patterns only; not full URLs). Empty = no extra restriction.
# Patterns: exact hostname, *.suffix (one label under suffix), **.suffix (suffix or any subdomain).
trust_domain_allowlist = []           # JWT issuer trust domain (host from iss URL)
token_endpoint_domain_allowlist = []    # token delegation token_endpoint URL host (http/https only)
Global vs per-org: Global config provides:
- the master switch (
enabled) - site-wide signing algorithm (
algorithm) current_encryption_key_id: selects which master encryption key from site secrets is used for per-org signing-key material; required whenenabledistrue- optional token TTL bounds (
token_ttl_min_sec,token_ttl_max_sec), and - optional HTTP proxy for token endpoint calls (
token_endpoint_http_proxy) - optional
trust_domain_allowlist: when non-empty, each org’s configured JWTissuermust resolve to a trust domain (registered host) that matches at least one pattern; patterns are validated at startup - optional
token_endpoint_domain_allowlist: when non-empty, the org’s token delegationtoken_endpointmust behttp://orhttps://with a host that matches at least one pattern; patterns are validated at startup
All identity settings (issuer, defaultAudience, allowedAudiences, tokenTtlSec, subjectPrefix etc.) are per-org only and are set when calling PUT identity/config. There is no global fallback for those fields. subjectPrefix is optional: if omitted, the site controller derives spiffe://<trust-domain-from-issuer> from issuer (root SPIFFE ID form, no path or trailing slash). Other fields such as issuer and tokenTtlSec remain required by the API within documented bounds. Per-org enabled can further disable an org when global is true (default true when unset).
PUT prerequisite: Per-org config can only be created or updated when global enabled is true; otherwise PUT returns 503 Service Unavailable.
3.4.3 Incomplete or Invalid Global Config
When the [machine_identity] section exists but is incomplete or invalid, the following behavior applies.
Required fields (when section exists and enabled is true): algorithm, current_encryption_key_id (must align with machine_identity.encryption_keys in secrets). Optional: token_endpoint_http_proxy.
| Scenario | Behavior |
|---|---|
| Section missing | Feature disabled. Server starts. No machine identity operations available. |
| Section exists, invalid or incomplete | Server fails to start. Prevents partial or broken state. |
Section exists, valid, enabled = false | Feature disabled. PUT identity/config returns 503. |
Section exists, valid, enabled = true | Feature operational. |
Runtime behavior when global config is incomplete (e.g. config changed after startup):
| Operation | Behavior |
|---|---|
| PUT identity/config | Reject with 503 Service Unavailable. Same as when global is disabled. |
| GET identity/config | Return 503 when global config is invalid or missing required fields. |
| SignMachineIdentity | Return error (e.g. UNAVAILABLE). Do not issue tokens. |
3.4.4 JWT-SVID Token Format
The subject format complies with the SPIFFE ID specification. The iss claim comes from the org's identity config issuer. The SPIFFE prefix for sub comes from the stored subjectPrefix (explicit or defaulted from issuer as above), combined with the workload path when issuing tokens.
Carbide JWT-SPIFFE (passed to Tenant Layer):
{
  "sub": "spiffe://{carbide-domain}/{org-id}/machine-121",
  "iss": "https://{carbide-rest}/v2/org/{org-id}/carbide/site/{site-id}",
  "aud": [
    "tenant-layer-exchange-token-service"
  ],
  "exp": 1678886400,
  "iat": 1678882800,
  "nbf": 1678882800,
  "request_meta_data" : {
    "aud": [
      "openbao-service"
    ]
  }
}
The Carbide issues two types of JWT-SVIDs. Though they both are similar in structure and signed by the same key, the purpose and some fields are different.
- If the token delegation callback is registered, Carbide issues a JWT-SVID node identity with
audset tosubject_token_audience, validity/ttl limited to 120 seconds and passes additional request parameters usingrequest_meta_data. This token (see example above) is then sent to the registeredtoken_endpointURI. - If no callback is registered, Carbide issues a JWT-SVID directly to the tenant process in the Carbide managed node. Here the
audis set to what is passed as parameters in the IMDS call and ttl is set to 10 minutes (configurable).
SPIFFE JWT-SVID Issued by Token Exchange Server:
This is a sample JWT-SVID issued by the tenant's token endpoint.
{
  "sub": "spiffe://{tenant-domain}/machine/{instance-uuid}",
  "iss": "https://{tenant-domain}",
  "aud": [
    "openbao-service"
  ],
  "exp": 1678886400,
  "iat": 1678882800
}
3.5 Component Details
3.5.1 External/User-facing APIs
3.5.1.1 Metadata Identity API
Both json and plaintext responses are supported depending on the Accept header. Defaults to json. The audience query parameter must be url encoded. Multiple audiences are allowed but discouraged by the SPIFFE spec, so we also support multiple audiences in this API.
Request:
GET http://169.254.169.254:80/v1/meta-data/identity?aud=urlencode(spiffe://your.target.service.com)&aud=urlencode(spiffe://extra.audience.com)
Accept: application/json (or omitted)
Metadata: true
Response:
200 OK
Content-Type: application/json
Content-Length: ...
{
  "access_token":"...",
  "issued_token_type": "urn:ietf:params:oauth:token-type:jwt",
  "token_type": "Bearer",
  "expires_in": ...
 }
Request:
GET http://169.254.169.254:80/v1/meta-data/identity?aud=urlencode(spiffe://your.target.service.com)&aud=urlencode(spiffe://extra.audience.com)
Accept: text/plain
Metadata: true
Response:
200 OK
Content-Type: text/plain
Content-Length: ...
eyJhbGciOiJSUzI1NiIs...
3.5.1.2 Carbide Identity APIs
Org Identity Configuration APIs
These APIs manage per-org identity configuration that controls how Carbide issues JWT-SVIDs for machines in that org. Admins use them to enable or disable the feature per org, and to set the issuer URI, allowed audiences, token TTL, and SPIFFE subject prefix. The configuration applies to all JWT-SVID tokens issued for the org's machines (via IMDS or token exchange). GET retrieves the current config, PUT creates or replaces it, and DELETE removes it (org no longer has machine identity).
Carbide-rest config defaults: Carbide-rest may still supply per-site defaults for issuer, tokenTtlSec, and related fields when a REST client omits them before calling the downstream gRPC SetIdentityConfiguration. subjectPrefix is optional in both REST and gRPC: the Carbide API (site controller) derives a default SPIFFE prefix when it is unset or empty — spiffe://<trust-domain-from-issuer> — where the trust domain is taken from issuer (HTTPS URL host, spiffe://… URI trust domain segment, or bare DNS hostname per implementation). When the client does send subjectPrefix, it must be a spiffe:// URI whose trust domain matches the trust domain derived from issuer, with path segments and encoding rules enforced by the API (see validation below). If Carbide-rest cannot satisfy required fields (e.g. issuer) and the client omits them, PUT may return 400 Bad Request so the caller can supply values explicitly.
Per-org key generation on PUT: When PUT creates identity config for an org for the first time, Carbide generates a new per-org signing key pair using the global algorithm, encrypts the private key with the Vault master key, and stores it in tenant_identity_config DB table. On subsequent PUTs (updates), the key is not regenerated unless rotateKey is true. On DELETE, the identity config and the org's signing key are removed.
PUT when global is disabled: If the global enabled setting in site config is false, PUT returns 503 Service Unavailable with a message indicating that machine identity must be enabled at the site level first. This enforces the deployment order: global config must be enabled before per-org config can be created or updated.
PUT identity/config
GET identity/config
DELETE identity/config
PUT https://{carbide-rest}/v2/org/{org-id}/carbide/site/{site-id}/identity/config
{
  "orgId": "org-id",
  "enabled": true,
  "issuer": "https://carbide-rest.example.com/org/{org-id}/site/{site-id}",
  "defaultAudience": "carbide-tenant-xxx",
  "allowedAudiences": ["carbide-tenant-xxx", "tenant-a", "tenant-b"],
  "tokenTtlSec": 300,
  "subjectPrefix": "spiffe://trust-domain/workload-path",
  "rotateKey": false
}
| Field | Type | Required | Description |
|---|---|---|---|
orgId | string | Yes | Org identifier |
enabled | boolean | No | Enable JWT-SVID for this org. Default true when unset. |
issuer | string | No | Issuer URI that appears in Carbide JWT-SVID. Optional in REST/JSON; required in gRPC SetIdentityConfiguration. |
defaultAudience | string | Yes | Default audience. Must be in allowedAudiences when provided. |
allowedAudiences | string[] | No | Permitted audiences. Optional; when empty or omitted, all audiences are allowed (permissive mode). When non-empty, only audiences in the list are allowed. |
tokenTtlSec | number | No | Token TTL in seconds (300–86400). Optional in REST/JSON; required in gRPC SetIdentityConfiguration. |
subjectPrefix | string | No | SPIFFE URI prefix for JWT-SVID sub (must use spiffe://; trust domain must match trust domain derived from issuer). Optional in REST and in gRPC (optional proto3 field). When omitted or empty, the API stores the default spiffe://<trust-domain-from-issuer>. |
rotateKey | boolean | No | If true, regenerate the per-org signing key. Default false. |
**The trust domain in issuer is derived from the URL host for https:// / http:// issuers (port is not part of the trust domain), from the first segment after spiffe:// for SPIFFE-form issuers, or from a bare hostname string. User-supplied prefixes must not use percent-encoding, query, or fragment; path segments must follow SPIFFE-safe character rules (see implementation). Mismatch between subjectPrefix trust domain and issuer-derived trust domain is rejected with INVALID_ARGUMENT.
Note: When allowedAudiences is provided and non-empty, defaultAudience must be present in it.
Response:
{
  "orgId": "org-id",
  "enabled": true,
  "issuer": "https://carbide-rest.example.com/org/{org-id}/site/{site-id}",
  "defaultAudience": "carbide-tenant-xxx",
  "allowedAudiences": ["carbide-tenant-xxx", "tenant-a", "tenant-b"],
  "tokenTtlSec": 300,
  "subjectPrefix": "spiffe://trust-domain/workload-path",
  "keyId": "af6426a5-5f49-44b9-8721-b5294be20bb6",
  "updatedAt": "2026-02-25T12:00:00Z"
}
| Response field | Description |
|---|---|
keyId | Key identifier for the org's signing key; matches the JWKS kid used for JWT verification. |
Carbide Token Exchange Server Registration APIs
These APIs let Carbide tenants register a token exchange callback endpoint (RFC 8693). When delegation is enabled, Carbide issues a short-lived JWT-SVID to the tenant's exchange service, which validates it and returns a tenant-specific JWT-SVID or access token. This gives tenants control over token structure, lifecycle, and claims, especially when they have more context than Carbide (e.g., VM identity, application role) and need to issue tenant-customized tokens for workloads.
Interaction with global and per-org settings:
| Setting | Scope | Effect on token delegation |
|---|---|---|
enabled | Global | Master switch. If false, PUT token-delegation is rejected (same as identity/config). |
token_endpoint_http_proxy | Global | Outbound calls from Carbide to the tenant's token endpoint use this proxy (SSRF mitigation). |
| Identity config (issuer, audiences, TTL) | Per-org (with global defaults) | The JWT-SVID sent to the exchange server is signed using the org's effective identity config. |
| Token delegation config | Per-org | Each org registers its own tokenEndpoint, subjectTokenAudience, and auth method via oneof (clientSecretBasic, etc.). |
PUT token-delegation prerequisites: Same as PUT identity/config, global enabled must be true and global config must be complete. If not, PUT returns 503 Service Unavailable. Token delegation also requires org identity config to exist (the JWT sent to the exchange is built from it); if the org has no identity config, PUT token-delegation returns 404 or 503.
PUT identity/token-delegation
GET identity/token-delegation
DELETE identity/token-delegation
Request:
PUT https://{carbide-rest}/v2/org/{org-id}/carbide/site/{site-id}/identity/token-delegation
{
  "tokenEndpoint": "https://auth.acme.com/oauth2/token",
  "clientSecretBasic": {
    "client_id": "abc123",
    "client_secret": "super-secret"
  },
  "subjectTokenAudience": "value"
}
Response:
{
  "orgId": "org-id",
  "tokenEndpoint": "https://tenant.example.com/oauth2/token",
  "clientSecretBasic": {
    "client_id": "abc123",
    "client_secret_hash": "sha256:a1b2c3d4"
  },
  "subjectTokenAudience": "tenant-layer-exchange-token-service-id",
  "createdAt": "...",
  "updatedAt": "..."
}
Note: Auth method is inferred from the oneof. clientSecretBasic omits secret keys in response; client_secret_hash (SHA256 prefix) is returned for verification. Non-secret fields (e.g. client_id) are returned. Omit the oneof entirely for none.
Possible (openid client auth) values (inferred from oneof):
client_secret_basicsupported (clientSecretBasic: client_id, client_secret)nonesupported; omit oneof entirelyclient_secret_post,private_key_jwtextensible (currently unsupported)
3.5.1.3 Token Exchange Request
Make a request to the token_endpoint registered via the identity/token-delegation API.
Request:
POST https://tenant.example.com/oauth2/token
Content-Type: application/x-www-form-urlencoded

grant_type=urn%3Aietf%3Aparams%3Aoauth%3Agrant-type%3Atoken-exchange
&subject_token=...
&subject_token_type=urn%3Aietf%3Aparams%3Aoauth%3Atoken-type%3Ajwt
Response:
200 OK
Content-Type: application/json
Content-Length: ...
{
  "access_token":"...",
  "issued_token_type":
      "urn:ietf:params:oauth:token-type:jwt",
  "token_type":"Bearer",
  "expires_in": ...
 }
The exchange service serves an RFC 8693 token exchange endpoint for swapping Carbide-issued JWT-SVIDs with a tenant-specific issuer SVID or access token.
3.5.1.4 SPIFFE JWKS Endpoint
GET
https://{carbide-rest}/v2/org/{org-id}/carbide/site/{site-id}/.well-known/jwks.json

{
  "keys": [{
    "kty": "EC",
    "use": "sig",
    "crv": "P-256",
    "kid": "af6426a5-5f49-44b9-8721-b5294be20bb6",
    "x": "SM0yWlon_8DYeFdlYhOg1Epfws3yyL5X1n3bvJS1CwU",
    "y": "viVGhYhzcscQX9gRNiUVnDmQkvdMzclsQUtgeFINh8k",
    "alg": "ES256"
  }]
}
3.5.1.5 OIDC Discovery URL
Discovery reuses common OpenID Provider field names where helpful, but Carbide does not issue OIDC id_tokens—only JWT bearer access tokens (machine identity). Verifiers should use jwks_uri (or spiffe_jwks_uri for SPIFFE-style use) and the alg (and kid) on keys from GetJWKS; id_token_signing_alg_values_supported stays empty.
GET
https://{carbide-rest}/v2/org/{org-id}/carbide/site/{site-id}/.well-known/openid-configuration

{
  "issuer": "https://{carbide-rest}/v2/org/{org-id}/carbide/site/{site-id}",
  "jwks_uri": "https://{carbide-rest}/v2/org/{org-id}/carbide/site/{site-id}/.well-known/jwks.json",
  "spiffe_jwks_uri": "https://{carbide-rest}/v2/org/{org-id}/carbide/site/{site-id}/.well-known/spiffe/jwks.json",
  "response_types_supported": [
    "token"
  ],
  "subject_types_supported": [
    "public"
  ],
  "id_token_signing_alg_values_supported": []
 }
3.5.1.6 HTTP Response Statuses
HTTP Method Success Response Matrix
| Method | Possible Success Codes | Desc |
|---|---|---|
| GET | 200 OK | Resource exists, returned in body |
| GET | 404 Not Found | Resource not configured yet |
| PUT | 201 Created | Resource was newly created |
| PUT | 200 OK | Resource replaced/updated |
| DELETE | 204 No Content | Resource deleted successfully |
| DELETE | 404 Not Found (optional) | Resource did not exist |
HTTP Error Codes
| Scenario | Status |
|---|---|
| Invalid JSON | 400 Bad Request |
| Schema validation failure | 422 Unprocessable Entity |
| Unauthorized | 401 Unauthorized |
| Authenticated but no permission | 403 Forbidden |
Machine identity disabled at site level (PUT when global enabled is false) | 503 Service Unavailable |
| Conflict (e.g. immutable field change) | 409 Conflict |
3.5.2 Internal gRPC APIs
syntax = "proto3";
// crates/rpc/proto/forge.proto

// Machine Identity - JWT-SVID token signing
message MachineIdentityRequest {
  repeated string audience = 1;
}

message MachineIdentityResponse {
  string access_token = 1;
  string issued_token_type = 2;
  string token_type = 3;
  string expires_in = 4;
}

// gRPC service
service Forge {
  // SPIFFE Machine Identity APIs
  // Signs a JWT-SVID token for machine identity,
  // used by DPU agent meta-data (IMDS) service
  rpc SignMachineIdentity(MachineIdentityRequest) returns (MachineIdentityResponse);
}
syntax = "proto3";
// crates/rpc/proto/forge.proto

// The structure used when CREATING or UPDATING a secret
message ClientSecretBasic {
  string client_id = 1;
  string client_secret = 2;  // Required for input, never returned
}

// The structure used when RETRIEVING a secret configuration
message ClientSecretBasicResponse {
  string client_id = 1;
  string client_secret_hash = 2;  // Returned to client, but never accepted as input
}

// auth_method_config oneof: only set for "client_secret_basic".
// When omitted, auth_method is "none". auth_method is not returned; infer from oneof.
message TokenDelegationResponse {
  string organization_id = 1;
  string token_endpoint = 2;
  string subject_token_audience = 3;
  oneof auth_method_config {
    ClientSecretBasicResponse client_secret_basic = 4;
  }
  google.protobuf.Timestamp created_at = 5;
  google.protobuf.Timestamp updated_at = 6;
}

message GetTokenDelegationRequest {
  string organization_id = 1;
}

// auth_method_config oneof: only set when auth_method is "client_secret_basic".
// When auth_method is "none", omit the oneof entirely.
message TokenDelegation {
  string token_endpoint = 1;
  string subject_token_audience = 2;
  oneof auth_method_config {
    ClientSecretBasic client_secret_basic = 4;
  }
}

message TokenDelegationRequest {
  string organization_id = 1;
  TokenDelegation config = 2;
}

// gRPC service
service Forge {
  rpc GetTokenDelegation(GetTokenDelegationRequest) returns (TokenDelegationResponse) {}
  rpc SetTokenDelegation(TokenDelegationRequest) returns (TokenDelegationResponse) {}
  rpc DeleteTokenDelegation(GetTokenDelegationRequest) returns (google.protobuf.Empty) {}
}
Auth method extensibility: Token delegation uses a strongly-typed oneof auth_method_config. Auth method is inferred from the oneof (not sent in request or response):
- Oneof omitted → auth_method is
none. client_secret_basic: Request usesClientSecretBasic(client_id, client_secret). Response usesClientSecretBasicResponse(client_id, client_secret_hash truncated).
New auth methods can be added by extending the oneof.
syntax = "proto3";
// crates/rpc/proto/forge.proto

// JWK (JSON Web Key)
message JWK {
  string kty = 1; // Key type, e.g., "EC" or "RSA"
  string use = 2; // Key usage, e.g., "sig"
  string crv = 3; // Curve name (EC)
  string kid = 4; // Key ID
  string x = 5; // Base64Url X coordinate (EC)
  string y = 6; // Base64Url Y coordinate (EC)
  string n = 7; // Modulus (RSA)
  string e = 8; // Exponent (RSA)
  string alg = 9; // Algorithm, e.g., "ES256", "RS256"
  google.protobuf.Timestamp created_at = 10; // Optional key creation time
  google.protobuf.Timestamp expires_at = 11; // Optional expiration
}

// JWKS response
message JWKS {
  repeated JWK keys = 1;
  uint32 version = 2; // Optional JWKS version
}

// OpenID Configuration
message OpenIDConfiguration {
  string issuer = 1;
  string jwks_uri = 2;
  repeated string response_types_supported = 3; // e.g. "token" (bearer JWT only; no id_token)
  repeated string subject_types_supported = 4;
  repeated string id_token_signing_alg_values_supported = 5; // always empty (no OIDC id_token)
  uint32 version = 6; // Optional config version
  string spiffe_jwks_uri = 7; // `/.well-known/spiffe/jwks.json` (GetJWKS with Spiffe kind)
}

// Request for well-known JWKS
message JWKSRequest {
  string org_id = 1;
}

// Request message
message OpenIDConfigRequest {
  string org_id = 1;    // org-id
}

// Request for Get/Delete identity configuration (identifiers only)
message GetIdentityConfigRequest {
  string organization_id = 1;
}

// Identity config payload (reusable)
message IdentityConfig {
  bool enabled = 1;
  string issuer = 2;
  string default_audience = 3;
  repeated string allowed_audiences = 4;
  uint32 token_ttl_sec = 5;
  // When unset or empty, API defaults to spiffe://<trust-domain-from-issuer>
  optional string subject_prefix = 6;
  bool rotate_key = 7;
}

// Request to configure identity token settings (per org)
message IdentityConfigRequest {
  string organization_id = 1;
  IdentityConfig config = 2;
}

// Response for Get/Put identity configuration (persisted config per org)
message IdentityConfigResponse {
  string organization_id = 1;
  IdentityConfig config = 2;  // Nested message; subject_prefix is populated (optional field set) with effective stored value
  google.protobuf.Timestamp created_at = 8;
  google.protobuf.Timestamp updated_at = 9;
  string key_id = 10;  // Matches JWKS kid for JWT verification
}

// gRPC service
service Forge {
  rpc GetIdentityConfiguration(GetIdentityConfigRequest) returns (IdentityConfigResponse);
  rpc SetIdentityConfiguration(IdentityConfigRequest) returns (IdentityConfigResponse);
  rpc DeleteIdentityConfiguration(GetIdentityConfigRequest) returns (google.protobuf.Empty);
  rpc GetJWKS(JWKSRequest) returns (JWKS);
  rpc GetOpenIDConfiguration(OpenIDConfigRequest) returns (OpenIDConfiguration);
}
3.5.2.1 Mapping REST -> gRPC
| REST Method & Endpoint | gRPC Method | Description |
|---|---|---|
GET /v2/org/{org-id}/carbide/site/{site-id}/.well-known/jwks.json | Forge.GetJWKS | Fetch JSON Web Key Set (public, unauthenticated) |
GET /v2/org/{org-id}/carbide/site/{site-id}/.well-known/spiffe/jwks.json | Forge.GetJWKS (kind=Spiffe) | Fetch SPIFFE-style JWKS (public, unauthenticated) |
GET /v2/org/{org-id}/carbide/site/{site-id}/.well-known/openid-configuration | Forge.GetOpenIDConfiguration | Fetch OpenID Connect config (public, unauthenticated) |
GET /v2/org/{org-id}/carbide/site/{site-id}/identity/config | Forge.GetIdentityConfiguration | Retrieve identity configuration |
PUT /v2/org/{org-id}/carbide/site/{site-id}/identity/config | Forge.SetIdentityConfiguration | Create or replace identity configuration |
DELETE /v2/org/{org-id}/carbide/site/{site-id}/identity/config | Forge.DeleteIdentityConfiguration | Delete identity configuration |
GET /v2/org/{org-id}/carbide/site/{site-id}/identity/token-delegation | Forge.GetTokenDelegation | Retrieve token delegation config |
PUT /v2/org/{org-id}/carbide/site/{site-id}/identity/token-delegation | Forge.SetTokenDelegation | Create or replace token delegation |
DELETE /v2/org/{org-id}/carbide/site/{site-id}/identity/token-delegation | Forge.DeleteTokenDelegation | Delete token delegation |
3.5.2.2 Error Handling
Use standard gRPC Status codes, aligned with REST:
| REST | gRPC Status | Notes |
|---|---|---|
| 400 Bad Request | INVALID_ARGUMENT | Malformed request |
| 401 Unauthorized | UNAUTHENTICATED | Invalid credentials |
| 403 Forbidden | PERMISSION_DENIED | Not allowed |
| 404 Not Found | NOT_FOUND | Resource missing |
| 409 Conflict | ALREADY_EXISTS | Immutable field conflicts |
| 503 Service Unavailable | UNAVAILABLE | e.g. PUT identity config when global enabled is false |
| 500 Internal | INTERNAL | Unexpected server error |
4. Technical Considerations
4.1 Security
- All internal API gRPC calls to the Carbide API server use (existing) mTLS for authn/z and transport security. A future release also relies on attestation features.
- Carbide-rest is served over HTTPS and supports SSO integration
- The IMDS service is exposed over link-local and is exposed only to the node instance. Short-lived tokens (configurable TTL) limit the replay window. Adding Metadata: true HTTP header to the requests to limit SSRF attacks. In order to ensure that requests are directly intended for IMDS and prevent unintended or unwanted redirection of requests, requests:
- Must contain the header
Metadata: true - Must not contain an
X-Forwarded-Forheader
Any request that doesn't meet both of these requirements is rejected by the service.
- Requests to IMDS are limited to 3 requests per second. Requests exceeding this threshold will be rejected with 429 responses. This prevents DoS on DPU-agent and Carbide API server due to frequent IMDS calls.
- Input validation: The input such as machine id will be validated using the database before issuing the token.
- HTTPS and optional HTTP proxy support for route token exchange call to limit SSRF attacks on internal systems.
Contributing
Codebase overview
bluefield/ - dpu-agent and other tools running on the DPU
book/ - architecture of forge book. aka "the book"
- admin/ -
carbide-admin-cli: A command line client for the carbide API server - api/ - forge primary entrypoint for GRPC API calls. This component receives all the GRPC calls
- scout/ -
forge-scout. A binary that runs on NCX Infra Controller (NICo) managed hosts and DPUs and executes various parts workflows on behalf of the site controller
dev/ - a catch all directory for things that are not code related but are used to support forge. e.g. Dockerfiles, kubernetes yaml, etc.
dhcp/ - kea dhcp plugin. Forge uses ISC Kea for a dhcp event loop. This code intercepts DHCPDISCOVERs from dhcp-relays and passes the info to carbide-api
dhcp-server/ - DHCP Server written in Rust. This server runs on the DPU and serves Host DHCP requests
dns/ - provides DNS resolution for assets in forge database
include/ - contains additional makefiles that are used by cargo make - as specified in Makefile.toml.
log-parser/ - Service which parses SSH console logs and generates health alerts based on them
pxe/ - forge-pxe is a web service which provides iPXE and cloud-init data to machines
rpc/ - protobuf definitions and a rust library which handles marshalling data from/to GRPC to native rust types
crates/
Generating bootable artifacts
1. Install build tools
Install 'mkosi' and 'debootstrap' from the repository -- for Debian it was
sudo apt install mkosi debootstrap
2. Build IPXE image
Run
cd $NICo_ROOT_DIR/pxe && cargo make build-boot-artifacts-x86_64
Because you cannot build aarch64 artifacts on an x86_64 host, we only create the necessary directories to satisfy the docker-compose workflow:
cd $NICo_ROOT_DIR/pxe && cargo make mkdir-static-aarch64
NOTE: Running NICo using
docker-composeand QEMUclientsonly works withx86_64binaries. CI/CD is used for testing onaarch64systems such as a Bluefield
or
download pre-built artifacts - ideal if the ipxe-x86_64 gives you
errors. Extract the latest from Artifactory
into $NICo_ROOT_DIR/pxe/static/blobs/internal/x86_64/ (you'll need
to create the hierarchy).
build-boot-artifacts-x86_64 will also rebuild binaries we package as part of the boot artifacts (like forge-scout), while
the latter command will only package already existing artifacts.
Therefore prefer the former if you change applications.
Note: the last step will exit uncleanly because it wants to compress for CI/CD and upload, but it's not necessary locally. It's fine as long as the contents of this directory look similar to:
$ exa -alh pxe/static/blobs/internal/x86_64/
Permissions Size User      Date Modified Name
.rw-rw-r--    44 $USER     18 Aug 15:35  .gitignore
drwxr-xr-x     - $USER     24 Aug 09:59  .mkosi-t40tggmu
.rw-r--r--   55M $USER     24 Aug 10:01  carbide.efi
.rw-r--r--   26k $USER     24 Aug 10:01  carbide.manifest
.rw-r--r--  298M $USER     24 Aug 10:01  NICo.root
.rw-rw-r--  1.1M $USER     24 Aug 10:05  ipxe.efi
.rw-rw-r--  402k $USER     24 Aug 10:03  ipxe.kpxe
Note: you'll also need to chown the directory recursively back to
your user because mkosi will only run as root; otherwise, your next
docker-compose build won't have the permissions it needs:
sudo chown -R `whoami` pxe/static/*
Bootstrap New Cluster
Development
NCX Infra Controller (NICo) uses docker-compose to instantiate a development environment.
Local environment prep
-
Install rust by following the directions here. You will need to use the rustup based installation method to use the same Rust compiler utilized by the CI toolchain. You can find the target compiler version in
rust-toolchain.tomlin the root of this directory If rustup is installed, you can switch toolchain versions usingrustup toolchain.Make sure you have a C++ compiler:
Arch -
sudo pacman -S base-develDebian -
sudo apt-get -y install build-essential libudev-dev libssl-dev binutils-aarch64-linux-gnu pkg-configFedora -
sudo dnf -y install gcc-c++ systemd-devel binutils-aarch64-linux-gnu- systemd-devel is needed for libudev-devel
- binutils-aarch64-linux-gnu is for stripping the cross-compiled forge-dpu-agent - don't worry if you don't have this
-
Install additional cargo utilities
RUSTC_WRAPPER= cargo install cargo-watch cargo-make sccache mdbook@0.4.52 mdbook-plantuml@0.8.0 mdbook-mermaid@0.16.2 -
Install docker following these directions, then add yourself to the docker group:
sudo usermod -aG docker $USER(otherwise, you must alwayssudodocker`). -
Install docker-compose using your system package manager
Arch -
sudo pacman -S docker-composeDebian -
sudo apt-get install -y docker-composeFedora -
sudo dnf install -y docker-ce docker-ce-cli containerd.io docker-compose-plugin docker-compose -
Install ISC kea using your system package manager
Arch -
sudo pacman -S keaDebian/Ubuntu
-
Install required libraries
sudo apt-get install -y libboost-dev- download libssl1 from here and install
sudo dpkg -i <downloaded-lib>.libssl1.1_1.1.0g-2ubuntu4_amd64.debis known to work but there are newer versions that haven't been tested
-
Install kea, but might be out of date:
sudo apt-get update && sudo apt-get install -y isc-kea-dhcp4-server isc-kea-dev -
Or, but has only been tested with Ubuntu 23.10, install kea:
sudo apt-get update && sudo apt-get install -y kea-dev kea-dhcp4-server
Fedora -
sudo dnf install -y kea kea-devel kea-libs -
-
You can install PostgreSQL locally, but it might be easier to start a docker container when you need to. The docker container is handy when running
cargo testmanually.docker run -e POSTGRES_PASSWORD="admin" -p "5432:5432" postgres:14.1-alpinea. Postgresql CLI utilities should be installed locally
Arch -
sudo pacman -S postgresql-clientDebian -
sudo apt-get install -y postgresql-clientFedora -
sudo dnf install -y postgresql -
Install qemu and ovmf firmware for starting VM's to simulate PXE clients
Arch -
sudo pacman -S qemu edk2-omvfDebian -
sudo apt-get install -y qemu qemu-kvm ovmfFedora -
sudo dnf -y install bridge-utils libvirt virt-install qemu-kvm -
Install
direnvusing your package managerIt would be best to install
direnvon your host.direnvrequires a shell hook to work. Seeman direnv(after install) for more information on setting it up. Once you clone thencx-infra-controller-corerepo, you need to rundirenv allowthe first time you cd into your local copy. Runningdirenv allowexports the necessary environmental variables while in the repo and cleans up when not in the repo.There are preset environment variables that are used throughout the repo.
${REPO_ROOT}represents the top of the forge repo tree.For a list environment variables, we predefined look in:
${REPO_ROOT}/.envrcArch -
sudo pacman -S direnvDebian -
sudo apt-get install -y direnvFedora -
sudo dnf install -y direnv -
Install golang using whatever method is most convenient for you.
forge-vpc(which is in a subtree of theforge-provisionerrepo uses golang) -
Install GRPC client
grpcurl.Arch -
sudo pacman -S grpcurlDebian/Ubuntu/Others - Get latest release from github
Fedora -
sudo dnf install grpcurl -
Additionally,
prost-buildneeds access to the protobuf compiler to parse proto files (it doesn't implement its own parser).Arch -
sudo pacman -S protobufDebian -
sudo apt-get install -y protobuf-compilerFedora -
sudo dnf install -y protobuf protobuf-devel -
Install
jqfrom system package managerArch -
sudo pacman -S jqDebian -
sudo apt-get install -y jqFedora -
sudo dnf install -y jq -
Install
mkosianddebootstrapfrom system package managerDebian -
sudo apt-get install -y mkosi debootstrapFedora -
sudo dnf install -y mkosi debootstrap -
Install
liblzma-devfrom system package managerDebian -
sudo apt-get install -y liblzma-devFedora -
sudo dnf install -y xz-devel -
Install
swtpmandswtpm-toolsfrom system package managerDebian -
sudo apt-get install -y swtpm swtpm-toolsFedora -
sudo dnf install -y swtpm swtpm-tools -
Install
cmakefrom the system package manager:Debian -
sudo apt-get install -y cmakeFedora -
sudo dnf install -y cmake -
Install
vaultfor integration testing:curl -Lo vault.zip https://releases.hashicorp.com/vault/1.13.3/vault_1.13.3_linux_amd64.zip && unzip vault.zip && chmod u+x vault && mv vault /usr/local/bin/ -
Build the
build-containerlocallycargo make build-x86-build-container -
Build the book locally
cargo make bookThen bookmark
file:///$REPO_ROOT/public/index.html.
Checking your setup / Running Unit Tests
To quickly set up your environment to run unit tests, you'll need an initialized PSQL service locally on your system. The docker-compose workflow handles this for you, but if you're trying to set up a simple env to run unit tests run the following.
Start docker daemon:
sudo systemctl start docker
Start database container:
docker run --rm -di -e POSTGRES_PASSWORD="admin" -p "5432:5432" --name pgdev postgres:14.1-alpine
Test!
cargo test
If the tests don't pass ask in Slack #swngc-forge-dev.
Cleanup, otherwise docker-compose won't work later:
docker ps; docker stop <container ID>
IDE
Recommended IDE for Rust development in the NICo project is CLion, IntelliJ works as well but includes a lot of extra components that you don't need. There are plenty of options (VS Code, NeoVim etc), but CLion/IntelliJ is widely used.
One thing to note regardless of what IDE you choose: if you're running on Linux DO NOT USE Snap or Flatpak versions of the software packages. These builds introduce a number of complications in the C lib linking between the IDE and your system and frankly it's not worth fighting.
Cross-compiling for aarch64 (rough notes)
The DPU has an ARM core. To build software that runs there such as forge-dpu-agent you need an ARM8 machine. QEMU/libvirt can provide that.
Here's how I did it.
One time build:
- copy / edit the Docker file from https://gitlab-master.nvidia.com/grahamk/carbide/-/blob/trunk/dev/docker/Dockerfile.build-container-arm into
myarm/Dockerfile. - delete these lines:
 RUN /root/.cargo/bin/cargo install cargo-cache cargo-make mdbook@0.4.52 mdbook-plantuml@0.8.0 mdbook-mermaid@0.16.2 sccache && /root/.cargo/bin/cargo cache -r registry-index,registry-sources
 RUN curl -fsSL https://get.docker.com -o get-docker.sh && sh get-docker.sh
 RUN cd /usr/local/bin && curl -fL https://getcli.jfrog.io | sh
docker build -t myarm myarm# give it a cooler namedocker run -it -v /home/user/src/carbide:/carbide myarm /bin/bash
Daily usage:
docker start <container id or name>docker attach <container id or name>
Now that you're in the container go into /carbide and work normally (cargo build --release). The binary rust produces will be aarch64. You can scp it to a DPU and run it.
The build may hang the first time. I don't know why. Ctrl-C and try again. You may want to docker commit after it succeeds to update the image.
Remember to strip before you scp so that scp goes faster. scp to DPU example (nvinit first): scp -v -J grahamk@155.130.12.194 /home/graham/src/carbide/target/release/forge-dpu-agent ubuntu@10.180.198.23:.
Next steps
Setup a QEMU host for your docker-compose services to manager:
Running a PXE Client in a VM
To test the PXE and DHCP boot process using a generic QEMU virtual machine, you start qemu
w/o graphics support. If the OS is graphical (e.g. ubuntu livecd) remove
-nographic and display none to have a GUI window start on desktop.
Bridge Configuration
To allow the QEMU VM to join the bridge network that is used for development, create or edit the file '/etc/qemu/bridge.conf' such that its contents are:
$ cat /etc/qemu/bridge.conf
allow carbide0
TPM setup
A TPM (Trusted Platform Module) is a chip that can securely store artifacts used to authenticate the server. We have to pretend to have one.
Install Software TPM emulator
- On Debian/Ubuntu:
sudo apt-get install -y swtpm swtpm-tools
Create a directory for emulated TPM state
mkdir /tmp/emulated_tpm
Create initial configuration for the Software TPM
This step makes sure the emulated TPM has certificates.
swtpm_setup --tpmstate /tmp/emulated_tpm --tpm2 --create-ek-cert --create-platform-cert
If you get an error in this step, try the following steps:
- Run
/usr/share/swtpm/swtpm-create-user-config-files. Potentially with--overwrite. This writes the file files:~/.config/swtpm_setup.conf~/.config/swtpm-localca.conf~/.config/swtpm-localca.options
- Check the content of the file
~/.config/swtpm_setup.conf. Ifcreate_certs_toolshas@DATAROOT@in its name, you have run into the bug https://bugs.launchpad.net/ubuntu/+source/swtpm/+bug/1989598 and https://github.com/stefanberger/swtpm/issues/749. To fix the bug, edit/usr/share/swtpm/swtpm-create-user-config-files, search for the place wherecreate_certs_toolis written, and replace it with the correct path to the tool. E.g.
Then runcreate_certs_tool = /usr/lib/x86_64-linux-gnu/swtpm/swtpm-localca/usr/share/swtpm/swtpm-create-user-config-filesagain.
Start the TPM emulator
Run the following command in separate terminal to start a software TPM emulation
swtpm socket --tpmstate dir=/tmp/emulated_tpm --ctrl type=unixio,path=/tmp/emulated_tpm/swtpm-sock --log level=20 --tpm2
Note that the process will automatically end if a VM that connects to this socket is restarted. You need to restart the tool if you are restarting the VM.
Start the services and seed the database
docker-compose upcargo make bootstrap-forge-docker
If you see "No network segment defined for relay address: 172.20.0.11" in the carbide-dhcp output, you forgot to run cargo make bootstrap-forge-docker.
Start the VM
Make sure you have libvirt installed.
- Create it (once):
virsh define dev/libvirt_host.xml(to rebuild firstvirsh undefine --nvram ManagedHost). - Start it:
virsh start ManagedHost. - Look at the console (not in tmux!):
virsh console ManagedHost. - Stop it
virsh destroy ManagedHost.
You can also use graphical interface virt-manager.
The virtual machine should fail to PXE boot from IPv4 (but gets an IP address) and IPv6, and then succeed from "HTTP boot IPv4", getting both an IP address and a boot image.
This should boot you into the prexec image. The user is root and password
is specified in the mkosi.default file.
In order to exit out of console use ctrl-a x
virsh is part of libvirt. Libvirt is a user-friendly layer on top of QEMU (see next section to use it directly). QEMU is a hypervisor, it runs the virtual machine. QEMU uses kernel module KVM, which uses the CPU's virtualization instructions (Intel-VT or AMD-V).
Start the VM (older, manual)
Do not do this step in tmux or screen. The QEMU escape sequence is Ctrl-a.
With TPM:
sudo qemu-system-x86_64 -boot n -nographic -display none \
  -serial mon:stdio -cpu host \
  -accel kvm -device virtio-serial-pci \
  -netdev bridge,id=carbidevm,br=carbide0 \
  -device virtio-net-pci,netdev=carbidevm \
  -bios /usr/share/ovmf/OVMF.fd -m 4096 \
  -chardev socket,id=chrtpm,path=/tmp/emulated_tpm/swtpm-sock \
  -tpmdev emulator,id=tpm0,chardev=chrtpm -device tpm-tis,tpmdev=tpm0
Without TPM:
sudo qemu-system-x86_64 -boot n -nographic -display none \
  -serial mon:stdio -cpu host \
  -accel kvm -device virtio-serial-pci \
  -netdev bridge,id=carbidevm,br=carbide0 \
  -device virtio-net-pci,netdev=carbidevm \
  -bios /usr/share/ovmf/OVMF.fd -m 4096
On Fedora change the -bios line to -bios /usr/share/OVMF/OVMF_CODE.fd.
Note: As of a prior commit, there is a bug that will cause the ipxe dhcp to fail the first time it is run. Wait for it to fail,
and in the EFI Shell just type reset and it will restart the whole pxe process and it will run the ipxe image properly the second time.
See https://jirasw.nvidia.com/browse/FORGE-243 for more information.
Note: I had to validate that the /usr/share/ovmf path was correct, it depends on where ovmf installed the file, sometimes its under a subdirectory called "x64", sometimes not.
Note: Known older issue on first boot that you'll land on a UEFI shell, have to exit back into the BIOS and select "Continue" in order to proceed into normal login.
Re-creating issuer/CA for local development
carbide-api uses Vault to generate certificates that it then vends to clients, such as e.g. Scout. Here are the instructions on how to set up this process from scratch - https://developer.hashicorp.com/vault/tutorials/secrets-management/pki-engine?variants=vault-deploy%3Aselfhosted
In short, when a site or local dev environment is deployed, an issuer/CA is created inside vault. In addition, a role is created. That role points to the issuer. All client certificates are requested/created against that role. Unfortunately, in local dev environment, the TTL for that issuer/CA is set to only 3 months. Also, it is a rule that client certificates cannot outlive issuer's CA certificate, so as soon as CA certificate has less time remaining than client certificate, that we are trying to create (which typically is 30 days), we'll start getting an error like this: cannot satisfy request, as TTL would result in notAfter 2024-... that is beyond the expiration of the CA certificate at 2024-... The solution is to create a new issuer and make sure that the role points to it instead.
Before we begin, it is important to understand Vault's operating concept. Vault runs as https service, typically listening on port 8200. Most of vault commands, e.g. vault list, vault get are simply http requests to that service.
Vault has a concept of engines, also called secrets (just to confuse you). Engines are like modules of various types that can be installed at certain paths. This command will list all the available engines:
/run/secrets $ vault secrets list -tls-skip-verify
Path          Type         Accessor              Description
----          ----         --------              -----------
cubbyhole/    cubbyhole    cubbyhole_e271c1a0    per-token private secret storage
forgeca/      pki          pki_d82997c7          n/a
identity/     identity     identity_e32b8a0d     identity store
secrets/      kv           kv_352bcd00           n/a
sys/          system       system_17d61b86       system endpoints used for control, policy and debugging
Here we have e.g. engine system installed at path sys, and engine kv installed at path secrets (just to confuse you once more). Most engines will accept vault read and vault write commands, some will also accept vault list. The parameters to those commands are most likely URL paths (except for the domain name part) with parameters, e.g. vault read forgeca/issuer/5da1f77a-bd24-400d-1e3b-8492b9daa1c8. (Note, the kv engine does not accept vault list, e.g. vault list secrets/, but it has a special command vault kv list secrets/). It appears that it is possible to have the same type of engine installed at multiple paths.
Now, the engine responsible for generating client certificates has type pki. You need to use vault secrets list to see what path that engine is mapped to. In the example above it is forgeca. Below are the steps that are necessary to undertake in order to create a new issuer, set it as default and (maybe) remove the old issuer.
-
Obtain root login token for the vault:
kubectl get secret -n forge-system carbide-vault-token -o yaml(don't forget to do base64 decode!). -
Exec into vault-0 container:
kubectl exec -n vault vault-0 -it -- /bin/sh. -
Inside the vault container login using that token:
vault login --tls-skip-verify <token>. (Without this, you will not have root permission to carry out steps below) -
Figure out what path pki engine is mapped to:
vault secrets list -tls-skip-verify. In this example it isforgeca(it will also be the value ofVAULT_PKI_MOUNT_LOCATIONenv var in carbide-api deployment/pod). -
List certificate issuers created by the engine
forgeca:/run/secrets $ vault list -tls-skip-verify forgeca/issuers/ Keys ---- 447e5fb7-65d8-3829-d1b4-416a3d795ede -
Have a look at the issuer itself:
vault read -tls-skip-verify forgeca/issuer/447e5fb7-65d8-3829-d1b4-416a3d795ed(one can add -format json for a JSON output). Parse the cert displayed withopenssl x509 -in mycert.pem -textto double check it's the actual culprit by looking at theNotAfterfield. -
Check the role (the name of the role forge-cluster is the value of VAULT_PKI_ROLE_NAME env var in carbine-api deployment/pod)
Get Issuer Role
/run/secrets $ vault read -format json -tls-skip-verify forgeca/roles/forge-cluster { "request_id": "752222cf-97db-d63f-d1cb-59c74d7f9143", "lease_id": "", "lease_duration": 0, "renewable": false, "data": { "allow_any_name": false, "allow_bare_domains": false, "allow_glob_domains": true, "allow_ip_sans": true, "allow_localhost": true, "allow_subdomains": false, "allow_token_displayname": false, "allow_wildcard_certificates": false, "allowed_domains": [ "*.forge", "cluster.local", "*.svc", "*.svc.cluster.local", "*.frg.nvidia.com" ], "allowed_domains_template": false, "allowed_other_sans": [], "allowed_serial_numbers": [], "allowed_uri_sans": [ "spiffe://*" ], "allowed_uri_sans_template": false, "allowed_user_ids": [], "basic_constraints_valid_for_non_ca": false, "client_flag": true, "cn_validations": [ "email", "hostname" ], "code_signing_flag": false, "country": [], "email_protection_flag": false, "enforce_hostnames": true, "ext_key_usage": [], "ext_key_usage_oids": [], "generate_lease": false, "issuer_ref": "default", "key_bits": 256, "key_type": "ec", "key_usage": [ "DigitalSignature", "KeyAgreement", "KeyEncipherment" ], "locality": [], "max_ttl": 2592000, "no_store": false, "not_after": "", "not_before_duration": 30, "organization": [], "ou": [], "policy_identifiers": [], "postal_code": [], "province": [], "require_cn": false, "server_flag": true, "signature_bits": 0, "street_address": [], "ttl": 2592000, "use_csr_common_name": true, "use_csr_sans": true, "use_pss": false }, "warnings": null } -
Check the value of
issuer_reffield in the role description. In this instance it isdefault, meaning this role will be tied to whatever issuer is set as default. -
Try and generate a new client cert manually now with TTL greater than CA cert's NotAfter date, e.g.:
vault write -tls-skip-verify forgeca/issue/forge-cluster common_name="" ttl="30d". This should reproduce the original error:cannot satisfy request, as TTL would result in notAfter of 2024-11-29T11:04:57.198383711Z that is beyond the expiration of the CA certificate at 2024-11-13T12:36:56Z -
Before generating a new issuer/CA, we need to set the upper bound for allowable TTLs, e.g.:
vault secrets tune -max-lease-ttl=87600h forgeca(87600h=10 years, because I don't want to recreate issuers every three months, but feel free to choose your own value). It is possible to specify TTL for a role also, see https://groups.google.com/g/vault-tool/c/sYbWxiTzgcw. -
Now, create the new issuer:
vault write -field=certificate -tls-skip-verify forgeca/root/generate/internal common_name="site-root" issuer_name="site-root" ttl=87600h. The CA cert for this issuer will be printed. While you are at it, grab it and insert it into/opt/forge/forge_root.pemon your client machine (e.g. the one that is running scout). Without this, all communication from carbide-api to Scout will be rejected by Scout as it will have no way to check the authenticity of certs supplied by carbide-api in the TLS session. -
Set that issuer as the default one:
vault write -tls-skip-verify forgeca/root/replace default=site-root. Now, the role will "point" to this issuer. -
You can also delete the old one if you want to:
vault delete -tls-skip-verify forgeca/issuer/447e5fb7-65d8-3829-d1b4-416a3d795ed -
In order to verify that the change has worked, try repeating step 9. This time, it should not produce any errors and should generate a certificate without a problem.
As a side note, we are also using Vault to generate certificate for various services inside a Site, i.e. not for vending to Scout. This is done using Kubernetes' cert-manager. One needs to create certificate objects that describe certificates, e.g. carbide-api-certificate in the forge-system namespace. That object will point to objects of type Issuer or ClusterIssuer, e.g. vault-forge-issuer, that will point to a concrete Vault service generating certificates. The result of that is that there will always be a secret automatically created for each certificate object containing all certificates ready to be consumed by Kubernetes components (pods etc).
Visual Studio Code Remote Docker Workflow
This page describes a workflow on how to build and test NCX Infra Controller (NICo) inside a remotely running docker container. The advantage of this workflow is that it requires no tools to be installed on your native Machine, but still can provide you a similar development feeling.
Prerequisites
- Install Visual Studio Code from https://code.visualstudio.com
- Install the Remote Development Extension Pack
- Enable the
codecommand for MacBook:- Open VS Code
- Press
Cmd + Shift + Pto open the Command Palette. - Type
Shell Command: Install 'code' command in PATHand select it. This sets up the code command for your terminal.
- On the remote server, update the SSH daemon configuration to support port forwarding:
- Edit the sshd configuration file:
doas vi /etc/ssh/sshd_config - Add or update the following lines:
AllowTcpForwarding yes GatewayPorts yes - Restart sshd daemon:
doas systemctl restart sshd - For MacBook:
- Port forwarding may fail initially.
- To resolve this issue, remove the
~/.ssh/known_hostsfile. Source: Stack Overflow - Note: Be sure to back up the file before deleting it.
- Edit the sshd configuration file:
Basic remote setup
Start VS Code using the code command in the same shell after running nvinit:
Click the remote button on the lower left of the IDE window:
 .
Select "Connect to Host", choose the remote hostname define in Prerequisites, and connect. A new Visual Studio Code window should open, which is now on that host.
Inside that window, open the folder which contains the NICo project.
.
Select "Connect to Host", choose the remote hostname define in Prerequisites, and connect. A new Visual Studio Code window should open, which is now on that host.
Inside that window, open the folder which contains the NICo project.
Assuming that remote machine already has all dev tools installed, and you want to work directly on the machine instead of inside a container, you could open up Visual Studio Code's integrated terminal, and for example run:
cd api
cargo test
Remote Rust Analyzer support
In order to get proper IDE support also while working on the remote host, you can install the "Rust Analyzer" extension on the remote host. To do so:
- Open the extensions tab
- Look for the second column in it, which is labeled:
SSH: $hostname - Installed. - Click the download button next to it.
- Select Rust Analyzer, and all other extensions you want to install on the remote Host.
Other recommended extensions are CodeLLDB for debugging Rust code, Better TOML
for editing
.tomlfiles, and GitLens.
Remote container setup
On top of developing on a remote host, one can develop inside a container that contains all dev tools. The container can either run locally (if you work on a Linux machine), or on a remote Linux machine.
To work inside the remote container, the following steps are performed:
- Inside the NICo directory on the Linux host you are working on, place a
.devcontainer/devcontainer.jsonfile with the following details
This will automatically instruct the remote container extension to pick the specified container image. The build container image is picked here, because it contains all necessary tools.// For format details, see https://aka.ms/devcontainer.json. For config options, see the README at: // https://github.com/microsoft/vscode-dev-containers/tree/v0.245.2/containers/docker-existing-dockerfile { "name": "Existing Dockerfile", // Sets the run context to one level up instead of the .devcontainer folder. "context": "../dev/docker/", // Update the 'dockerFile' property if you aren't using the standard 'Dockerfile' filename. // "dockerFile": "../Dockerfile", "dockerFile": "../dev/docker/Dockerfile.build-container-x86_64", // Use 'forwardPorts' to make a list of ports inside the container available locally. // "forwardPorts": [], // Uncomment the next line to run commands after the container is created - for example installing curl. // "postCreateCommand": "apt-get update && apt-get install -y curl", // Uncomment when using a ptrace-based debugger like C++, Go, and Rust "runArgs": [ "--cap-add=SYS_PTRACE", "--security-opt", "seccomp=unconfined" ], // Uncomment to use the Docker CLI from inside the container. See https://aka.ms/vscode-remote/samples/docker-from-docker. "mounts": [ "source=/var/run/docker.sock,target=/var/run/docker.sock,type=bind" ] // Uncomment to connect as a non-root user if you've added one. See https://aka.ms/vscode-remote/containers/non-root. //"remoteUser": "youralias" }
- Click the remote button on the lower left of the IDE window:
. Select "Reopen in Container". Since a container configuration
file for the project exists, Visual Studio Code should automatically build the specified
Dockerfile, launch it as a container, install a VsCode remote server in it, and launch your editor window in it. - The new editor window runs inside the container, and should show something along "Dev Container: Existing Dockerfile" on the lower left.
- You can again open an integrated terminal here, and build the project.
- The dev container again has a separate set of installed extensions. You will need to reinstall all extensions you need there - e.g. Rust Analyzer.
Enabling postgres inside the dev container
While the last step will you allow to build the project and run some unit-tests, all unit-tests which require a database will. To fix this, start the postgres server inside the development container:
- Open another internal terminal tab
- Start postgres:
/etc/init.d/postgresql start - Create the user:
su postgres -c "/usr/lib/postgresql/15/bin/createuser -d root" - Set permissions:
sudo -u postgres psql -c "ALTER USER root WITH SUPERUSER;" - Create a database:
createdb root - Set the
DATABASE_URLenvironment variable:export DATABASE_URL="postgresql://%2Fvar%2Frun%2Fpostgresql"
With those steps completed, running cargo test should succeed.
If you also want to run or debug unit-test from within Visual Studio code using the inline buttons "Run Test" and "Debug" that Rust-Analyzer adds, you have to add the following configuration to the Visual Studio Code json config file:
"rust-analyzer.runnableEnv": {
    "DATABASE_URL": "postgresql://%2Fvar%2Frun%2Fpostgresql"
}
Gotchas
- If you work as
rootinside the dev container, editing files might make them owned byroot, which can prevent working on them from your regular desktop. You might need to reset ownership when going back to your regular environment:sudio chown -R yourAlias carbide/* - The same applies for using git inside the container as root. It will make
files in
.gitbe owned byroot
Those problems might be avoidable by being able to set remoteUser in devcontainer.json
to ones alias. However when doing that I wasn't able to build the devcontainer image
anymore, since it is missing my user alias in /etc/passwd.
References
erDiagram
    sqlx_migrations {
        bigint version PK
        text description
        timestamp_with_time_zone installed_on
        boolean success
        bytea checksum
        bigint execution_time
    }

    machine_topologies {
        character_varying machine_id PK
        jsonb topology
        timestamp_with_time_zone created
        timestamp_with_time_zone updated
        boolean topology_update_needed
    }

    machines {
        character_varying id PK
        timestamp_with_time_zone created
        timestamp_with_time_zone updated
        timestamp_with_time_zone deployed
        character_varying controller_state_version
        jsonb controller_state
        timestamp_with_time_zone last_reboot_time
        timestamp_with_time_zone last_cleanup_time
        timestamp_with_time_zone last_discovery_time
        jsonb network_status_observation
        character_varying network_config_version
        jsonb network_config
        jsonb failure_details
        character_varying maintenance_reference
        timestamp_with_time_zone maintenance_start_time
        jsonb reprovisioning_requested
        jsonb dpu_agent_upgrade_requested
    }

    instances {
        uuid id PK
        character_varying machine_id FK
        timestamp_with_time_zone requested
        timestamp_with_time_zone started
        timestamp_with_time_zone finished
        text user_data
        text custom_ipxe
        ARRAY ssh_keys
        boolean use_custom_pxe_on_boot
        character_varying network_config_version
        jsonb network_config
        jsonb network_status_observation
        text tenant_org
        timestamp_with_time_zone deleted
        character_varying ib_config_version
        jsonb ib_config
        jsonb ib_status_observation
        ARRAY keyset_ids
        boolean always_boot_with_custom_ipxe
    }

    domains {
        uuid id PK
        character_varying name
        timestamp_with_time_zone created
        timestamp_with_time_zone updated
        timestamp_with_time_zone deleted
    }

    network_prefixes {
        uuid id PK
        uuid segment_id FK
        cidr prefix
        inet gateway
        integer num_reserved
        text circuit_id
    }

    vpcs {
        uuid id PK
        character_varying name
        character_varying organization_id
        character_varying version
        timestamp_with_time_zone created
        timestamp_with_time_zone updated
        timestamp_with_time_zone deleted
        network_virtualization_type_t network_virtualization_type
        integer vni
    }

    network_segments {
        uuid id PK
        character_varying name
        uuid subdomain_id FK
        uuid vpc_id FK
        integer mtu
        character_varying version
        timestamp_with_time_zone created
        timestamp_with_time_zone updated
        timestamp_with_time_zone deleted
        integer vni_id
        character_varying controller_state_version
        jsonb controller_state
        smallint vlan_id
        network_segment_type_t network_segment_type
    }

    machine_interface_addresses {
        uuid id PK
        uuid interface_id FK
        inet address
    }

    machine_interfaces {
        uuid id PK
        character_varying attached_dpu_machine_id FK
        character_varying machine_id FK
        uuid segment_id FK
        macaddr mac_address
        uuid domain_id FK
        boolean primary_interface
        character_varying hostname
    }

    dhcp_entries {
        uuid machine_interface_id PK
        character_varying vendor_string PK
    }

    machine_state_controller_lock {
        uuid id
    }

    instance_addresses {
        uuid id
        uuid instance_id FK
        text circuit_id
        inet address
    }

    network_segments_controller_lock {
        uuid id
    }

    network_segment_state_history {
        bigint id PK
        uuid segment_id
        jsonb state
        character_varying state_version
        timestamp_with_time_zone timestamp
    }

    machine_state_history {
        bigint id PK
        character_varying machine_id
        jsonb state
        character_varying state_version
        timestamp_with_time_zone timestamp
    }

    machine_console_metadata {
        character_varying machine_id FK
        character_varying username
        user_roles role
        character_varying password
        console_type bmctype
    }

    ib_partitions {
        uuid id PK
        character_varying name
        character_varying config_version
        jsonb status
        timestamp_with_time_zone created
        timestamp_with_time_zone updated
        timestamp_with_time_zone deleted
        character_varying controller_state_version
        jsonb controller_state
        smallint pkey
        integer mtu
        integer rate_limit
        integer service_level
        text organization_id
    }

    tenants {
        text organization_id PK
        character_varying version
    }

    tenant_keysets {
        text organization_id PK
        text keyset_id PK
        jsonb content
        character_varying version
    }

    resource_pool {
        bigint id PK
        character_varying name
        character_varying value
        timestamp_with_time_zone created
        timestamp_with_time_zone allocated
        jsonb state
        character_varying state_version
        resource_pool_type value_type
    }

    bmc_machine_controller_lock {
        uuid id
    }

    bmc_machine {
        uuid id PK
        uuid machine_interface_id FK
        bmc_machine_type_t bmc_type
        character_varying controller_state_version
        jsonb controller_state
        text bmc_firmware_version
    }

    ib_partition_controller_lock {
        uuid id
    }

    machine_boot_override {
        uuid machine_interface_id PK
        text custom_pxe
        text custom_user_data
    }

    network_devices {
        character_varying id PK
        text name
        text description
        ARRAY ip_addresses
        network_device_type device_type
        network_device_discovered_via discovered_via
    }

    dpu_agent_upgrade_policy {
        character_varying policy
        timestamp_with_time_zone created
    }

    network_device_lock {
        uuid id
    }

    port_to_network_device_map {
        character_varying dpu_id PK
        dpu_local_ports local_port PK
        character_varying network_device_id FK
        text remote_port
    }

    machine_update_lock {
        uuid id
    }

    route_servers {
        inet address
    }

    machine_topologies |o--|| machines : "machine_id"
    instances }o--|| machines : "machine_id"
    machine_interfaces }o--|| machines : "attached_dpu_machine_id"
    machine_console_metadata }o--|| machines : "machine_id"
    machine_interfaces }o--|| machines : "machine_id"
    port_to_network_device_map }o--|| machines : "dpu_id"
    instance_addresses }o--|| instances : "instance_id"
    machine_interfaces }o--|| domains : "domain_id"
    network_segments }o--|| domains : "subdomain_id"
    network_prefixes }o--|| network_segments : "segment_id"
    network_segments }o--|| vpcs : "vpc_id"
    machine_interfaces }o--|| network_segments : "segment_id"
    machine_interface_addresses }o--|| machine_interfaces : "interface_id"
    dhcp_entries }o--|| machine_interfaces : "machine_interface_id"
    bmc_machine }o--|| machine_interfaces : "machine_interface_id"
    machine_boot_override |o--|| machine_interfaces : "machine_interface_id"
    port_to_network_device_map }o--|| network_devices : "network_device_id"
Adding Support for New Hardware
This guide explains how to add or extend hardware support in the NICo stack when new BMC/server hardware arrives that does not work out of the box. The general process is: ingest the hardware, observe where it fails, and patch the appropriate layer based on which of the three scenarios applies.
Important: Changes for new hardware must not break support for existing hardware. Guard new behavior behind vendor/model/firmware checks rather than modifying shared code paths.
For background on how NICo uses Redfish end-to-end, see Redfish Workflow. For the list of currently supported hardware, see the Hardware Compatibility List.
Overview
NICo discovers and manages bare-metal hosts through their BMC (Baseboard Management Controller) via the DMTF Redfish standard. Two Rust Redfish client libraries handle this:
| Library | Role | Where Used |
|---|---|---|
| nv-redfish | Schema-driven, fast: site exploration reports, firmware inventory, sensor collection, health monitoring. Preferred for exploration. | Site Explorer exploration (crates/api/src/site_explorer/), Hardware Health (crates/health/src/) |
| libredfish | Stateful BMC interactions: boot config, BIOS setup, power control, account/credential management, lockdown | Site Explorer state controller operations (crates/api/src/site_explorer/) |
Site Explorer supports both libraries for generating EndpointExplorationReports, controlled by the explore_mode configuration setting (SiteExplorerExploreMode):
| Mode | Behavior |
|---|---|
nv-redfish | Use nv-redfish for exploration (preferred - significantly faster) |
libredfish | Use libredfish for exploration (legacy) |
compare-result | Run both and compare results (transition/validation) |
When new hardware arrives, failures can surface in either library. Exploration failures show up in whichever explore_mode is active (increasingly nv-redfish). State controller failures (boot order, BIOS setup, lockdown, credential rotation) show up in libredfish, which remains the library used for all write operations against BMCs. Both libraries may need changes to support a new platform.
Beyond the Redfish libraries, NICo itself has vendor-aware logic that also needs updating - see Changes in NICo.
The Three Scenarios
Scenario 1: Completely New BMC Vendor
The hardware uses a BMC firmware stack that does not map to any existing RedfishVendor variant.
What to do:
-
Add a
RedfishVendorvariant inlibredfish/src/model/service_root.rs. -
Extend vendor detection in
ServiceRoot::vendor()(same file). The vendor string comes fromGET /redfish/v1- theVendorfield, or failing that, the first key in theOemobject. If the vendor string alone is not enough to distinguish the BMC (e.g., the vendor is "Lenovo" but some models use an AMI-based BMC), use secondary signals likeself.has_ami_bmc()orself.product. -
Create a vendor module (or reuse an existing one). Each vendor has a file
libredfish/src/<vendor>.rscontaining aBmcstruct that implements theRedfishtrait. If the new vendor's BMC is very close to an existing one (e.g., LenovoAMI reusesami::Bmc), you can route to the existing implementation. -
Wire up
set_vendorinlibredfish/src/standard.rsto dispatch the new variant to the appropriateBmcimplementation. -
Implement the
Redfishtrait for the newBmc. Start by delegating toRedfishStandardand override methods as needed. The methods below are grouped by how they are used in the state machine; almost all need vendor-specific overrides.BIOS / machine setup - called during initial ingestion and instance creation to configure UEFI settings:
machine_setup()- applies BIOS attributes (names differ per vendor and model)machine_setup_status()- polls whether allmachine_setupchanges have taken effectis_bios_setup()- lightweight check used during instance creation (PollingBiosSetup) to confirm BIOS is ready before proceeding to boot order configuration
Lockdown - called to secure the BMC before tenant use and unlocked during instance termination or reconfiguration:
lockdown()- enable/disable BMC security lockdownlockdown_status()- polled by the state controller to confirm lockdown state; wrong results cause machines to get stucklockdown_bmc()- lower-level BMC-specific lockdown (e.g., iDRAC lockdown on Dell, distinct from BIOS lockdown)
Boot order - called during ingestion to set DPU-first boot and during DPU reprovisioning:
set_boot_order_dpu_first()- reorder boot options so the DPU boots first (platform-specific boot option discovery)boot_once()- one-time boot from a specific target (e.g.,UefiHttpfor DPU HTTP boot path)boot_first()- persistently change boot order to a given target
Serial console - SSH console access setup:
setup_serial_console()- configure BMC serial-over-LANserial_console_status()- polled to confirm setup; incorrect results stall provisioning
Credential management - called during initial ingestion to rotate factory defaults:
change_password()- rotate BMC user passwordchange_uefi_password()/clear_uefi_password()- UEFI password management (only tested on Dell, Lenovo, NVIDIA)set_machine_password_policy()- apply password-never-expires policy (vendor-specific)
Important: Pay careful attention to all status/polling methods (
is_bios_setup(),lockdown_status(),machine_setup_status(),serial_console_status(), etc.). The state controller polls these during provisioning, instance creation, instance termination, and reprovisioning to decide when to advance state. If they return incorrect results, machines will get stuck in polling states, fail to terminate properly, or skip required configuration steps. -
Add OEM model types if needed in
libredfish/src/model/oem/<vendor>.rs. -
Add unit tests for vendor detection and create a mockup directory for integration tests (see Testing).
-
Update nv-redfish - since nv-redfish is the preferred library for site exploration, it will likely need changes too. See nv-redfish Quirks.
-
Update NICo - add the vendor to
BMCVendor,HwType, and handle any state controller quirks. See Changes in NICo.
Scenario 2: New Server Model with Quirks
The hardware uses an already-supported BMC vendor but the specific model has quirks: different BIOS attribute names, unusual boot option paths, model-specific OEM extensions, etc.
What to do:
-
Identify the model string.
GET /redfish/v1/Systems/{id}returns aModelfield. The functionmodel_coerce()inlibredfish/src/lib.rsnormalizes this by replacing spaces with underscores. -
Use BIOS / OEM manager profiles for config-driven differences. NICo supports per-vendor, per-model BIOS settings via the
BiosProfileVendortype inlib.rs, letting you define model-specific attributes in config (TOML) without code changes. -
Add model-specific branches in the vendor module when profiles are not enough. Use the model/product string from
ComputerSystemto gate behavior. -
Handle missing or renamed attributes. Check the actual BIOS attributes via
GET /redfish/v1/Systems/{id}/Bioson the target hardware. If an attribute is missing, add a guard that logs and skips rather than failing.
Scenario 3: New Firmware for an Existing Model
A firmware update for an already-supported model introduces regressions: removed endpoints, changed response schemas, renamed attributes, etc.
What to do:
-
Compare old and new firmware Redfish responses. Use
curlorcarbide-admin-cli redfish browsetoGETendpoints on both versions and diff. -
Add defensive handling where endpoints may no longer exist - catch
404errors and fall through. -
Fix deserialization issues: null values in arrays (custom deserializers), new enum values, missing required fields (
Option<T>). -
Adjust OEM-specific paths if the firmware reorganizes its Redfish tree.
-
Guard behavioral changes behind firmware version checks if needed, using
ServiceRoot.redfish_versionor firmware inventory versions.
Changes in NICo
Beyond the Redfish libraries, NICo itself has vendor-aware logic that needs updating for new hardware.
BMCVendor enum (crates/bmc-vendor/src/lib.rs)
NICo has its own BMCVendor enum, distinct from libredfish's RedfishVendor. It is used throughout NICo for vendor-specific branching in the state controller, credential management, and exploration. When adding a new vendor:
- Add the variant to
BMCVendor. - Add the
From<RedfishVendor>mapping so libredfish's vendor detection flows into NICo's enum. - Add parsing in
From<&str>,from_udev_dmi(), andfrom_tls_issuer()as applicable.
HwType enum (crates/bmc-explorer/src/hw/mod.rs)
The bmc-explorer crate (used by the nv-redfish exploration path) classifies hardware into HwType variants. Each variant maps to a BMCVendor via bmc_vendor(). For a new hardware type, add a variant to HwType and implement the required methods. If the hardware type has unique exploration behavior, add a corresponding module under crates/bmc-explorer/src/hw/.
State controller vendor branches
The state controller (crates/api/src/state_controller/machine/handler.rs) has vendor-specific logic gated on BMCVendor for operations that cannot be handled generically in libredfish. Examples:
- Factory credential rotation: On first exploration, NICo changes the factory default BMC password. This is vendor-aware - ensure the new vendor's credential rotation path works correctly.
- UEFI password setting: Only tested on Dell, Lenovo, and NVIDIA - other vendors log a warning and skip.
- Power cycling: Lenovo SR650 V4s use IPMI chassis reset instead of Redfish
ForceRestartto avoid killing DPU power. Lenovo BMCs need an explicitbmc_reset()after firmware upgrades. - Lockdown: Dell requires BMC lockdown to be disabled separately before UEFI password changes.
Review handler.rs for bmc_vendor().is_*() calls and add branches for the new vendor where its behavior differs.
Testing with carbide-admin-cli redfish
The fastest way to validate libredfish changes against a real BMC is to compile carbide-admin-cli with a local checkout of libredfish and use the redfish subcommand to test specific operations directly, rather than waiting for Site Explorer or the state machine to exercise the code path.
Setup: Use a local libredfish checkout
Place your libredfish checkout inside the NICo workspace (or anywhere accessible), then override the dependency in the workspace Cargo.toml:
# Cargo.toml (workspace root)
[workspace.dependencies]
# Comment out the git version:
# libredfish = { git = "https://github.com/NVIDIA/libredfish.git", tag = "v0.43.5" }
# Point to your local checkout instead:
libredfish = { path = "libredfish" }
Then build the CLI from the crates/admin-cli directory:
cd crates/admin-cli
cargo build
Running commands against a real BMC
The redfish subcommand talks directly to a BMC - no NICo deployment needed:
# Check if vendor detection and basic connectivity work
./target/debug/carbide-admin-cli redfish --address <bmc-ip> --username <user> --password <pass> get-power-state

# Read BIOS attributes to see what the BMC exposes
./target/debug/carbide-admin-cli redfish --address <bmc-ip> --username <user> --password <pass> bios-attrs

# Test machine setup (the core provisioning step)
./target/debug/carbide-admin-cli redfish --address <bmc-ip> --username <user> --password <pass> machine-setup

# Check if machine setup succeeded
./target/debug/carbide-admin-cli redfish --address <bmc-ip> --username <user> --password <pass> machine-setup-status

# Test boot order (set DPU first)
./target/debug/carbide-admin-cli redfish --address <bmc-ip> --username <user> --password <pass> set-boot-order-dpu-first --boot-interface-mac <dpu-mac>

# Test lockdown
./target/debug/carbide-admin-cli redfish --address <bmc-ip> --username <user> --password <pass> lockdown-enable
./target/debug/carbide-admin-cli redfish --address <bmc-ip> --username <user> --password <pass> lockdown-status

# Browse any Redfish endpoint directly
./target/debug/carbide-admin-cli redfish --address <bmc-ip> --username <user> --password <pass> browse --uri /redfish/v1
If all of these commands work correctly, there is a good chance the hardware will work end-to-end through Site Explorer and the state machine.
Code Structure Reference
libredfish/
├── src/
│   ├── lib.rs                    # Redfish trait, BiosProfile types, model_coerce()
│   ├── standard.rs               # RedfishStandard: defaults + set_vendor() dispatch
│   ├── network.rs                # create_client(): ServiceRoot → vendor → set_vendor
│   ├── ami.rs, dell.rs, hpe.rs,  # Vendor-specific Redfish trait implementations
│   │   lenovo.rs, supermicro.rs, ...
│   └── model/
│       ├── service_root.rs       # RedfishVendor enum, vendor detection
│       ├── oem/                  # Vendor-specific OEM data models
│       └── testdata/             # JSON fixtures for unit tests
├── tests/
│   ├── integration_test.rs       # Per-vendor integration tests
│   ├── mockups/<vendor>/         # Redfish JSON mockup trees
│   └── redfishMockupServer.py    # Python server for mockups

nico/
├── crates/bmc-vendor/src/lib.rs        # BMCVendor enum + From<RedfishVendor>
├── crates/bmc-explorer/src/hw/mod.rs   # HwType enum (nv-redfish exploration)
├── crates/api/src/state_controller/    # Vendor-specific state machine logic
└── crates/admin-cli/src/redfish/       # carbide-admin-cli redfish subcommand
Adding nv-redfish Quirks for Exploration and Health Monitoring
nv-redfish is the preferred library for site exploration reports and is also used for health monitoring (carbide-hw-health). If the new hardware causes failures in either path, the fix goes into nv-redfish.
-
Add a
Platformvariant innv-redfish/redfish/src/bmc_quirks.rsif the quirk is platform-specific. -
Map the variant in
BmcQuirks::new()using the vendor string, redfish version, and product from the service root. -
Add quirk methods for each workaround. Common quirks:
bug_missing_root_nav_properties()- BMC omitsSystems/Chassis/Managersfrom service rootexpand_is_not_working_properly()-$expandquery parameter brokenwrong_resource_status_state()- non-standardStatus.Stateenum valuesfw_inventory_wrong_release_date()- invalid date formats
-
Add OEM feature support if needed. OEM extensions are gated behind Cargo features (
oem-ami,oem-dell,oem-hpe, etc.) innv-redfish/redfish/Cargo.toml.
Testing
Unit Tests
Add vendor detection tests in libredfish/src/model/service_root.rs. For complex detection (like LenovoAMI which checks the Oem field), use JSON test fixtures in src/model/testdata/.
Testing Against Real Hardware
Use carbide-admin-cli redfish with a local libredfish checkout (see above) to validate all key operations before deploying. Then test the full cycle through a NICo instance: discovery → ingestion → BIOS setup → boot order → lockdown → health monitoring.
Operating Bluefield/DPU
Connecting to DPU
The DPU shares a physical 1GB ethernet connection for both BMC and OOB access. This one interface has two different MAC addresses. So, while the physical connection is shared the OOB and BMC have unique IP addresses.
The BMC OS is a basic busybox shell, so the available commands are limited.
To connect the BMC, ssh to the IP address listed under DPU BMC IP address
using credentials in the DPU BMC Credentials table above.
To then connect to the 'console' of the DPU you use microcom on the
console device
microcom /dev/rshim0/console

Press enter to bring up login prompt.

use the login credentials in the DPU OOB column to connect

ctrl-x will break out of the connection
Another way (and preferred if the OOB interfaces are provisioned) is to ssh
directly to the IP listed in DPU OOB IP and use the credentials in the
DPU OOB Credentials column. This bypasses the BMC and connects you directly to
the DPU OS.
Updating to the latest BFB on a DPU
Download the latest BFB from artifactory - https://urm.nvidia.com/artifactory/list/sw-mlnx-bluefield-generic/Ubuntu20.04/
In order to upgrade the OS you will need to scp the BFB file to a specific directory on the DPU.
scp DOCA_1.3.0_BSP_3.9.0_Ubuntu_20.04-3.20220315.bfb root@bmc_ip:/dev/rshim0/boot once the file is copied the DPU reboots and completes the install of the new BFB.
Note you will need to request access to the forge-dev-ssh-access ssh group
in order to login to a jump host.
Recent versions of BFB can also contain firmware updates which can need to be applied using /opt/mellanox/mlnx-fw-updater/mlnx_fw_updater.pl after that completes
you must power cycle (not reboot) the server. For HP the "Cold restart" option in iLO works.
mlxfwmanager will tell you the current version of firmware as well as the new version that will become active on power cycle
Open Vswitch is loaded on the DPUs
ovs-vsctl show will show which interfaces are the bridge interfaces
From the ArmOS BMC you can instruct the DPU to restart using
echo "SW_RESET 1" > /dev/rshim0/misc
The DPU Might require the following udev rules to enable auto-negotiation. You can look if that is already enable
echo 'SUBSYSTEM=="net", ACTION=="add", NAME=="p0", RUN+="/sbin/ethtool -s p0 autoneg on"' >> /etc/udev/rules.d/83-net-speed.rules
echo 'SUBSYSTEM=="net", ACTION=="add", NAME=="p1", RUN+="/sbin/ethtool -s p1 autoneg on"' >> /etc/udev/rules.d/83-net-speed.rules
ethtool p0 | grep -P 'Speed|Auto'
ethtool p1 | grep -P 'Speed|Auto';

Output should look like this assuming it is connecting to a 25G port

	Speed: 25000Mb/s
	Auto-negotiation: on
TLS Certificates in Kubernetes
Overview
- cert-manager-spiffe uses Kubernetes
serviceAccounts,clusterDomain,roles, androlebindingsto build the SVID, e.g., spiffe://forge.local/forge-system/carbide-api - Certificates are available in pods at
/run/secrets/spiffe.io/{tls.crt,tls.key,ca.crt} - To retrieve a certificate, you must first create a
serviceAccount,role, androleBinding(example below) - Don't forget to update the
namespaceto the correct value - Helm upgrade/install generates the
Labelsyou see in the example below; you can omit those. - The
roleassociated with theserviceAccountgrants enough permissions to request a certificate fromcert-manager-csi-driver-spiffe
Cert-Manager
The CertificateRequest (which includes the CSR) references a
ClusterIssuer set up during the initial bootstrap of the site.
The ClusterIssuer sends CSRs to Vault for signing using the forgeCA PKI.
Before a CertificateRequest can be signed, it must be approved.
cert-manager-csi-driver-spiffe-approver runs as a deployment and is
responsible for verifying the CertificateRequest meets specific
criteria
If all criteria are met, the CertificateRequest is approved, and cert-manager sends the CSR portion of the CertificateRequest to
Vault for signing.
SPIFFE
SPIFFE is a means of identifying software systems. The identity of the software is cryptographically verifiable and exists within a "trust domain" The trust domain could be a user, organization, or anything representable in a URI.
With SPIFFE formatted Certificates, the only field populated is the SAN (Subject Alternative Name). The SAN must conform to the
SPIFFE ID format.
The validation of the SPIFFE ID format and submission of CertificateRequest gets handled by cert-manager-csi-driver-spiffe-approver and cert-manager-csi-driver-spiffe, respectively.
cert-manager-csi-driver-spiffe runs as a DaemonSet. It is responsible for generating the TLS key, CSR and submitting the CSR for
approval (By way of CertificateRequest).
NOTE
The TLS key generated in every pod never leaves the host which it was generated on. If a migration even occurs, the CSR/key are regenerated, submitted to CertManager, and then signed again.
How to obtain a SPIFFE formatted cert
apiVersion: v1
kind: ServiceAccount
metadata:
name: carbide-api
namespace: "default"
labels:
app.kubernetes.io/name: carbide-api
helm.sh/chart: carbideApi-0.0.1
app.kubernetes.io/instance: release-name
app.kubernetes.io/managed-by: Helm
app.kubernetes.io/component: carbide-api
automountServiceAccountToken: true

---

kind: Role
apiVersion: rbac.authorization.k8s.io/v1
metadata:
name: carbide-api
namespace: "default"
labels:
app.kubernetes.io/name: carbide-api
helm.sh/chart: carbideApi-0.0.1
app.kubernetes.io/instance: release-name
app.kubernetes.io/managed-by: Helm
app.kubernetes.io/component: carbide-api
rules:

- apiGroups: ["cert-manager.io"]
  resources: ["certificaterequests"]
  verbs: ["create"]

---

kind: RoleBinding
apiVersion: rbac.authorization.k8s.io/v1
metadata:
name: carbide-api
namespace: default
labels:
app.kubernetes.io/name: carbide-api
helm.sh/chart: carbideApi-0.0.1
app.kubernetes.io/instance: release-name
app.kubernetes.io/managed-by: Helm
app.kubernetes.io/component: carbide-api
roleRef:
apiGroup: rbac.authorization.k8s.io
kind: Role
name: carbide-api
subjects:

- kind: ServiceAccount
  name: carbide-api
  namespace: "default"
After creating the serviceAccount, role, and rolebinding, modify your deployment/pod spec to request a Certificate
spec:
  serviceAccountName: carbide-api
...
      volumeMounts:
        - name: spiffe
          mountPath: "/var/run/secrets/spiffe.io"
...
    volumes:
    - name: spiffe
    csi:
      driver: spiffe.csi.cert-manager.io
      readOnly: true
NON-SPIFFE
Some components in Kubernetes cannot use SPIFFE formatted certs
ValidatingWebhooks and MutatingWebhooks can not use SPIFFE formatted CertificateRequests
For those resources, there is a separate ClusterIssuer that signs CertificateRequests which are not SPIFFE formatted.
There is a CertificateRequestPolicy that enforces specific criteria for non-SPIFFE CertificateRequests. The policy only allows signing
requests for Service based TLS certs.
Azure Set-up
For managing client secrets and redirect URIs registered in the Entra portal.
Carbide Web
The oauth2 in carbide-web has defaults for most settings:
| ENV | DESCRIPTION |
|---|---|
| CARBIDE_WEB_ALLOWED_ACCESS_GROUPS | The list of DL groups allowed to access carbide-web |
| CARBIDE_WEB_ALLOWED_ACCESS_GROUPS_ID_LIST | The list of UUIDs in Azure that correspond to the DL groups allowed to access carbide-web |
| CARBIDE_WEB_OAUTH2_CLIENT_ID | The app ID of carbide-web in Azure/Entra |
| CARBIDE_WEB_OAUTH2_TOKEN_ENDPOINT | The URI for our tenant ID |
| CARBIDE_WEB_OAUTH2_CLIENT_SECRET | A secret used to talk to MS entra/graph. |
| CARBIDE_WEB_PRIVATE_COOKIEJAR_KEY | A secret used for encrypting the cookie values used for sessions. |
| CARBIDE_WEB_HOSTNAME | A hostname specific for each site that's needed for redirects. The value must match what's set in the Azure/Entra portal for the URL of the carbide-api web interface |
Alternative Auth Flow
Some teams use gitlab automation to pull data from the Web UI.
To provide access using the alternative auth flow, perform the following steps:
- Create a new secret for the team/process
- Securely provide the team the new secret
The automated process will then be able to fetch an encrypted cookie that will grant access for 10 minutes.
Example:
curl --cookie-jar /tmp/cjar --cookie /tmp/cjar --header 'client_secret: ...' 'https://<the_web_ui_address>/admin/auth-callback'
curl --cookie /tmp/cjar 'https://<the_web_ui_address>/admin/managed-host.json'
Force deleting and rebuilding NICo hosts
In various cases, it might be necessary to force-delete knowledge about hosts from the database and to restart the discovery process for those hosts. The following are use-cases where force-delete can be helpful:
- If a host managed by NCX Infra Controller (NICo) has entered an erroneous state from which it can not automatically recover.
- If a non backward compatible software update requires the host to go through the discovery phase again.
Important note
This this is not a site-provider facing workflow, since force-deleting a machine does skip any cleanup on the machine and leaves it in an undefined state where the tenants OS could be still running. force-deleting machines is purely an operational tool. The operator which executed the command needs to make sure that either no tenant image is running anymore, or take additional steps (like rebooting the machine) to interrupt the image. Site providers would get a safe version of this workflow later on that moves the machine through all necessary cleanup steps
Force-Deletion Steps
The following steps can be used to force-delete knowledge about a a NICo host:
1. Obtain access to carbide-admin-cli
See carbide-admin-cli access on a Carbide cluster.
2. Execute the carbide-admin-cli machine force-delete command
Executing carbide-admin-cli machine force-delete will wipe most knowledge about
machines and instances running on top of them from the database, and clean up associated CRDs.
It accepts the machine-id, hostname, MAC or IP of either the managed host or DPU as input,
and will delete information about both of them (since they are heavily coupled).
It returns all machine-ids and instance-ids it acted on, as well as the BMC information for the host.
Example:
/opt/carbide/carbide-admin-cli -c https://127.0.0.1:1079 machine force-delete --machine="60cef902-9779-4666-8362-c9bb4b37184f"
3. Use the returned BMP IP/port and machine-id to reboot the host
See Rebooting a machine.
Supply the BMC IP and port of the managed host, as well as its machine_id
as parameters.
Force-deleting a machine will not delete its last set of credentials from vault. Therefore the site controller can still access those.
Once a reboot is triggered, the DPU of the Machine should boot into the NICo discovery image again. This should initiate DPU discovery. A second reboot is required to initiate host discovery. After those steps, the host should be fully rebuilt and available.
Reinstall OS Steps
Deleting and recreating a NICo instance can take upwards of 1.5 hours. However, if you do not need to change the PXE image you can reinstall the OS in place and reuse your allocated system. All the other information about your instance will stay the same. This procedure will delete any data on the host!
The following steps can be used to reinstall the host OS on a NICo host:
1. Obtain access to the carbide-admin-cli tool
See carbide-admin-cli access on a Carbide cluster.
3. Execute the carbide-admin-cli instance reboot --custom-pxe command
carbide-admin-cli -f json -c https://127.0.0.1079/ instance reboot --custom-pxe -i 26204c21-83ac-445e-8ea7-b9130deb6315
Reboot for instance 26204c21-83ac-445e-8ea7-b9130deb6315 (machine fm100hti4deucakqqgteo692efnfo7egh7pq1lkl7vkgas4o6e0c42hnb80) is requested successfully!
Rebooting a machine
This page describes how to reboot a machine managed by NCX Infra Controller (NICo) (i.e. amanaged host or DPU) in any potential state of its lifecycle.
Important note
This this is not a facing site-provider or tenant facing workflow.
Rebooting a machine while it is in-use for a tenant can have unexpected
side effects. If a tenant requires a reboot, they should use the
InvokeInstancePower request - which is properly integrated into the
instance lifecycle.*
Reboot Steps
The following steps can be used to reboot a machine:
1. Obtain access to carbide-admin-cli
See carbide-admin-cli access on a Forge cluster.
2. Execute the carbide-admin-cli machine reboot command
carbide-admin-cli machine reboot can be used to restart a machine.
It always will require the machine's BMC IP and port to be specified.
BMC credentials can either be explicitely passed, or the --machine-id parameter
can be used to let the forge site-controller read the last known credentials
for the machine.
Rebooting a machine will also always reset its boot order. The machine will PXE boot, and thereby will be able to retrieve new boot instructions from the Forge site controller.
Example:
/opt/carbide/carbide-admin-cli -c https://127.0.0.1:1079 machine reboot --address 123.123.123.123 --port 9999 --machine-id="60cef902-9779-4666-8362-c9bb4b37184f"
or using username and password:
/opt/carbide/carbide-admin-cli -c https://127.0.0.1:1079 machine reboot --address 123.123.123.123 --port 9999 --username myhost --password mypassword
Help! My Instance/Subnet/VPC is stuck in a certain state
A common issue that is observed in sites managed by NCX Infra Controller (NICo) is that objects do not move into the desired state - even after a user waits for a long amount of time.
Examples of these problems are:
- Instances are not getting provisioned (are stuck in
Provisioningstate) - Instances are not getting released (are stuck in
Terminatingstate) - Subnets (Network Segments) are not getting provisioned or released
- The Machine Discovery process stops in a certain state (e.g.
Host/WaitingForNetworkConfig)
This runbook explains how operators can troubleshoot why an object doesn't advance into the next state.
Step 1: Is it a Cloud or Site problem?
The state of Forge objects is tracked and advanced in 2 different systems:
- The Forge cloud backend, which stores the states that are shown by the Forge Web UI and ngc console.
- The actual Forge site, which manages the lifecycle of each object inside the site.
If the state of an object doesn't advance, there might be multiple reasons for it:
- The state of the object isn't advanced on the actual Forge site
- The request to change the state of the object is not forwarded from the Forge cloud to the Forge site. Or the notification about the state changed was not forwarded from the Forge Site to the cloud.
A rule of thumb for locating the source of the problem is:
- If the states that are shown on the site and via the Cloud API are different, reason 1) will apply. This indicates a communication issue in the paths between Forge Cloud Backend, Forge Site Agent and Forge Site Controller. TODO: Document steps to diagnose and remediate these issues
- If the states match, then the state on the site isn't advanced as required.
The next chapters will describe on how to lookup the state of an object on the actual site and how to determine what prevents the object from moving into the next state on the site.
1.1 Checking the state in the Forge Web UI or API
Another initial check on whether the problem is a Forge Cloud or Site problem is to check whether the Cloud backend could actually send the state change request (e.g. instance release request) to the Site.
The statusHistory field on the Forge Cloud API can be belpful for this assessment. E.g. the history for the following Subnet indicates that
the deletion request was sent to the site, but deletion might be stuck there:
{
    "id": "1982d4fc-9127-4965-ae72-1c9675d5b440",
    "name": "b-net",
    "siteId": "c86caf07-9ee8-4140-9cd6-67325add393a",
    "controllerNetworkSegmentId": "b69ecd98-2a41-40f5-8e52-2ed0f82a38fe",
    "ipv4Prefix": "10.217.6.176",
    "ipv4BlockId": "e4b41f4b-38eb-4014-9397-ce8266a0cb78",
    "ipv4Gateway": "10.217.6.177",
    "prefixLength": 30,
    "routingType": "Public",
    "status": "Deleting",
    "statusHistory": [
        {
            "status": "Deleting",
            "message": "Deletion has been initiated on Site",
            "created": "2023-09-13T18:35:09.590055Z",
            "updated": "2023-09-13T18:35:09.590055Z"
        },
        {
            "status": "Deleting",
            "message": "Deletion request was sent to the Site",
            "created": "2023-09-13T18:35:09.248705Z",
            "updated": "2023-09-13T18:35:09.248705Z"
        },
        {
            "status": "Deleting",
            "message": "receive deletion request, pending processing",
            "created": "2023-09-13T18:35:09.05314Z",
            "updated": "2023-09-13T18:35:09.05314Z"
        },
        {
            "status": "Ready",
            "message": "Subnet is ready for use",
            "created": "2023-09-11T21:01:44.977235Z",
            "updated": "2023-09-11T21:01:44.977235Z"
        }
    ]
}
In this example, we can see the Forge Cloud Backend indicated it transferred the deletion request to the Site. In this case, we should continue the investigation by checking the site state for this subnet.
If you are using the Forge Web UI, not all API details like statusHistory
are displayed. However we can work around this by getting
access to the raw Forge Cloud API response.
A browsers developer tools can be used for this:
- While on the page that shows the status of the object (E.g. "Virtual Private Clouds"), open the browser developer tools. The F12 key will open it on a lot of browsers.
- Click the Network Tab
- Either wait for a request which fetches the state of the object of
interest (e.g.
subnetorinstance). Or refresh the page in order to force a request. - Click the
Responsetab.
You should now see the raw Forge Cloud API response, as shown in the following
screenshot:

Step 2: Determine the actual state an object is in
The Forge Web UI only shows a simplified state for Forge users, like
- Provisioning
- Ready
- Deleting
However Forge sites use much more fine grained states, like
Assigned/BootingWithDiscoveryImage. The / in this notion separates
the main state of an object from its substate(s). In this example, Assigned
is the main state of an object and BootingWithDiscoveryImage is the substate.
In order to understand why the state of an object doesn't advanced, we first need to determine the full state. This can be done using multiple approaches:
2.1 Using carbide-admin-cli
You can inspect the detailed state of a objects on Forge sites using carbide-admin-cli. Refer to forge-admin-cli instructions
on how to utilize it.
Using carbide-admin-cli, you can inspect the state of an object e.g. with the following queries:
carbide-admin-cli managed-host show --all
+--------------------+-------------------------------------------------------------+------------------------------------+
| Hostname           | Machine IDs (H/D)                                           | State                              |
+--------------------+-------------------------------------------------------------+------------------------------------+
| oven-bakerloo      | fm100pskla0ihp0pn4tv7v1js2k2mo37sl0jjr8141okqg8pjpdpfihaa80 | Host/WaitingForDiscovery           |
|                    | fm100dskla0ihp0pn4tv7v1js2k2mo37sl0jjr8141okqg8pjpdpfihaa80 |                                    |
+--------------------+-------------------------------------------------------------+------------------------------------+
| west-massachusetts | fm100htqrs9la1un8bfscefaciq568m2d23mvr75gjdevagedj7q4h3drr0 | Assigned/BootingWithDiscoveryImage |
|                    | fm100ds7blqjsadm2uuh3qqbf1h7k8pmf47um6v9uckrg7l03po8mhqgvng |                                    |
+--------------------+-------------------------------------------------------------+------------------------------------+
carbide-admin-cli managed-host show --host fm100htqrs9la1un8bfscefaciq568m2d23mvr75gjdevagedj7q4h3drr0
Hostname    : west-massachusetts
State       : Assigned/BootingWithDiscoveryImage
/opt/carbide/carbide-admin-cli -f json machine show --machine  fm100htqrs9la1un8bfscefaciq568m2d23mvr75gjdevagedj7q4h3drr0
{
  "id": "fm100htqrs9la1un8bfscefaciq568m2d23mvr75gjdevagedj7q4h3drr0",
  "state": "Assigned/BootingWithDiscoveryImage",
  "events": [
    {
      "id": 471,
      "machine_id": "fm100htqrs9la1un8bfscefaciq568m2d23mvr75gjdevagedj7q4h3drr0",
      "event": "{\"state\": \"assigned\", \"instance_state\": {\"state\": \"waitingfornetworkconfig\"}}",
      "version": "V24-T1693595082748421",
      "time": "2023-09-01T19:04:42.649738Z"
    },
    {
      "id": 473,
      "machine_id": "fm100htqrs9la1un8bfscefaciq568m2d23mvr75gjdevagedj7q4h3drr0",
      "event": "{\"state\": \"assigned\", \"instance_state\": {\"state\": \"ready\"}}",
      "version": "V25-T1693595158986448",
      "time": "2023-09-01T19:05:56.035999Z"
    },
    {
      "id": 475,
      "machine_id": "fm100htqrs9la1un8bfscefaciq568m2d23mvr75gjdevagedj7q4h3drr0",
      "event": "{\"state\": \"assigned\", \"instance_state\": {\"state\": \"bootingwithdiscoveryimage\"}}",
      "version": "V26-T1693603493579606",
      "time": "2023-09-01T21:24:52.554822Z"
    }
  ],
}
You can observe the detailed state of the ManagedHosts in the state field.
It is Assigned/BootingWithDiscoveryImage in this example. The machine show
command will also list the history of states - including timestamps when the
ManagedHost entered a certain state.
For NetworkSegments, you can use the network-segment subcommand:
/opt/carbide/carbide-admin-cli network-segment show --network 5e85002e-54fd-4183-8c4d-0346c3f3e94e
ID        : 5e85002e-54fd-4183-8c4d-0346c3f3e94e
DELETED   : Not Deleted
STATE     : Ready
2.2 Using the Forge dashboard
In order to get a first impression of whether an object might be stuck in a state and why, you can use the Forge Grafana Dashboard.
On the Dashboard, search for the graph which shows the amount of objects
in a certain state. E.g. for ManagedHosts/Instances, check "ManagedHost States".
The graph might look like:

In this diagram we can observe ManagedHosts in various transient states
(like assigned bootingwithdiscoverimage or dpunotready waitingfornetworkconfig)
for multiple hours. Thereby we can assume those objects are stuck in this
state, and that operator invention is required to make them advance state.
The dashboard will not tell us which ManagedHost is exactly stuck. But if only one ManagedHost is in a stuck state, we can deduct that this might be the ManagedHost a Forge user is concerned about.
For other objects whose lifecycle is controlled by Forge - e.g. Subnets, Network Segments or Infiniband Partitions - a similar diagram will exist.
Another diagram you can look at is the "Time in state" chart that exists
for each object type. It shows the average time objects have stayed in a
particular state. Any metrics on this graph that indicate that there exist
objects in transient states for more than 30-60 Minutes indicate that those
objects are stuck. In the following example for ManagedHosts we can observe that
the average time ManagedHosts had been in the assigned bootingwithdiscoveryimage
state is 1.65 weeks. This equals to 1 ManagedHost being stuck in the state for
this long, or that there exist multiple ManagedHosts in the state and one is stuck
for even longer.

Step 3: Determine why an objects state does not advance on the Site
After we know the actual state of the object, we need to determine why it doesn't advance into the next state.
3.1 What is required to move into the next state?
A good first step to assess why the state doesn't change is to determine what would actually need to happen in order to perform a state transition. The best documentation for these state changes is the actual state machine source code, which codifies the conditions for moving out of each state. Use the following links to look at the state machines for objects managed by Forge:
- ManagedHost State Machine (also used for the lifecycle of Forge instances)
- NetworkSegment/Subnet State Machine
- Infiniband Partition State Machine
When looking at these files, consider that the software version deployed
on the Forge site you are investiating might not match the latest trunk
version of those state machines. You might then want to look at the version
of the file which matches the version (git commit hash) of the actual site.
The handle_object_state function in these files will be called for each
object whose lifecycle is controlled by Forge in periodic intervals. The
default period is 30s - but it could be changed in future Forge updates.
This means that if the state of an object could not be advanced within one iteration of this function, it will automatically be retried 30s later.
Inside the handle_object_state function, you will find a branch that
indicates what needs to happen in order to move the object into the next state.
E.g. for the Assigned/BootingWithDiscoveryImage state that was detected
above, we can find the following logic:
if let ManagedHostState::Assigned { instance_state } = &state.managed_state {
    match instance_state {
        InstanceState::BootingWithDiscoveryImage => {
            if !rebooted(
                state.dpu_snapshot.current.version,
                state.host_snapshot.last_reboot_time,
            )
            .await?
            {
                return Ok(());
            }

            *controller_state.modify() = ManagedHostState::Assigned {
                instance_state: InstanceState::SwitchToAdminNetwork,
            };
        }
    }
}
This snippet of code describes that the condition for moving out of the state
is that we detected that the Host had been rebooted. It also describes that once
the reboot is detected, we will move on into the Assigned/SwitchToAdminNetwork
state.
Inspecting the rebooted
function further will tell us that checks that the last_reboot_time timestamp
is more recent than the time when we entered the state. And checking even
further for where the last_reboot_time is updated, we would learn that
it happens when forge-scout is started and asks the the carbide-api server
via the ForgeAgentControl API call for instructions
Therefore we can determine that possibles sources of the ManagedHost being stuck are:
- The Host is never rebooted
- The Host is rebooted, but does not boot into the discovery image
- The Host is rebooted and boots into the dsicovery image, but
forge-scoutis not running or might not be able to reach the API server.
We can now continue troubleshooting by inspecting which of these steps might have failed.
3.2 Learning more about failures from logs
Sometimes we can easily learn from carbide-api logs why the state transition for a certain object failed. If a state machine tries to advance the state of an object and any function within the state machine returns an error, the error will be logged.
For example the following carbide-api logs show us that the state-machine tried to advance
the state of ManagedHost fm100htbj4teuomt9p8095cg3nikudaqq69uih6t3gg61tpgkkmtncvjbgg
from state Assigned/WaitingForNetworkConfig, but due to a vault issue we failed
to load the BMC credentials for the reboot request that is required to exit the state:
level=SPAN span_id="0x807c960ebf6ad096" span_name=state_controller_iteration status="Ok" busy_ns=42812249 code_filepath=api/src/state_controller/controller.rs code_lineno=115 code_namespace=carbide::state_controller::controller controller=machine_state_controller elapsed_us=61825 error_types="{\"assigned.waitingfornetworkconfig\":{\"redfish_client_creation_error\":1}}" handler_latencies_us="{\"ready\":{\"min\":20714,\"max\":22499,\"avg\":21551},\"assigned.waitingfornetworkconfig\":{\"min\":55593,\"max\":55593,\"avg\":55593}}" idle_ns=18985935 service_name=carbide-api service_namespace=forge-system skipped_iteration=false start_time=2023-09-11T07:55:36.598202068Z states="{\"assigned.waitingfornetworkconfig\":1,\"ready\":3}" times_in_state_s="{\"assigned.waitingfornetworkconfig\":{\"min\":2013,\"max\":2013,\"avg\":2013},\"ready\":{\"min\":1432860,\"max\":2998789,\"avg\":1954860}}"
level=ERROR span_id="0x807c960ebf6ad096" error="An error occurred with the request" location="/usr/local/cargo/registry/src/index.crates.io-6f17d22bba15001f/vaultrs-0.6.2/src/auth/kubernetes.rs:53"
level=WARN span_id="0x807c960ebf6ad096" msg="State handler error" error="RedfishClientCreationError(MissingCredentials(Failed to execute kubernetes service account login request\n\nCaused by:\n   0: An error occurred with the request\n   1: Error sending HTTP request\n   2: error sending request for url (https://vault.vault.svc.cluster.local:8200/v1/auth/kubernetes/login): error trying to connect: error:0A000086:SSL routines:tls_post_process_server_certificate:certificate verify failed:../ssl/statem/statem_clnt.c:1889: (certificate has expired)\n   3: error trying to connect: error:0A000086:SSL routines:tls_post_process_server_certificate:certificate verify failed:../ssl/statem/statem_clnt.c:1889: (certificate has expired)\n   4: error:0A000086:SSL routines:tls_post_process_server_certificate:certificate verify failed:../ssl/statem/statem_clnt.c:1889: (certificate has expired)\n   5: error:0A000086:SSL routines:tls_post_process_server_certificate:certificate verify failed:../ssl/statem/statem_clnt.c:1889:\n\nLocation:\n    forge_secrets/src/forge_vault.rs:141:22))" object_id=fm100htbj4teuomt9p8095cg3nikudaqq69uih6t3gg61tpgkkmtncvjbgg location="api/src/state_controller/controller.rs:357"
As seen from the example above, the field error_types can also provide
a quick overview on what errors have occurred in certain states and
prevented the state machine to advance the state of objects.
error_types="{\"assigned.waitingfornetworkconfig\":{\"redfish_client_creation_error\":1}}"
indicates that for ManagedHosts in state Assigned/WaitingForNetworkConfig, state handling
for 1 ManagedHost encountered a redfish_client_creation_error. The consequence of
this is that the reboot request for the Host could not be dispatched.
Such an error will show up every 30s. The state transition will happen once
the credentials can be loaded and the reboot request gets dispatched.
In order to avoid having to manually look at each log line, try to filter the
logs by machine_id, segment_id or instance_id. If you find any recent
log line about any action which affected the state of the object, search also
for the span_id in this log line. It will show all log messages that have
been emitted as part of the same RPC request or the same state handler iteration.
3.3 Learning more about failures from the Forge Grafana Dashboard
The Forge Grafana Dashboard can also provide a quick overview of why state transitions have failed. In case the state handler of a certain object returned an error, the error type will also be shown in the diagram which summarizes the amount of objects in a certain state for each Forge site.
E.g. for the following example, we can see state handling for 1 ManagedHost in state
assigned waitingfornetworkconfig failing due to a redfish_client_creation_error.
This is equivalent to the information that we found in logs.

The benefit of the dashboard is that it allows for a very quick assessment on what the root cause of a certain issue is. It also shows whether just 1 object might be affected by a certain issue, or whether multiple objects are affected.
Stuck Object Mitigations
Unfortunately there does not exist a common mitigation to all kinds of problems that show up. Many issues will require a unique mitigation that is tailored to the root cause of the object being stuck.
Therefore operators are required to understand the requirements for state transitions and how Forge system components work together. The previous sections of this runbook should help with this.
However there exists a few common requirements for state transitions, and repeated reasons on why those might be failing. This section provides an overview for those.
4.1 Common requirements and failures for ManagedHost state transitions
4.1.1 Machine reboots
Various state transitions require a machine (Host or DPU) to be rebooted.
The reboot is indicated by the forge-scout performing a ForgeAgentControl call
on startup of the machine.
The following issues might prevent this call from happening:
- The reboot request never succeeds due to the Machine being powered down, not reachable via redfish, or due to issues during credential loading. These errors should all show up in carbide-api logs.
- The machine reboots, but can either not obtain an IP address via DHCP or
can not PXE boot. The serial console that is accessible via the BMC of a machine
or via
forge-ssh-consolecan be used to determine whether the Machine booted successfully, or whether it bootloops and not obtain an IP or load an image. If the boot process does not succeed, check carbide-dhcp and carbide-pxe for further logs. TODO: Better runbooks for DHCP failures - The machine boots into the discovery image (or BFB for DPUs), but the execution
inside
forge-scoutwill fail. For this case check the carbide-api logs on whether scout was able to send aReportForgeScoutErrorcall which indicates the source of the problem. If the machine is not able to enumerate hardware, or if carbide-api is not accessible to the machine, such an error report will not be available. You can however access the host via serial console and check the logfile that forge-scout generates (/var/log/forge/forge-scout.log) in order to further investigate the problem.
4.1.2 Feedback from forge-dpu-agent
Whenever the configuration of a ManagedHost changes (Instance gets created,
Instance gets deleted, Provisioning), Forge requires the forge-dpu-agent to
acknowledge that the desired DPU configuration is applied and that the DPU and
services running on it (like HBN) are in a healthy state.
This often happens within a state called WaitingForNetworkConfig. For details
about this see WaitingForNetworkConfig.
Optional Step 5: Mitigation by deleting the object using the Forge Web UI or API
In order to fix the problem of instance or subnet stuck in provisioning, it often seems appealing to just delete the object and retry.
This mitigation will however only work if the object has not even been created on the Forge Site and if the source of the creation problem is within the scope of the Forge Cloud Backend.
If the object was already created on the site and is stuck in a certain
provisioning state there, then the deletion attempt will not help getting
the object unstuck. The lifecycle of any object is fully linear
with no shortcuts. If the object isn't getting Ready it will also never
be deleted. The object lifecycle is implemented this way in Forge in order to
avoid any important object creation or deletion steps accidentally being skipped due to
skipping states.
Due to this reason, it is usually not helpful to initiate deletion of objects stuck in Provisioning. Instead of this, the reason for an object stuck in provisioning should be inspected and the underlying issue being resolved.
WaitingForNetworkConfig and DPU health
Whenever the configuration of a ManagedHost changes (Instance gets created,
Instance gets deleted, Provisioning), Forge requires the forge-dpu-agent to
acknowledge that the desired DPU configuration is applied and that the DPU and
services running on it (like HBN) are in a healthy state.
This feedback mechanism works in the following fashion:
forge-dpu-agentperiodically callsGetManagedHostNetworkConfig. It thereby obtains the latest configuration for all interfaces, including the configuration which states whether the Host should get attached to an admin or tenant network. The configuration includes Version numbers, which increase whenever the configuration changes.forge-dpu-agentreports the version numbers of the currently applied configurations back to Carbide using theRecordDpuNetworkStatusAPI. This report also includes the DPUs health in the form of aHealthReport.
If the DPU has not recently reported that it is up, healthy and that the latest desired configuration is applied, the state will not be advanced.
If a ManagedHost is stuck due to this check, you can inspect which condition is not met by inspecting the last report from the Host and DPUs
- via carbide-admin-cli:
-
carbide-admin-cli managed-host show fm100psa0aqpqvll7vi4jfrvtqv058mo8ifb0vtg761j06sqhq466b0slmg -
carbide-admin-cli machine show fm100psa0aqpqvll7vi4jfrvtqv058mo8ifb0vtg761j06sqhq466b0slmg -
carbide-admin-cli machine show fm100dsa0aqpqvll7vi4jfrvtqv058mo8ifb0vtg761j06sqhq466b0slmg -
carbide-admin-cli machine network status
-
E.g. in the following report
/opt/carbide/carbide-admin-cli managed-host show fm100psa0aqpqvll7vi4jfrvtqv058mo8ifb0vtg761j06sqhq466b0slmg
Hostname    : 192-168-18-95
State       : DPUInitializing/WaitingForNetworkConfig
    Time in State : 296 days and 29 minutes
    State SLA     : 30 minutes
    In State > SLA: true
    Reason        : The object is in the state for longer than defined by the SLA. Handler outcome: Wait("Waiting for DPU agent to apply network config and report healthy network for DPU fm100dsa0aqpqvll7vi4jfrvtqv058mo8ifb0vtg761j06sqhq466b0slmg")

Host:
----------------------------------------
  ID                    : fm100psa0aqpqvll7vi4jfrvtqv058mo8ifb0vtg761j06sqhq466b0slmg
  Memory                : Unknown
  Admin IP              : 192.168.18.95
  Admin MAC             : B8:3F:D2:B7:70:64
  Health
    Probe Alerts        : HeartbeatTimeout [Target: forge-dpu-agent]:
    Overrides
  BMC
    Version             : Unknown
    Firmware Version    : Unknown
    IP                  : Unknown
    MAC                 : Unknown

DPU0:
----------------------------------------
  ID                    : fm100dsa0aqpqvll7vi4jfrvtqv058mo8ifb0vtg761j06sqhq466b0slmg
  State                 : DPUInitializing/WaitingForNetworkConfig
  Primary               : true
  Failure details       : Unknown
  Last reboot           : 2023-12-13 16:38:08.180734 UTC
  Last reboot requested : Unknown/
  Last seen             : 2023-12-13 17:24:15.454965 UTC
  Serial Number         : MT2244XZ022R
  BIOS Version          : BlueField:3.9.3-7-g8f2d8ca
  Admin IP              : 192.168.134.233
  Admin MAC             : B8:3F:D2:B7:70:72
  BMC
    Version             : 1
    Firmware Version    : 2.08
    IP                  : 192.168.134.234
    MAC                 : B8:3F:D2:B7:70:66
  Health
    Probe Alerts        : HeartbeatTimeout [Target: forge-dpu-agent]: No health data was received from DPU
- The
Healthfield indicates whether any of the health checks failed. In this case we can see an alert of theHeartbeatTimeoutprobe - with targetforge-dpu-agent. That indicates noHealthReporthad been received fromforge-dpu-agentvia aRecordDpuNetworkStatusAPI call for a certain amount of time. - The aggregate
Healthof a Host is the aggregation of Health states from monitoring byforge-dpu-agent, out of band BMC monitoring (hardware-health), and the results of validation tests. If the health check failure also shows up in theHealthfield of the DPU, then the failure is related to the DPU, and/or has been reported byforge-dpu-agent. If a health-check has failed, then the root-caused for the failed health-check needs to be remediated. - "Last seen" indicates whether the DPU (and
forge-dpu-agent) is up and running. If the timestamp is too old, it might indicate the DPU agent has crashed or the whole DPU is no longer online. In such a case aHeartbeatTimeoutalert on the DPU and Host would be raised too.
The network status details show:
/opt/carbide/carbide-admin-cli machine network status
+-------------------------+-------------------------------------------------------------+------------------------+----------+--------------------------------------------+---------------------------------+
| Observed at             | DPU machine ID                                              | Network config version | Healthy? | Health Probe Alerts                        | Agent version                   |
+=========================+=============================================================+========================+==========+============================================+=================================+
| 2023-12-13 17:24:15.454 | fm100dsa0aqpqvll7vi4jfrvtqv058mo8ifb0vtg761j06sqhq466b0slmg | V2-T1702485344893918   | false    | HeartbeatTimeout [Target: forge-dpu-agent] | v2023.12-rc1-43-g3322d125f      |
+-------------------------+-------------------------------------------------------------+------------------------+----------+--------------------------------------------+---------------------------------+
In this case we learn that the DPU was alive before, and acknowledged network config version V2-T1702485344893918. This is still the desired network configuration version for
this DPU. The target configuration for a DPU can be found on the Network Config block the DPU page in the admin Web UI.
The summary for this example is that the Machine is stuck because the DPU
- is either not healthy at all (e.g. not booted)
- is not running
forge-dpu-agent forge-dpu-agentis not reporting back to NICo
Follow-up investigation steps
Checking DPU liveliness
Operators can try SSHing to the DPU, using the DPU OOB address that is shown on ManagedHost pages and DPU details pages. If SSH fails, the DPU might not be up and running.
If directly SSHing to the DPU does not work, it can be accessed via its BMC and rshim to investigate its state.
TODO: Document the BMC path
Checking DPU agent logs
In case the DPU is running, forge-dpu-agent logs can be inspected in order to
learn why it can not communicate with carbide, or why the configuration application
might have failed. There are various options for this.
Checking logs via Grafana & Loki
forge-dpu-agent logs are forwarded via OpenTelemetry to the site controller logging infrastructure. They can be queried from there via Loki.
Search strings for DPU can be:
{systemd_unit="forge-dpu-agent.service", machine_id="fm100ds006eliqt3u4h65ou9ebrqfq9th2jf39qqki68k9ueu2amearv47g"}
{systemd_unit="forge-dpu-agent.service", host_name="192-168-155-135.nico.example.org"}
Note that the query using the MachineId will only work if the DPU once had been fully ingested
and is aware of its Machine ID. Otherwise only searches by host_name will work.
In case the DPU problem affects log forwarding, DPU logs need to be checked directly on the DPU.
Checking logs on the DPU:
The dpu agent logs are stored in the systemd journal on the DPU. They can be queried using
journalctl -u forge-dpu-agent.service -e --no-pager
Checking additional logs
Depending on the problems that are found in dpu-agent logs, it can be useful to check other logs that are available on the DPU. Examples are
nl2docalogs:{machine_id="fm100ds02e5g65099ov37rmho1gnge0c99ihdisvluo4fls1ba3br9bksg0", log_file_path="/var/log/doca/hbn/nl2docad.log"}syslog:{machine_id="fm100ds02e5g65099ov37rmho1gnge0c99ihdisvluo4fls1ba3br9bksg0", log_file_path="/var/log/doca/hbn/syslog"}nvuelogsfrrlogs
Potential Mitigations
Power Cycling the Host
⚠️ Note that while a tenant uses a Machine as an instance, powercycling the Host will interrupt their workloads. Only perform these step if its clear that the Tenant no longer requires the Machine (is stuck in termination), or if the Tenant agrees with this action.
If the DPU is unresponsive, powering off the Host and back on can help. This will restart the DPU.
The Host can be powercycled using the Explored-Endpoint view in the Admin Web UI, The DPU Machine details page will link to the explored endpoint by clicking on the DPU BMC IP.
Restarting forge-dpu-agent
If forge-dpu-agent is not even started, then it needs to be started (systemctl enable forge-dpu-agent.service).
This should however never be necessary, since the agent gets restarted on all
crashes.
If forge-dpu-agent should just be restarted, use
systemctl restart forge-dpu-agent.service
Reloading forge-dpu-agent configurations
In rare situations, it might be useful to restart forge-dpu-agent using latest dpu-agent systemd config files. To do so:
systemctl daemon-reload
systemctl restart forge-dpu-agent.service
Mitigations for specific Health Probe Alerts
BgpStats
The BgpStats health probe indicates that BGP peering with the TOR or route server is not successful. This might either indicate a link issue or a configuration issue. The BGP details can be checked on the DPU using
sudo crictl exec -ti $(sudo crictl ps |grep doca-hbn |awk '{print $1}') vtysh -c 'show bgp summary'
TODO: Provide more details on the next steps here
ServiceRunning
Indicates that mandatory DPU services are not running. Next steps in the investigation
can be to check whether the HBN container is running on the DPU (crictl ps should
show doca-hbn container), and to search for associated logs.
DhcpRelay/DhcpServer
Indicates that the DHCP Relay or Server that Forge deploys on the DPU in order to respond to the DHCP requests from the Host are not running as intended. In these conditions, the Host would not be able to boot since nothing would respond to the DHCP request.
Next steps in the investigation would be to check forge-dpu-agent logs for details.
PostConfigCheckWait
This alert is only raised for a brief time after each configuration change in order to wait for the configuration to settle on the DPU. The alert should always settle down after less than a minute. In case the alert keeps raised, it can indicate that new configurations are applied in every dpu-agent eventloop iteration. In this case it would need to be debugged what in the configurations changed, and the source of the unnecessary configuration changes would need to be fixed.
Machine is stuck in Reprovisioning state for DPUs
TODO
State is stuck in Forge Cloud
This runbook describes potential mitigations and actions in case an objects state in Forge Cloud is stuck - while the state on the actual Forge site progressed as expected.
TODO
Topics to talk about:
- Check site agent metrics
- Check site agent logs
- Check Forge Cloud workflows
Adding New Machines to an Existing Site
This guide is intended to cover some of the basic things you should check to get a machine into a a basic state where it can be discovered by Forge auto-ingestion.
Some of the configuration items that should be considered which could potentially cause issues:
- Host BMC Password Requirements
- Updating the Host BMC and UEFI Firmware (Not covered in this document at this time)
- DPU BMC Password Requirements
- Updating DPU BMC Firmware
- DPU ARM OS Check Secure Boot status
Host BMC Password Requirements
Note: New servers should be using the default username for the server type e.g. USERID for Lenovo, admin for NVIDIA/Vikings, root for Dell
You should check both the expected machines DB and the site vault pod data store for any existing data. If entries exist in both expected machines and vault, you should consider the password stored in vault as the password that should be used.
Check Host BMC exists in Expected Machines DB
If there is an existing data in expected machines for the machine, you can either update the password in expected machines or change the password on the Host BMC to match.
-
Use
carbide-admin-clito check if there is an existing entry for the host BMC:carbide-admin-cli expected-machine show |grep <Host BMC IP Address|Host BMC MAC Address> -
If an entry exists for the machine, display the details using
carbide-admin-cli:carbide-admin-cli expected-machine show <Host BMC MAC address> -
To update an existing expected machines data:
carbide-admin-cli expected-machine add --bmc-mac-address <BMC MAC Address> --bmc-username <BMC Username> --bmc-password <BMC Password --chassis-serial-number <Chassis Serial Number>Note: If you only need to update the BMC password, you just need to supply the BMC MAC Address and BMC Password
-
To add a new machine to the expected machines DB:
carbide-admin-cli expected-machine update --bmc-mac-address <BMC_MAC_ADDRESS> <--bmc-username <BMC_USERNAME> --bmc-password <BMC_PASSWORD> --chassis-serial-number <CHASSIS_SERIAL_NUMBER>
Checking site vault data
To check of the Host BMC has currently any passwords in vault on a site:
-
Connect to the Kubernetes environment for the site you are working on
-
Retrieve the decoded vault secret for the site:
kubectl get secret -n forge-system carbide-vault-token -oyaml | yq '.data.token' | base64 -d ; echo -
Connect to the vault pod for the site and paste in the decoded vault secret at the Token prompt:
kubectl --namespace vault exec -it vault-0 -- /bin/sh vault login --tls-skip-verify Token (will be hidden): -
List the secrets in vault:
vault secrets list --tls-skip-verify -
Look for the site BMC:
vault kv list --tls-skip-verify secrets/machines/bmc/ |grep <Host BMC MAC Address> -
Get the current credentials set for the host bmc if they exist:
vault kv get --tls-skip-verify secrets/machines/bmc/<BMC MAC Address>/rootEnsure these credentials match the credentials currently set on the host BMC. It is easier to just update the Host BMC to match vault rather than attempting to update the secret in vault.
DPU BMC Password Requirements
For a new/undiscovered DPU BMC, ensure that it is set to the default BMC username/password
Resting DPU BMC password to default - From DPU BMC
To reset to factory defaults from the DPU BMC:
-
Log into the DPU BMC.
-
Run the following command to reset to factory defaults:
ipmitool raw 0x32 0x66 -
Reboot the DPU BMC:
reboot
Resetting DPU BMC password to default - From DPU ARM OS
If you don't know the BMC password, but have access to the DPU ARM OS, you can reset to defaults as follows:
-
Log into the DPU ARM OS
-
Switch to root:
sudo -i -
Restore DPU BMC defaults:
ipmitool raw 0x32 0x66 -
Restart DPU BMC:
ipmitool mc reset cold
Updating DPU firmware
Determine the DPU model
Log on to the DPU ARM OS and attempt to run the following command:
sudo mlxfwmanager --query -d /dev/mst/*_pciconf0
For Bluefield 2 DPUs you should expect the output similar to the following:
Querying Mellanox devices firmware ...

Device #1:
----------

  Device Type:      BlueField2
  Part Number:      MBF2H536C-CECO_Ax_Bx
  Description:      BlueField-2 P-Series DPU 100GbE Dual-Port QSFP56; integrated BMC; PCIe Gen4 x16; Secure Boot Enabled; Crypto Enabled; 32GB on-board DDR; 1GbE OOB management; FHHL
  PSID:             MT_0000000768
  PCI Device Name:  /dev/mst/mt41686_pciconf0
  Base GUID:        a088c20300ea8240
  Base MAC:         a088c2ea8240
  Versions:         Current        Available
     FW             24.40.1000     N/A
     FW (Running)   24.35.2000     N/A
     PXE            3.6.0805       N/A
     UEFI           14.28.0016     N/A
     UEFI Virtio blk   22.4.0010      N/A
     UEFI Virtio net   21.4.0010      N/A
For Bluefield 3 DPUs you should expect the output similar to the following:
Querying Mellanox devices firmware ...

Device #1:
----------

Device Type:      BlueField3
  Part Number:      900-9D3B6-00CV-A_Ax
  Description:      NVIDIA BlueField-3 B3220 P-Series FHHL DPU; 200GbE (default mode) / NDR200 IB; Dual-port QSFP112; PCIe Gen5.0 x16 with x16 PCIe extension option; 16 Arm cores; 32GB on-board DDR; integrated BMC; Crypto Enabled
  PSID:             MT_0000000884
  PCI Device Name:  /dev/mst/mt41692_pciconf0
  Base MAC:         a088c232137a
  Versions:         Current        Available
     FW             32.41.1000     N/A
     PXE            3.7.0400       N/A
     UEFI           14.34.0012     N/A
     UEFI Virtio blk   22.4.0013      N/A
     UEFI Virtio net   21.4.0013      N/A

  Status:           No matching image found
Checking Bluefield Firmware Versions
To check the current Bluefield firmware versions installed on a DPU:
-
Log into the staging server for the site
-
Set up IP, password and token environment variables:
export DPUBMCIP=<DPU BMC IP> export BMCPASS=<BMC Password> export BMCTOKEN=`curl -k -H "Content-Type: application/json" -X POST https://$DPUBMCIP/login -d "{\"username\": \"root\", \"password\": \"$BMCPASS\"}" | grep token | awk '{print $2;}' | tr -d '"'` -
Check the current DPU BMC Firmware Versions:
Bluefield 2 DPUs:
curl -k -H "X-Auth-Token: $BMCTOKEN" -X GET https://$DPUBMCIP/redfish/v1/UpdateService/FirmwareInventory

# Use the Firmware ID from the first command to complete the firmware ID needed for the following command:
curl -k -H "X-Auth-Token: $BMCTOKEN" -X GET https://$DPUBMCIP/redfish/v1/UpdateService/FirmwareInventory/<firmware_id>_BMC_Firmware | jq -r ' .Version'
Bluefield 3 DPUs:
curl -ks -H "X-Auth-Token: $BMCTOKEN" -X GET https://$DPUBMCIP/redfish/v1/UpdateService/FirmwareInventory/BMC_Firmware | jq -r ' .Version'
Updating the Bluefield Firmware Versions
Note: If discovery is failing due to the firmware revision being too low, confirm with Forge Dev team what version you should update to before proceeding
DPU Firmware versions can be downloaded from the following locations:
BF2: https://confluence.nvidia.com/display/SW/BF2+BMC+Firmware+release
BF3: https://confluence.nvidia.com/display/SW/BF3+BMC+Firmware+release
For the examples below, we are installing FW version 24.01-5, but confirm this with Forge Development team for your specific install before proceeding
-
Download the relevant packages for your DPU type:
Bluefield 2:
wget https://urm.nvidia.com/artifactory/sw-bmc-generic-local/BF2/BF2BMC-24.01-5/OPN/bf2-bmc-ota-24.01-5-opn.tarBluefield 3:
wget https://urm.nvidia.com/artifactory/sw-bmc-generic-local/BF3/BF3BMC-24.01-5/OPN/bf3-bmc-24.01-5_opn.fwpkg -
Copy the firmware package to the staging server for the site
-
Set up IP, password and token environment variables:
export DPUBMCIP=<DPU BMC IP> export BMCPASS=<BMC Password> export BMCTOKEN=`curl -k -H "Content-Type: application/json" -X POST https://$DPUBMCIP/login -d "{\"username\": \"root\", \"password\": \"$BMCPASS\"}" | grep token | awk '{print $2;}' | tr -d '"'` -
Initiate the DPU BMC FW Upgrade:
Bluefield 2:
curl -k -H "X-Auth-Token: $BMCTOKEN" -H "Content-Type: application/octet-stream" -X POST -T bf2-bmc-ota-24.01-5-opn.tar https://$DPUBMCIP/redfish/v1/UpdateService/updateBluefield 3:
curl -k -H "X-Auth-Token: $BMCTOKEN" -H "Content-Type: application/octet-stream" -X POST -T bf3-bmc-24.01-5_opn.fwpkg https://$DPUBMCIP/redfish/v1/UpdateService/update -
Monitor the firmware update progress:
# List the running tasks: curl -ks -H "X-Auth-Token: $BMCTOKEN" -X GET https://$DPUBMCIP/redfish/v1/TaskService/Tasks { "@odata.id": "/redfish/v1/TaskService/Tasks", "@odata.type": "#TaskCollection.TaskCollection", "Members": [ { "@odata.id": "/redfish/v1/TaskService/Tasks/0" } ], "Members@odata.count": 1, "Name": "Task Collection" } # Display the current progress curl -ks -H "X-Auth-Token: $BMCTOKEN" -X GET https://$DPUBMCIP/redfish/v1/TaskService/Tasks/0 | jq -r ' .PercentComplete' 30 -
Once the progress has reached 100% complete, initiate a reboot of the BMC:
curl -k -H "X-Auth-Token: $BMCTOKEN" -H "Content-Type: application/json" -X POST -d '{"ResetType": "GracefulRestart"}' https://$DPUBMCIP/redfish/v1/Managers/Bluefield_BMC/Actions/Manager.Reset -
Once the DPU BMC has rebooted, retrieve a new BMC Token and check the installed firmware version:
Bluefield 2:
export BMCTOKEN=`curl -k -H "Content-Type: application/json" -X POST https://$DPUBMCIP/login -d "{\"username\": \"root\", \"password\": \"$BMCPASS\"}" | grep token | awk '{print $2;}' | tr -d '"'`

curl -k -H "X-Auth-Token: $BMCTOKEN" -X GET https://$DPUBMCIP/redfish/v1/UpdateService/FirmwareInventory
# Use the Firmware ID from the first command to complete the firmware ID needed for the following command:
curl -k -H "X-Auth-Token: $BMCTOKEN" -X GET https://$DPUBMCIP/redfish/v1/UpdateService/FirmwareInventory/<firmware_id>_BMC_Firmware | jq -r ' .Version'
Bluefield 3:
export BMCTOKEN=`curl -k -H "Content-Type: application/json" -X POST https://$DPUBMCIP/login -d "{\"username\": \"root\", \"password\": \"$BMCPASS\"}" | grep token | awk '{print $2;}' | tr -d '"'`

curl -ks -H "X-Auth-Token: $BMCTOKEN" -X GET https://$DPUBMCIP/redfish/v1/UpdateService/FirmwareInventory/BMC_Firmware | jq -r ' .Version'
DPU ARM OS: Checking Secure Boot Status
To successfully boot from the Forge BFB image, the DPU ARM OS needs to have Secure Boot disabled and configured for HTTP PXE boot.
Check current secure boot settings
-
Log in to the staging server for the site
-
Set up the DPU IP, password environment variables:
export DPUBMCIP='BMC IP' export BMCPASS='BMC password' -
Check the current Secure Boot settings:
curl -k -u root:"$BMCPASS" -X GET https://$DPUBMCIP/redfish/v1/Systems/Bluefield/SecureBootNote: If you do not see the
SecureBootCurrentBootoption listed, you should install DOCA version 2.5.0If you see the following output, secure boot is enabled and it needs to be disabled:
{
  "@odata.id": "/redfish/v1/Systems/Bluefield/SecureBoot",
  "@odata.type": "#SecureBoot.v1_1_0.SecureBoot",
  "Description": "The UEFI Secure Boot associated with this system.",
  "Id": "SecureBoot",
  "Name": "UEFI Secure Boot",
  "SecureBootCurrentBoot": "Enabled",
  "SecureBootDatabases": {
    "@odata.id": "/redfish/v1/Systems/Bluefield/SecureBoot/SecureBootDatabases"
  },
  "SecureBootEnable": true,
  "SecureBootMode": "UserMode"
}
If you see
"SecureBootCurrentBoot": "Disabled",no action is required. You should attempt to boot the DPU ARM OS over the network:{ "@odata.id": "/redfish/v1/Systems/Bluefield/SecureBoot", "@odata.type": "#SecureBoot.v1_1_0.SecureBoot", "Description": "The UEFI Secure Boot associated with this system.", "Id": "SecureBoot", "Name": "UEFI Secure Boot", "SecureBootCurrentBoot": "Disabled", "SecureBootDatabases": { "@odata.id": "/redfish/v1/Systems/Bluefield/SecureBoot/SecureBootDatabases" }, "SecureBootEnable": true, "SecureBootMode": "UserMode" }
Disable Secure Boot
To disable if Secure Boot if it is enabled:
-
Run the command to disable Secure Boot:
curl -k -u root:"$BMCPASS" -X PATCH -H 'Content-Type: application/json' https://$DPUBMCIP/redfish/v1/Systems/Bluefield/SecureBoot -d '{"SecureBootEnable":false}' -
Restart the DPU ARM OS:
curl -k -u root:"$BMCPASS" -X POST -H 'Content-Type: application/json' https://$DPUBMCIP/redfish/v1/Systems/Bluefield/Actions/ComputerSystem.Reset -d '{"ResetType" : "GracefulRestart"}' -
Wait for the DPU ARM OS to boot and check if Secure Boot is enabled now:
curl -k -u root:"$BMCPASS" -X GET https://$DPUBMCIP/redfish/v1/Systems/Bluefield/SecureBootNote: You may need to run this step several times to disable secure boot. It may take up to 3 cycles of this for the setting to stick
If the "SecureBootCurrentBoot" setting is not shown, attempt to install DOCA 2.5.0:
-
Download the BFB image on the staging server:
mkdir DOCA cd DOCA wget https://image.azure.nvmetal.net/mirror/forge/DOCA_2.5.0_BSP_4.5.0_Ubuntu_22.04-1.23-10.prod.bfb --no-check-certificate -
Install the BFB image to the DPU ARM OS via the DPU BMC from the server with the BFB image:
export DPUBMCIP='BMC IP' export BMCPASS='BMC password' sshpass -p $BMCPASS scp -o StrictHostKeyChecking=no DOCA_2.5.0_BSP_4.5.0_Ubuntu_22.04-1.23-10.prod.bfb root@$DPUBMCIP:/dev/rshim0/boot -
Log on to the DPU BMC and reboot the DPU ARM OS:
echo SW_RESET 1 > /dev/rshim0/misc -
After the DPU ARM OS boots, log into the DPU ARM OS using the default password
-
Switch to root and set the default username passwod back to the default
-
Ensure that the DOCA firmware is up to date:
sudo -i bfvcheck /opt/mellanox/mlnx-fw-updater/mlnx_fw_updater.pl -
Check that the DPU ARM OS is configured for HTTPs boot. Log into the DPU ARM OS and switch to root,
-
List the current boot order:
efibootmgr -
If the boot order is set to something similar the following, no action is needed and you should reboot the DPU ARM OS:
BootCurrent: 0040 Timeout: 3 seconds BootOrder: 0000,0040,0001,0002,0003 Boot0000* NET-OOB-IPV4-HTTP Boot0001* NET-OOB.4040-IPV4 Boot0002* UiApp Boot0003* EFI Internal Shell Boot0040* ubuntu0 -
To set the correct boot order, create the /etc/bf.cfg file with the following contents:
echo "BOOT0=NET-OOB-IPV4-HTTP BOOT1=DISK BOOT2=NET-OOB.4040-IPV4" >> /etc/bf.cfg -
Run the bfcfg command to update the boot order:
bfcfg -
Verify that the boot order is no set to NET-OOB-IPV4-HTTP as default:
efibootmgr -
Reboot the DPU ARM OS from the RSHIM console and monitor the reboot/provisioning process
Note: If you see an error similar to the following during PXE boot, verify that Secure Boot is disabled correctly:
EFI stub: Booting Linux Kernel...
EFI stub: ERROR: FIRMWARE BUG: kernel image not aligned on 64k boundary
EFI stub: UEFI Secure Boot is enabled.
EFI stub: Using DTB from configuration table
Troubleshooting noDpuLogsWarning Alerts
The Forge noDpuLogsWarning alert fires under the following conditions:
- Forge has been receiving logs from the DPU ARM OS with in the last 30 days
- It has not received any forge-dpu-agent.service lg events within the last 10 minutes
- And opentelemetry-collector-prom end point running on the DPU ARM OS has been down for more than 5 minutes
The format of the alert name is "<Forge site ID>-noDpuLogsWarning (<Forge site ID> <DPU ARM OS hostname> forge-montioring/forge-monitoring-(<Forge site ID>-prometheus warning)
Common Causes of these alerts
-
The machine is currently being re-provisioned and taken longer than expected to completed provisioning
-
The machine is being worked on by another SRE team member. The machine might be powered off, undergoing maintenance or might have been force-deleted.
-
Issues with systemd services on the DPU ARM OS.
On the DPU ARM OS, check that node-exporter, otelcol-contrib and forge-dpu-otel-agent services are running and not reporting errors:
systemctl status node-exporter otelcol-contrib forge-dpu-otel-agent
- Hostname is not picked up by the OpenTelemetry Collector service
Connect to the OpenTelemetry collector port and check that metrics are being generated and check for any other errors:
curl 127.0.0.1:9999/metrics | grep telemetry_stats
...
telemetry_stats_log_records_total{component="telemetry_stats",grouping="logs_by_component",host_name="localhost",http_scheme="http",instance="127.0.0.1:8890",job="log-stats",log_component="journald",machine_id="fm100dsekkqjprbu96gq67vd6p24rc1uqnct6dv15opjka9he3qlbk3doc0",net_host_port="8890",service_instance_id="127.0.0.1:8890",service_name="log-stats",source="telemetrystatsprocessor:0.0.1",systemd_unit="kernel"} 272
...
In the example above, the hostname being used by the otelcol-contrib service (host_name="localhost") is set to localhost. The host_name should be set to the hostname of the DPU ARM OS. To resolve this issue, restart the OpenTelemrty Collector service:
systemctl restart otelcol-contrib
Wait for 5 minutes after restarting the service and check the metrics again:
curl http://127.0.0.1:9999/metrics | grep telemetry_stats
...
telemetry_stats_log_records_total{component="telemetry_stats",grouping="logs_by_component",host_name="192-168-134-165.nico.example.org",http_scheme="http",instance="127.0.0.1:8890",job="log-stats",log_component="journald",machine_id="fm100ds5eue9nh4kmhb2mkdh1jrthqso8r3lve4jvn51biitt509s86e8gg",net_host_port="8890",service_instance_id="127.0.0.1:8890",service_name="log-stats",source="telemetrystatsprocessor:0.0.1",systemd_unit="kernel"} 20
...
In this example the host_name is now set to 192-168-134-165.nico.example.org.
- Check carbide-hardware-health pod for errors scraping information from the IP address for the DPU:
kubectl logs carbide-hardware-health-67c95c7775-bd4mw -n forge-system --timestamps
If errors are being send against the endpoint, but it is available on the network (You can ping it, ssh to the DPU ARM OS and all services appear to be running with no errors), you can attempt to restart the carbide-hardware-health pod to see if this resolves the issues:
kubectl delete pod carbide-hardware-health-67c95c7775-bd4mw -n forge-system
Collecting Machine Diagnostic Information using carbide-admin-cli
This guide describes how to use the carbide-admin-cli debug bundle command to collect diagnostic information for troubleshooting machines managed by NCX Infra Controller (NICo). The command creates a ZIP file containing logs, health data, and machine state information.
What the Command Does
The debug bundle command collects data from two sources:
-
Grafana (Loki) (optional): Fetches logs using Grafana's Loki datasource
- Host machine logs
- NICo API logs
- DPU agent logs
- Note: Log collection is skipped if
--grafana-urlis not provided
-
NICo API: Fetches machine information
- Health alerts for the specified time range
- Health alert overrides
- Site controller details (BMC information)
- Machine state and validation results
ZIP File Contents
The generated ZIP file contains:
- Host machine logs from Grafana
- NICo API container logs from Grafana
- DPU agent logs from Grafana
- Machine health alerts for the time range
- Health alert overrides (if any are configured)
- Site controller details (BMC IP, port, and other controller information)
- Machine state, SLA status, reboot history, and validation test results
- Summary metadata with Grafana query links
Prerequisites
Before running the debug bundle command, ensure you have:
1. Access to carbide-admin-cli
You need carbide-admin-cli installed with valid client certificates to connect to the NICo API. Refer to your NICo installation documentation for setup instructions.
2. Grafana Authentication Token (Optional)
Note: This is only required if you want to collect logs. If --grafana-url is not provided, log collection is skipped.
Set the GRAFANA_AUTH_TOKEN environment variable:
export GRAFANA_AUTH_TOKEN=<your-grafana-token>
This token is used to authenticate with Grafana and fetch logs from the Loki datasource.
3. Network Proxy (if needed in your environment)
If you are running from an environment that requires a SOCKS proxy, set the proxy:
export https_proxy=socks5://127.0.0.1:8888
Note: When running from inside the cluster (carbide-api pod), the proxy is not required.
4. Required Information
- Machine ID: The host machine ID you want to collect debug information for
- Time Range: Start and end times for log collection
- Grafana URL (optional): Your Grafana base URL (e.g.,
https://grafana.example.com) - Output Path: Directory where the ZIP file will be saved
Running the Debug Bundle Command
Command Syntax
carbide-admin-cli -c <API_URL> mh debug-bundle <MACHINE_ID> --start-time <TIME> [--grafana-url <URL>] [--end-time <TIME>] [--output-path <PATH>] [--batch-size <SIZE>] [--utc]
Parameters
Required:
-c <API_URL>: NICo API endpoint- From outside cluster:
https://<your-nico-api-url>/ - From inside cluster:
https://127.0.0.1:1079
- From outside cluster:
<MACHINE_ID>: The machine ID to collect debug information for--start-time <TIME>: Start time in formatHH:MM:SSorYYYY-MM-DD HH:MM:SS
Optional:
--grafana-url <URL>: Grafana base URL (e.g.,https://grafana.example.com). If not provided, log collection is skipped.--end-time <TIME>: End time in formatHH:MM:SSorYYYY-MM-DD HH:MM:SS(default: current time)--output-path <PATH>: Directory where the ZIP file will be saved (default:/tmp)--batch-size <SIZE>: Batch size for log collection (default:5000, max:5000)--utc: Interpret start-time and end-time as UTC instead of local timezone
Examples
With Grafana configured (collect logs):
GRAFANA_AUTH_TOKEN=<your-token> \
https_proxy=socks5://127.0.0.1:8888 \
carbide-admin-cli -c https://<your-nico-api-url>/ mh debug-bundle \
  <machine-id> \
  --start-time 06:00:00 \
  --grafana-url https://grafana.example.com
With all options specified:
GRAFANA_AUTH_TOKEN=<your-token> \
https_proxy=socks5://127.0.0.1:8888 \
carbide-admin-cli -c https://<your-nico-api-url>/ mh debug-bundle \
  <machine-id> \
  --start-time 06:00:00 \
  --end-time 18:00:00 \
  --output-path /custom/path \
  --grafana-url https://grafana.example.com
Without Grafana (metadata only):
carbide-admin-cli -c https://<your-nico-api-url>/ mh debug-bundle \
  <machine-id> \
  --start-time 06:00:00
Understanding the Output
When you run the debug bundle command, it shows progress through multiple steps:
   Creating debug bundle for host: <machine-id>

Step 0: Fetching Loki datasource UID...
   Fetching Loki datasource UID from Grafana: https://grafana.example.com

Step 1: Downloading host-specific logs...
   Processing batch 1/1 (500 records)

Step 2: Downloading carbide-api logs...
   Processing batch 1/1 (250 records)

Step 3: Downloading DPU agent logs...
   Processing batch 1/1 (74 records)

Step 4: Fetching health alerts...
   Alerts: 42 records collected

Step 5: Fetching health alert overrides...
   Overrides: 2 overrides collected

Step 6: Fetching site controller details...
   Fetching BMC information for machine...

Step 7: Fetching machine info...
   Fetching machine state and metadata...

Debug Bundle Summary:
   Host Logs: 500 logs collected
   Carbide-API Logs: 250 logs collected
   DPU Agent Logs: 74 logs collected
   Health Alerts: 42 records
   Health Alert Overrides: 2 overrides
   Site Controller Details: Collected
   Machine State Information: Collected
   Total Logs: 824

Step 8: Creating ZIP file...

ZIP created: /tmp/20241121060000_<machine-id>.zip
Infiniband Runbook
Motivation
Infiniband This runbook describes the steps on infrastructure setup and configuration of enable Infiniband.
Unified Fabric Manager (UFM)
Installation
UFM 6.19.0 and up is recommended for configuring UFM in more security mode.
- Follow the prerequisites guidance to install all required packages, including the HA part.
- Follow the HA installation guidance to install the UFM in HA mode.
Configuration
After UFM is deployed, the following security features must be enabled on UFM and OpenSM to enable secure Infiniband support in a multi-tenant site.
The management key (M_Key) is used across the subnet, and the administration key (SA_key) is for services.
Perform the following steps on the host that provides the NVIDIA Unified Fabric Manager (UFM) server.
Static configurations
Update the following parameters in $UFM_HOME/ufm/files/conf/gv.cfg.
…
default_membership = limited
…
randomize_sa_key = true
…
m_key_per_port = true
…
Update the following parameters in $UFM_HOME/ufm/files/conf/opensm/opensm.conf.
…
m_key_protection_level 2
…
cc_key_enable 2
…
n2n_key_enable 2
…
vs_key_enable 2
…
sa_enhanced_trust_model TRUE
…
sa_etm_max_num_mcgs 128
…
sa_etm_max_num_srvcs 32
…
sa_etm_max_num_event_subs 32
…
Static Topology configuration
Static network configuration can be applied to enhance security of Infiniband cluster.
It should be described in specific config file, named topoconfig.conf. The file is located at
$UFM_HOME/ufm/files/conf/opensm/topoconfig.conf
The file format is
0x98039b0300867bba,1,0xb83fd2030080302e,1,Any,Active
0x98039b0300867bba,3,0xb83fd2030080302e,3,Any,Active
0xb83fd2030080302e,1,0x98039b0300867bba,1,Any,Active
0xb83fd2030080302e,3,0x98039b0300867bba,3,Any,Active
0xb83fd2030080302e,26,0xf452140300280040,1,Any,Active
0xb83fd2030080302e,29,0xf452140300280080,1,Any,Active
0xb83fd2030080302e,30,0xf452140300280081,1,Any,Active
with fields description as
Source GUID, Source Port, Destination GUID, Destination Port, Device type, Link State
Starting UFM v6.19.0 to enable ability of UFM to work with static topology configuration $UFM_HOME/ufm/files/conf/gv.cfg file should include following parameter
…
[SubnetManager]
…
# This parameter defines if topoconfig file could be used for opensm discovery.
topoconfig_enabled = true
…
while on previous UFM versions this ability is enabled in file $UFM_HOME/ufm/files/conf/opensm/opensm.conf as
…
# The file holding the topo configuration.
topo_config_file $UFM_HOME/ufm/files/conf/opensm/topoconfig.conf
# If set to true, the SM will adjust its operational
# mode to consider the topo_config file.
topo_config_enabled TRUE
…
File topoconfig.conf can be created and modified manually or using UFM REST API starting v6.19.0.
For example initial topoconfig.conf file can be created as
curl -k -u admin:123456 -X POST https://<ufm host name>/ufmRest/static_topology/sm_topology_file | jq
{
"SM topoconfig action": "Create topoconfig file",
"job_id": "1"
}
Request job by its ID to check job completion.
curl -k -u admin:123456 -X GET https://<ufm host name>/ufmRest/jobs/1 | jq
{
"ID": "1",
"Status": "Completed",
"Progress": 100,
"Description": "Create opensm topoconfig file",
"Created": "2024-10-27 08:09:16",
"LastUpdated": "2024-10-27 08:09:17",
"Summary": "/tmp/ibdiagnet_out/generated_topoconfig.conf",
"RelatedObjects": "",
"CreatedBy": "admin",
"Operation": "opensm topoconfig file management",
"Foreground": true,
"SiteName": null
}
Once Job will be completed, path on UFM server to generated topoconfig file will be part of job completion message (Summary). Default generated topoconfig file location location: /tmp/ibdiagnet_out/generated_topoconfig.conf
Configurations per UFM
And the following configuration should be configured per UFM:
sm_key
A random 64bit integer is required for the sm_key, RANDOM environment value is a simple way to generate it as follows.
root:/# printf '0x%04x%04x%04x%04x\n' $RANDOM $RANDOM $RANDOM $RANDOM
0x771d2fe77f553d47
Update the sm_key in $UFM_HOME/ufm/files/conf/opensm/opensm.conf with the generated 64bit integer as follows.
…
sm_key 0x771d2fe77f553d47
…
allowed_sm_list
Get the GUID of openSM from $UFM_HOME/ufm/files/conf/opensm/opensm.conf of each UFM in the fabric.
…
guid 0x1070fd03001763d4
…
Update allowed_sm_guids in $UFM_HOME/ufm/files/conf/opensm/opensm.conf as follows.
…
allowed_sm_guids 0x1070fd03001763d4,0x966daefffe2ac8d2
…
User management
Update the password of the admin as follows. The default password of the admin is 123456; and the new password must be:
- Minimum length is 4
- Maximum length is 30, composed of alphanumeric and "_" characters
root:/# curl -s -k -XPUT -H "Content-Type: application/json" -u admin:123456 -d '{"password": "45364nnfgd"}' https://ufm.example.org:443/ufmRest/app/users/admin
{
"name": "admin"
}
Generate a token for admin as follows:
root:/# curl -s -k -XPOST -u admin:x https://ufm.example.org:443/ufmRest/app/tokens | jq
{
"access_token": "x",
"revoked": false,
"issued_at": 1711608244,
"expires_in": 315360000,
"username": "admin"
}
After the configuration, restart the UFM HA cluster as follows:
root:/# ufm_ha_cluster stop
root:/# ufm_ha_cluster start
And then check UFM HA cluster status:
root:/# ufm_ha_cluster status
NICo
Installation
No additional steps are required to enable Infiniband in NCX Infra Controller (NICo).
Configuration
UFM Credential
One of two options can be selected to UFM Authentication mechanism such as token authentication or client authentication.
Follow the instructions in the section that applies to the selected option.
Token Authentication
Get the token of the admin user in UFM in above step, or get it again by following the rest api (the password of the admin user is required to get the token):
root:/# curl -s -k -XGET -u admin:password https://ufm:443/ufmRest/app/tokens | jq
[
{
"access_token": "token",
"revoked": false,
"issued_at": 1711609276,
"expires_in": 315360000,
"username": "admin"
}
]
Create the credential for UFM client in NICo by carbide-admin-cli as follows:
root:/# carbide-admin-cli credential add-ufm --url=https://<address:port> --token=<access_token>
Client Authentication (mTLS)
Mutual TLS, or mTLS for short, is a method for mutual authentication. mTLS ensures that the parties at each end of a network connection are who they claim to be by verifying that they both have the correct private key. The information within their respective TLS certificates provides additional verification. mTLS is often used in a Zero Trust security framework to verify users, devices, and servers within an organization. Zero Trust means that no user, device, or network traffic is trusted by default, an approach that helps eliminate many security vulnerabilities.
Configure UFM to enable mTLS according the instruction
UFM Server Certificates should include UFM Host Name <ufm host name> into The Subject Alternative Name (SAN) extension to the X.509 specification.
Note:
<ufm host name>should be asdefault.ufm.forge,default.ufm.<site domain name>. Whereis taken from initial_domain_nameNICo configuration parameter.
openssl x509 -in server.crt -text -noout | grep DNS
DNS:default.ufm.forge, DNS:default.ufm.nico.example.org
- direct IP address is not supported.
- for UFM version less than 6.18.0-5 following patch should be applied as
--- /opt/ufm/scripts/ufm_conf_creator.py 2024-07-31 16:18:58.360497118 +0000
+++ /opt/ufm/scripts/ufm_conf_creator.py 2024-07-31 16:20:01.480677706 +0000
@@ -213,6 +213,7 @@
self.fo.write(' SSLCertificateFile %s\n' % SERVER_CERT_FILE)
self.fo.write(' SSLCertificateKeyFile %s\n' % SERVER_CERT_KEY_FILE)
self.fo.write(' SSLCACertificateFile %s\n' % CA_CERT_FILE)
+ self.fo.write(' SSLVerifyClient require\n')
self.fo.write('</VirtualHost>\n')
def get_apache_conf_path(self):
Select Client Authentication mode.
Existing NICo certificates such as /run/secrets/spiffe.io/{tls.crt,tls.key,ca.crt} are used for client side.
carbide-admin-cli credential add-ufm --url=<ufm host name>
Generate UFM server certificate using Vault.
Enter this command to create server UFM certificates using the vault:
carbide-admin-cli credential generate-ufm-cert --fabric=default
UFM Server Certificates have predefined names as default-ufm-ca-intermediate.crt, default-ufm-server.crt, default-ufm-server.key and stored under /var/run/secrets location on carbide-api pod.
Enter Docker UFM container.
docker exec -it ufm /bin/bash
Store server certificates at specific location.
Create UFM Server certificates using certificates generated on previous step in the UFM specific location and with predefined file names.
/opt/ufm/files/conf/webclient/ca-intermediate.crt
/opt/ufm/files/conf/webclient/server.key
/opt/ufm/files/conf/webclient/server.crt
Assign UFM Client Host Name with UFM admin role.
It should be value from client certificate SAN record for example: carbide-api.forge.
/opt/ufm/scripts/manage_client_authentication.sh associate-user --san carbide-api.forge --username admin
curl -s -k -XGET -u admin:123456 https://<client host name>/ufmRest/app/client_authentication/settings | jq
{
"enable": false,
"client_cert_sans": [
{
"san": "<client host name>",
"user": "admin"
}
],
"ssl_cert_hostnames": [],
"ssl_cert_file": "Not present",
"ca_intermediate_cert_file": "Not present",
"cert_auto_refresh": {}
}
Set UFM Server Host Name for certificate verification.
It should be value from server certificate SAN record for example: default.ufm.forge.
/opt/ufm/scripts/manage_client_authentication.sh set-ssl-cert-hostname --hostname default.ufm.forge
curl -s -k -XGET -u admin:123456 https://<ufm host name>/ufmRest/app/client_authentication/settings | jq
{
"enable": false,
"client_cert_sans": [
{
"san": "<client host name>",
"user": "admin"
}
],
"ssl_cert_hostnames": [
"<server host name>"
],
"ssl_cert_file": "Not present",
"ca_intermediate_cert_file": "Not present",
"cert_auto_refresh": {}
}
Enable mTLS in UFM configuration file /opt/ufm/files/conf/gv.cfg.
# Whether to authenticate web client by SSL client certificate or username/password.
client_cert_authentication = true
Restart UFM.
/etc/init.d/ufmd restart
Check functionality.
Existing carbide certificates such as /run/secrets/spiffe.io/{tls.crt,tls.key,ca.crt} are used for verification.
curl -v -s --cert-type PEM --cacert ca.crt --key tls.key --cert tls.crt -XGET https://<ufm host name>/ufmRest/app/ufm_version | jq
* Trying 192.168.121.78:443...
* TCP_NODELAY set
* Connected to carbide-api.forge (192.168.121.78) port 443 (#0)
* ALPN, offering h2
* ALPN, offering http/1.1
* successfully set certificate verify locations:
* CAfile: ca.crt
CApath: /etc/ssl/certs
} [5 bytes data]
* TLSv1.3 (OUT), TLS handshake, Client hello (1):
} [512 bytes data]
* TLSv1.3 (IN), TLS handshake, Server hello (2):
{ [112 bytes data]
* TLSv1.2 (IN), TLS handshake, Certificate (11):
{ [1232 bytes data]
* TLSv1.2 (IN), TLS handshake, Server key exchange (12):
{ [147 bytes data]
* TLSv1.2 (IN), TLS handshake, Server finished (14):
{ [4 bytes data]
* TLSv1.2 (OUT), TLS handshake, Client key exchange (16):
} [37 bytes data]
* TLSv1.2 (OUT), TLS change cipher, Change cipher spec (1):
} [1 bytes data]
* TLSv1.2 (OUT), TLS handshake, Finished (20):
} [16 bytes data]
* TLSv1.2 (IN), TLS handshake, Finished (20):
{ [16 bytes data]
* SSL connection using TLSv1.2 / ECDHE-ECDSA-AES256-GCM-SHA384
* ALPN, server accepted to use http/1.1
* Server certificate:
* subject: [NONE]
* start date: Jun 18 02:52:24 2024 GMT
* expire date: Jul 18 02:52:54 2024 GMT
* subjectAltName: host "carbide-api.forge" matched cert's "carbide-api.forge"
* issuer: O=NVIDIA Corporation; CN=NVIDIA Forge Intermediate CA 2023 - pdx-qa2
* SSL certificate verify ok.
} [5 bytes data]
> GET /ufmRest/app/ufm_version HTTP/1.1
> Host: carbide-api.forge
> User-Agent: curl/7.68.0
> Accept: */*
>
{ [5 bytes data]
* TLSv1.2 (IN), TLS handshake, Hello request (0):
{ [4 bytes data]
* TLSv1.2 (OUT), TLS handshake, Client hello (1):
} [252 bytes data]
* TLSv1.2 (IN), TLS handshake, Server hello (2):
{ [121 bytes data]
* TLSv1.2 (IN), TLS handshake, Certificate (11):
{ [1232 bytes data]
* TLSv1.2 (IN), TLS handshake, Server key exchange (12):
{ [147 bytes data]
* TLSv1.2 (IN), TLS handshake, Request CERT (13):
{ [159 bytes data]
* TLSv1.2 (IN), TLS handshake, Server finished (14):
{ [4 bytes data]
* TLSv1.2 (OUT), TLS handshake, Certificate (11):
} [1228 bytes data]
* TLSv1.2 (OUT), TLS handshake, Client key exchange (16):
} [37 bytes data]
* TLSv1.2 (OUT), TLS handshake, CERT verify (15):
} [111 bytes data]
* TLSv1.2 (OUT), TLS change cipher, Change cipher spec (1):
} [1 bytes data]
* TLSv1.2 (OUT), TLS handshake, Finished (20):
} [16 bytes data]
* TLSv1.2 (IN), TLS handshake, Finished (20):
{ [16 bytes data]
* old SSL session ID is stale, removing
{ [5 bytes data]
* Mark bundle as not supporting multiuse
< HTTP/1.1 200 OK
< Date: Tue, 02 Jul 2024 11:28:57 GMT
< Server: TwistedWeb/22.4.0
< Content-Type: application/json
< Content-Length: 34
< Rest-Version: 1.6.0
< X-Frame-Options: DENY
< X-Content-Type-Options: nosniff
< X-XSS-Protection: 1; mode=block
< Content-Security-Policy: script-src 'self'
< ClientCertAuthen: yes
<
{ [34 bytes data]
* Connection #0 to host carbide-api.forge left intact
{
"ufm_release_version": "6.14.5-2"
}
carbide-api-site-config
Update the configmap carbide-api-site-config-files to configure
the UFM address/endpoint and the pkey range that is used per fabric as follows.
Infiniband typically expresses Pkeys in hex; the available range is “0x0 ~ 0x7FFF”.
[ib_fabrics.default]
endpoints = ["https://10.217.161.194:443/"]
pkeys = [{ start = "256", end = "2303" }]
Note that currently NICo only supports only a single IB fabric. Therefore only
the fabric ID default will be accepted here.
NOTE: A pkey will be generated for all partitions that are managed by NICo; ensure sure the range does not conflict with the existing pkey in UFM (if any).
Update the configmap carbide-api-site-config-files to enable Infiniband features as follows:
[ib_config]
enabled = true
To enable the monitor of IB, update the the configmap carbide-api-site-config-files as follows:
[ib_fabric_monitor]
enabled = true
Restart carbide-api
Restart carbide-api to enable Infiniband in site-controller.
Rollback
Update the configmap forge-system/carbide-api-site-config-files to disable Infiniband features as follows:
[ib_config]
enabled = false
Restart carbide-api to disable Infiniband in site-controller.
FAQ
Where’s the UFM home directory?
The default home directory is /opt/ufm.
How to check UFM connection?
There is a debug tools for QA/SRE to check the address/token of UFM:
root@host-client:/$ kubectl apply -f https://bit.ly/debug-console
root@host-client:/$ kubectl exec -it debug-console -- /bin/bash
root@host-worker:/# export UFM_ADDRESS=https://<ufm address>
root@host-worker:/# export UFM_TOKEN=<ufm token>
root@host-worker:/# ufmctl list
IGNORING SERVER CERT, Please ensure that I am removed to actually validate TLS.
Name Pkey IPoIB MTU Rate Level
api_pkey_0x5 0x5 true 2 2.5 0
api_pkey_0x6 0x6 true 2 2.5 0
management 0x7fff true 2 2.5 0
The default partition (management/0x7fff) will include all available ports in the fabric; use the view sub-command to list all available ports as follows.
root@host-worker:/# ufmctl view --pkey 0x7fff
Name : management
Pkey : 0x7fff
IPoIB : true
MTU : 2
Rate Limit : 2.5
Service Level : 0
Ports :
GUID ParentGUID PortType SystemID LID LogState Name SystemName
1070fd0300bd494c - pf 1070fd0300bd494c 3 Active 1070fd0300bd494c_1 localhost ibp202s0f0
1070fd0300bd588d - pf 1070fd0300bd588c 10 Active 1070fd0300bd588d_2 localhost ibp202s0f0
1070fd0300bd494d - pf 1070fd0300bd494c 9 Active 1070fd0300bd494d_2 localhost ibp202s0f0
b83fd20300485b2e - pf b83fd20300485b2e 1 Active b83fd20300485b2e_1 PDX01-M01-H19-UFM-storage-01
1070fd0300bd5cec - pf 1070fd0300bd5cec 5 Active 1070fd0300bd5cec_1 localhost ibp202s0f0
1070fd0300bd5ced - pf 1070fd0300bd5cec 8 Active 1070fd0300bd5ced_2 localhost ibp202s0f0
1070fd0300bd588c - pf 1070fd0300bd588c 7 Active 1070fd0300bd588c_1 localhost ibp202s0f0
How to check the auth token and UFM IP in NICo?
After configuring UFM credentials in NICo, using the following commands to check whether the token was updated in Vault accordingly.
kubectl exec -it vault-0 -n vault -- /bin/sh
vault kv get -field=UsernamePassword --tls-skip-verify secrets/ufm/default/auth
This returns something like
======== Secret Path ========
secrets/data/ufm/default/auth
======= Metadata =======
Key Value
--- -----
created_time 2024-10-17T15:08:13.312903569Z
custom_metadata <nil>
deletion_time n/a
destroyed false
version 2
========== Data ==========
Key Value
--- -----
UsernamePassword map[password:ABCDEF username:https://1.2.3.4:443/]
The username here encodes the UFM address, while the password identifies the auth token.
SRE can also check the InfiniBand fabric monitor metrics emitted by NICo to determine whether it can reach UFM. E.g. the following graph shows a scenario where
- First NICo could not connect to UFM to invalid credentials
- Fixing the credentials provided access and lead UFM metrics (version number) to be emitted
How to check the log of UFM?
Check the log of rest api:
root:/# tail $UFM_HOME/files/log/rest_api.log
2024-03-28 07:42:02.954 rest_api INFO user: ufmsystem, url: (http://127.0.0.1:8000/app/ufm_version/), method: (GET)
2024-03-28 07:42:22.955 rest_api INFO user: ufmsystem, url: (http://127.0.0.1:8000/app/ufm_version/), method: (GET)
2024-03-28 07:42:42.957 rest_api INFO user: ufmsystem, url: (http://127.0.0.1:8000/app/ufm_version/), method: (GET)
2024-03-28 07:43:02.960 rest_api INFO user: ufmsystem, url: (http://127.0.0.1:8000/app/ufm_version/), method: (GET)
2024-03-28 07:43:22.959 rest_api INFO user: ufmsystem, url: (http://127.0.0.1:8000/app/ufm_version/), method: (GET)
2024-03-28 07:43:42.963 rest_api INFO user: ufmsystem, url: (http://127.0.0.1:8000/app/ufm_version/), method: (GET)
2024-03-28 07:44:02.960 rest_api INFO user: ufmsystem, url: (http://127.0.0.1:8000/app/ufm_version/), method: (GET)
2024-03-28 07:44:22.963 rest_api INFO user: ufmsystem, url: (http://127.0.0.1:8000/app/ufm_version/), method: (GET)
2024-03-28 07:44:42.964 rest_api INFO user: ufmsystem, url: (http://127.0.0.1:8000/app/ufm_version/), method: (GET)
2024-03-28 07:45:02.964 rest_api INFO user: ufmsystem, url: (http://127.0.0.1:8000/app/ufm_version/), method: (GET)
Check the log of UFM:
root:/# tail $UFM_HOME/files/log/ufm.log
2024-03-28 07:46:17.742 ufm INIT Request Polling Delta Fabric
2024-03-28 07:46:17.746 ufm INIT Get Polling Delta Fabric
2024-03-28 07:46:29.189 ufm INIT Prometheus Client: Start request for session 0
2024-03-28 07:46:29.190 ufm INIT Prometheus Client: Total Processing time = 0.001149
2024-03-28 07:46:29.191 ufm INIT handled device stats. (6) 28597.53 devices/sec. (10) 47662.55 ports/sec.
2024-03-28 07:46:47.748 ufm INIT Request Polling Delta Fabric
2024-03-28 07:46:47.751 ufm INIT Get Polling Delta Fabric
2024-03-28 07:46:59.190 ufm INIT Prometheus Client: Start request for session 0
2024-03-28 07:46:59.191 ufm INIT Prometheus Client: Total Processing time = 0.001762
2024-03-28 07:46:59.192 ufm INIT handled device stats. (6) 25497.29 devices/sec. (10) 42495.48 ports/sec.
How to update pool.pkey?
Did not support updating pool.pkey after configuration.
Reference
Glossary
Forge & Carbide
You will see references to the name "Forge" and "Carbide". These were names for internal NVIDIA projects that were the precursors to NCX Infra Controller. Some of the names lives on in the source and docs but references to these things are being removed over time as we try to break as little code and commands as possible.
BGP (Border Gateway Protocol)
https://en.wikipedia.org/wiki/Border_Gateway_Protocol
Border Gateway Protocol (BGP) is a standardized exterior gateway protocol designed to exchange routing and reachability information among autonomous systems (AS) on the Internet.
BMC (Baseboard Management Controller)
Runs the BIOS, controls power on/off of the machine it's responsible for. The Host has a BMC, and the DPU has a separate BMC. The Host's BMC runs a web server which provides both a web interface to manage BIOS settings, and a Redfish API. The BMC is how we can programmatically reboot a machine.
Cloud-Init
https://cloudinit.readthedocs.io/en/latest/
Cloud-init is the industry standard multi-distribution method for cross-platform cloud instance initialization. During boot, cloud-init identifies the cloud it is running on and initializes the system accordingly. Cloud instances will automatically be provisioned during first boot with networking, storage, ssh keys, packages and various other system aspects already configured.
Cloud-init is used by Carbide to install components that are required on top of the base OS image:
- DPUs use a Carbide provided cloud-init file to install Carbide related components on top of the base DPU image that is provided by the NVIDIA networking group.
- Customers/tenants can provide a custom cloud-init will do the work of automating installation for customer OS's
DHCP (Dynamic Host Configuration Protocol)
https://en.wikipedia.org/wiki/Dynamic_Host_Configuration_Protocol
The Dynamic Host Configuration Protocol (DHCP) is a network management protocol used on Internet Protocol (IP) networks for automatically assigning IP addresses and other communication parameters to devices connected to the network using a client–server architecture.
Within Carbide, both DPUs and Hosts are using DHCP request to resolve their IP. The Carbide infrastructure responds to those DHCP requests, an provides a response based on known information about the host.
DNS (Domain Name System)
https://en.wikipedia.org/wiki/Domain_Name_System
DNS is a protocol that is used to resolve the internet addresses (IPs) of services based on a domain name.
DPU
DPU - A Mellanox BlueField 2 (or 3) network interface card. It has an ARM processor and runs a modified Ubuntu. It has its own BMC. It can act as a network card and as a disk controller.
HBN (Host Based Networking)
Software networking switch running in a container on the DPU. Manages network routing. Runs Cumulus Linux. Carbide controls it via VPC and forge-dpu-agent.
https://docs.nvidia.com/doca/sdk/pdf/doca-hbn-service.pdf
Host
A Host is the computer the way a customer thinks of it, currently with an x86 processor. It is the "bare metal" we are managing. It runs whatever OS the customer puts in it. See also ManagedHost and DPU.
Instance
An Instance is a Host currently being used by a customer.
IPMI (Intelligent Platform Management Interface)
https://en.wikipedia.org/wiki/Intelligent_Platform_Management_Interface
The Intelligent Platform Management Interface (IPMI) is a set of computer interface specifications for an autonomous computer subsystem that provides management and monitoring capabilities independently of the host system's CPU, firmware (BIOS or UEFI) and operating system. IPMI defines a set of interfaces used by system administrators for out-of-band management of computer systems and monitoring of their operation. For example, IPMI provides a way to manage a computer that may be powered off or otherwise unresponsive by using a network connection to the hardware rather than to an operating system or login shell. Another use case may be installing a custom operating system remotely.
iPXE
https://en.wikipedia.org/wiki/IPXE
iPXE is an open-source implementation of the Preboot eXecution Environment (PXE) client software and bootloader. It can be used to enable computers without built-in PXE capability to boot from the network, or to provide additional features beyond what built-in PXE provides.
Leaf
In the Carbide project, we call "Leaf" the device that the host (which we to make available for tenants) plugs into. This is typically a DPU that will make the overlay network available to the tenant. In future iterations of the Carbide project, the Leaf might be a specialized switch instead of a DPU.
Machine
Generic term for either a DPU or a Host. Compare with ManagedHost.
ManagedHost
A ManagedHost is a box in a data center. It contains two Machine: one DPU and one Host.
POD
A Kubernetes thing
PXE
In computing, the Preboot eXecution Environment, PXE specification describes a standardized client–server environment that boots a software assembly, retrieved from a network, on PXE-enabled clients.
In Carbide, DPUs and Hosts are using PXE after startup to install both the Carbide specific software images as well as the images that the tenant wants to run.
VLAN
A 12-bit ID inserted into an Ethernet frame to identify which virtual network it belongs to. Switches/routers are VLAN aware. The limitations of only have 4096 VLAN IDs means that VXLAN is usually used instead.
In our setup VLAN IDs only exist in the DPU-Host communication, and would be needed if the host was running a Hypervisor. The VLAN ID would identify which virtual machine the Ethernet frame should be delivered to.
See also: VXLAN.
VNI
Another name for VXLAN ID. See VXLAN.
VTEP
VXLAN Tunnel EndPoint. See VXLAN.
VXLAN
Virtual Extensible LAN. In a data center we often want to pretend that we have multiple networks, but using a single set of cables. A customer will want all their machines to be on a single network, separate from the other customers, but we don't want to run around plugging cables in every time tenants change. The answer to this is virtual networks. An Ethernet packet is wrapped in a VXLAN packet which identifies which virtual network it is part of.
The VXLAN packet is just an 8-byte header, mostly consisting of a 24-bit identifier, known as the VXLAN ID or VNI. The VXLAN wrapping / unwrapping is done by a VTEP. In our case the DPU is the VTEP. The customers' Ethernet frame goes into a VXLAN packet identified by a VXLAN ID or VNI, that goes in a UDP packet which is routed like any other IP packet to its receiving VTEP (in our case usually another DPU), where it gets unwrapped and continues as an Ethernet frame. This allows the data center networking to only route IP packets, and allows the x86 host to believe it got an Ethernet frame from a machine on the same local network.