RAPIDS Per Stage Flame Graph
The RAPIDS Accelerator for Apache Spark provides a way to generate flame graphs for each stage of a Spark job. This can be useful for performance tuning and understanding where time is being spent in your Spark application.
To enable this feature you simply need to set the config called spark.rapids.flameGraph.pathPrefix, which plays as a toggle for the Per Stage Flamegraph feature. Besides this config, we also have several other configs:
| Explanation | Default value | When do you need to care this config | |
|---|---|---|---|
| spark.rapids.flameGraph.pathPrefix | The destination for storing the flame graph file. E.g. /tmp/folder/ or hdfs://namenode:port/folder, relative path is not valid | Not set (not enabled) | Always |
| spark.rapids.flameGraph.executors | On what executors to enable async profiler | *, meaning all executors, you can replace with comma-separated list of executors IDs and hyphenated ranges of executor IDs | Unless necessary |
| spark.rapids.flameGraph.asyncProfiler.options | The profiler options | jfr,event=cpu,wall=10ms | Unless necessary |
| spark.rapids.flameGraph.jfr.compression | Enable compression for JFR files generated by async profiler | false | To save disk space |
| spark.rapids.flameGraph.stageEpochInterval | Interval in seconds to determine stage epoch based on running task counts | 5 | When stages run concurrently |
spark.scheduler.mode
It is strongly recommended to set spark.scheduler.mode to FIFO, so that the next stage’s task will not start running until tasks from the current stage are finished (even though it is not guaranteed). This tends to create a clearer boundary for stages and then we can get a clean per stage JFR file.
Stage Epoch Determination
Even with FIFO scheduling, we cannot guarantee perfect stage boundaries due to various factors like out-of-order submissions, task failures, stragglers, etc. To handle these cases, the profiler uses a task-count-based approach to determine stage epochs.
The profiler periodically checks which stage has the most running tasks and switches profiling to that stage if:
- The dominant stage has more than 50% of all running tasks
- The dominant stage is different from the currently profiled stage
This interval is controlled by spark.rapids.flameGraph.stageEpochInterval (default 5 seconds).
More Java Options
It’s also recommended to add the following to your Spark session configuration for a more precise flame graph.
spark.executor.extraJavaOptions=-XX:+UnlockDiagnosticVMOptions -XX:+DebugNonSafepoints -XX:+PreserveFramePointer
Visualization
Currently the built-in async profiler generates a couple of JFR files in the spark.rapids.flameGraph.pathPrefix, one JFR per executor per stage. You can use your IDE to open such files, but it is more recommended to run an additional command (in the root folder of an async profiler 4.0 release: https://github.com/async-profiler/async-profiler/releases ) to convert the JFR file to html file for visualization.
hongbin at ws3 in [~/develop/async-profiler-4.0-linux-x64]
16:43:09 › java -cp lib/converter.jar jfr2flame ~/Downloads/spark-kubernetes-executor_var_log_tiger_async-35-11.jfr  117393386_parquetscan_stage_11.html
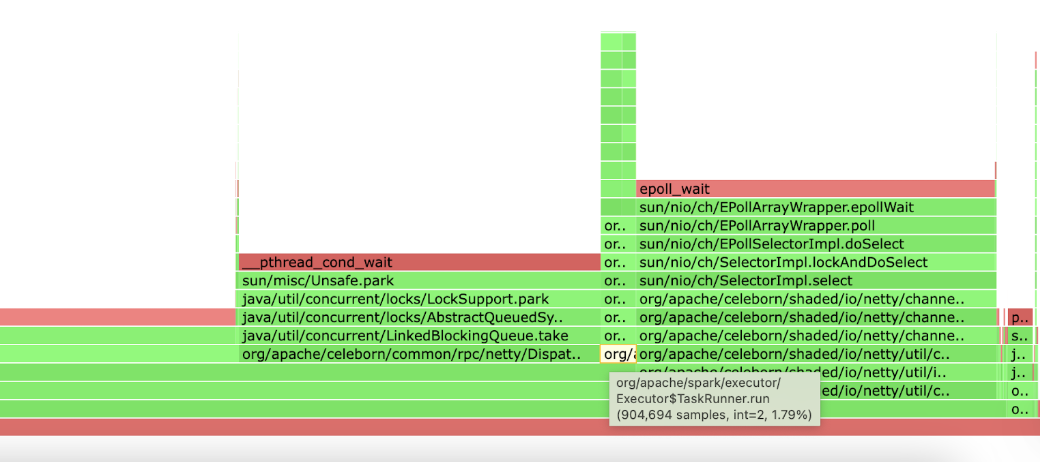
Then open the html file in your web browser and you’ll get a nice flame graph. Remember by default we’re collecting a CPU wall clock flame graph, that means even idle thread pools will create a large “sub-flame”. So if you’re only interested in what’s happening in the main task threads, you should find the “sub-flame” rooted in a node called “TaskRunner.run”, click it and get a detailed view of the “sub-flame”.