NCCL Errors#
What is NCCL?#
NCCL (NVIDIA Collective Communications Library) is a library that provides highly optimized multi-GPU and multi-node communication primitives for deep learning workloads. It implements collective operations like AllReduce, Broadcast, ReduceScatter, and AllGather that are essential for distributed training.
NCCL operates as a low-level communication layer that:
Manages GPU-to-GPU communication within a node and across nodes
Optimizes data transfers using NVIDIA’s NVLink, PCIe, and InfiniBand/Ethernet networks
Provides topology-aware routing for maximum bandwidth utilization
Handles synchronization across multiple GPUs and nodes
For more details, see the official NCCL documentation .
What is an NCCL Watchdog Timeout?#
NCCL includes a watchdog mechanism that monitors collective operations for hangs or deadlocks. When a collective operation (e.g., AllReduce) takes longer than the configured timeout period, NCCL’s watchdog will abort the operation and raise an error.
The watchdog timeout is controlled by the NCCL_TIMEOUT environment variable (default is 1800 seconds or 30 minutes).
NCCL watchdog timeout errors are often observed in large-scale multi-node multi-GPU training jobs. Common symptoms include:
Error messages like
NCCL watchdog timeoutorNCCL operation timed outTraining jobs hanging before the timeout triggers
Inconsistent progress across different GPUs or nodes
When Do You Hit NCCL Timeouts?#
Important
NCCL watchdog timeouts can be caused by user programming issues or network/hardware issues.
1. Imbalanced Workloads
Uneven data loading across ranks (Imbalanced batches in data parallel training)
Conditional logic that causes some ranks to skip iterations
Extra workloads on some ranks (e.g., rank 0) that cause delays
2. Deadlocks and Synchronization Issues
Mismatched collective calls across ranks (different order or count)
Rank divergence due to unguarded control flow
Exceptions in one rank preventing it from reaching collective operations
Improper use of NCCL communicators or CUDA streams
Training not launched at the same time across all ranks:
Various time across nodes for extra dependency installation
Various time across nodes for extra data preparation
3. Resource Contention
GPU out-of-memory conditions causing swapping or allocation delays
CPU over-subscription affecting data processing
I/O bottlenecks from writing to local storage or mounted file systems
Local storage or mounted file systems out of space blocking checkpointing or writing logs
4. Network and Hardware Issues
Degraded network connections or network hardware failures
Hardware failures affecting specific GPUs or nodes:
GPU hardware failures or thermal throttling
GPU or MLNX NIC drops
ECC memory errors causing GPU resets
Node reboots or nodes being removed from the cluster
Learn More About Your Workflow Failure in OSMO#
When troubleshooting NCCL errors in OSMO, start by gathering information about your workflow’s execution state and logs.
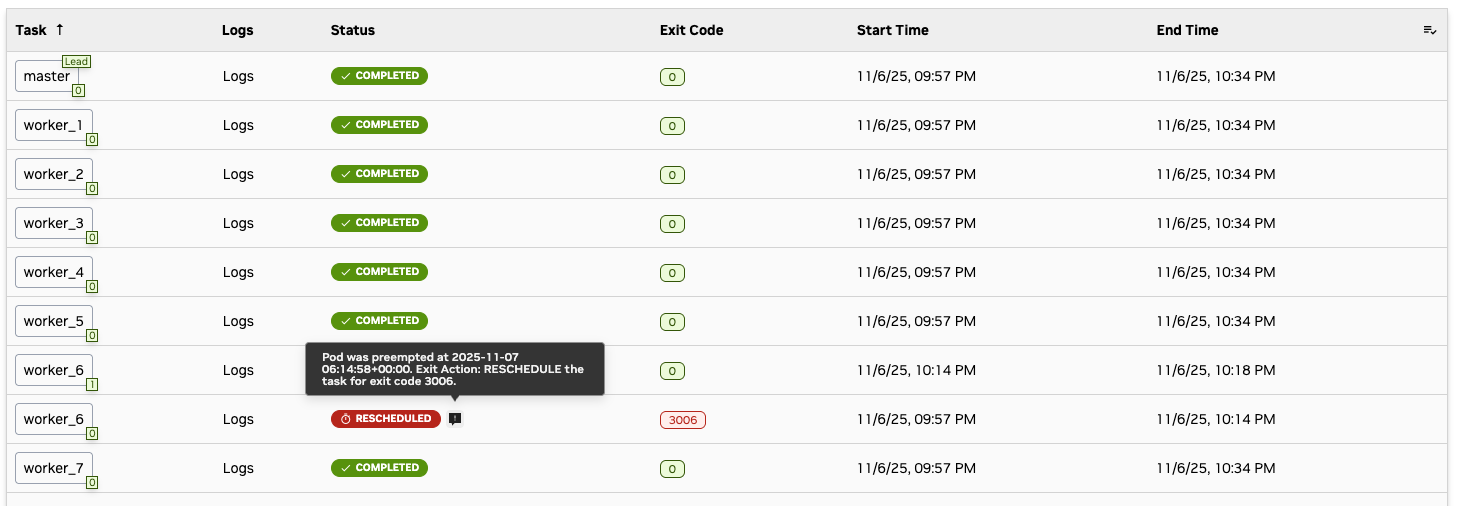
1. Understand Your Task Status and Exit Code
Check the workflow dashboard and identify which tasks failed:
The number on the right corner of the task name shows the retry id of the task. If it is greater than 0, it means the task has been rescheduled on a new node.
If your tasks take more than one page, you can click the column name (e.g.
StatusorExit Code) to sort the tasks by the column value.Click a certain exit code to see what it stands for.
Hover your cursor over a failed status to see the failure reason.
You can click the task name to see more details about the task.
You can click the node name to check the latest status of that node.
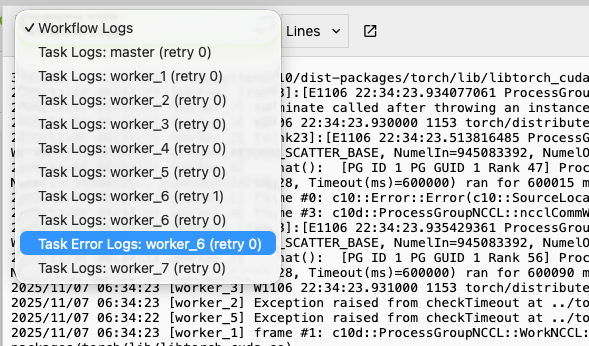
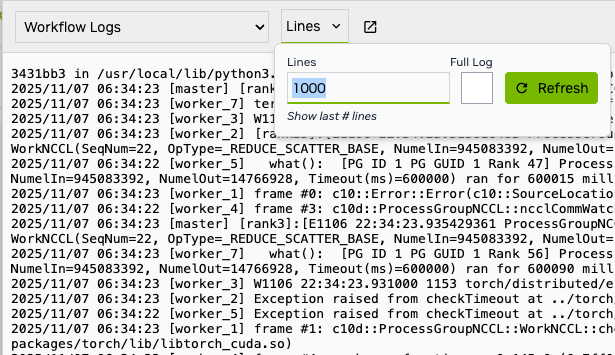
2. Access Task Logs and Error Logs
You can check individual task logs and error logs to see the specific error messages. By default, we show the latest 1000 lines, change it to see more logs.
|
|
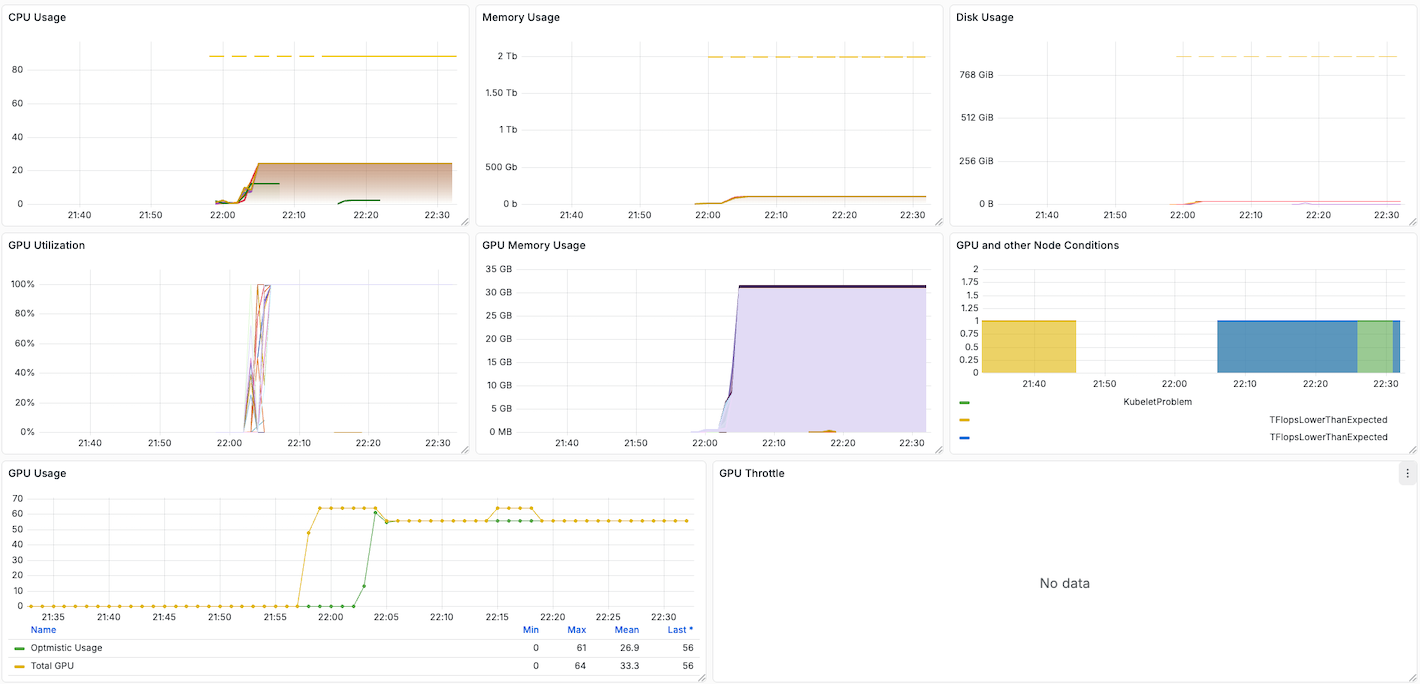
3. Monitor Resource Usage Dashboard
OSMO provides a resource usage dashboard under the Workflow Details panel.
Resource usage dashboard will show you how your usage on CPU, Memory and GPU during the workflow execution.
Look for any abnormal patterns that may cause NCCL timeout (e.g., spikes, leaks, etc.).
Pay attention to the GPU and other Node Conditions panel,
it indicates whether a hardware issue is detected on any node.
How to Debug NCCL Issues in Your Code#
Once you have gathered information from OSMO, debug your code using these techniques.
1. Synchronize Training Start Time Across All Ranks
OSMO automatically ensures that all tasks in the same group start their entry commands at the same time. This prevents different initialization timing across ranks from causing NCCL watchdog timeout issues.
However, if you perform custom dependency installation or data preparation that takes varying amounts of time across nodes, you should manually synchronize the training start time to ensure all ranks begin collective operations together.
For more details, see Synchronizing Training Start Time (Optional).
2. Enable NCCL Debug Logging
Set NCCL environment variables in your workflow spec to capture detailed debugging information:
tasks:
 - name: training
   environment:
     NCCL_DEBUG: INFO
2. Tuning NCCL Parameters
NCCL has many parameters that can be tuned to improve performance. For more details, see NCCL Parameters .
Set the NCCL parameters in your workflow spec, for example:
tasks:
 - name: training
   environment:
     NCCL_SOCKET_NTHREADS: 4
     NCCL_NSOCKS_PERTHREAD: 8
     NCCL_BUFFSIZE: 8388608
     NCCL_MIN_NCHANNELS: 4
     NCCL_P2P_LEVEL: NVL
     NCCL_ALGO: Tree
     NCCL_PROTO: Simple
     NCCL_DEBUG: INFO  # (1)
     NCCL_DEBUG_SUBSYS: NET  # (2)
Enable debugging (remove after testing)
Enable debugging (remove after testing)
3. Increase Watchdog Timeout for Debugging
Increase the NCCL watchdog timeout to allow more time for slow operations or intermittent network issues.
Set the timeout when initializing the process group in your training code:
import torch.distributed as dist
from datetime import timedelta

# Set timeout when initializing process group (default is 30 minutes)
dist.init_process_group(
    backend='nccl',
    timeout=timedelta(minutes=60)
)
For more information, see torch.distributed.init_process_group .
4. Use PyTorch Distributed Flight Recorder
Enable PyTorch’s built-in profiling for distributed operations:
import torch.distributed as dist

dist.set_debug_level(dist.DebugLevel.DETAIL)  # (1)
You can also set the debug level using the
TORCH_DISTRIBUTED_DEBUGenvironment variable in your workflow spec (e.g.,TORCH_DISTRIBUTED_DEBUG: "DETAIL").
Making Your Code Fault-Tolerant#
To make your training code resilient to NCCL errors and transient failures, implement checkpointing and configure automatic rescheduling.
For a comprehensive guide on implementing fault-tolerant training with automatic task rescheduling and checkpoint resumption, see Fault-Tolerant Training with Rescheduling.