

Visualizing the spherical harmonics#
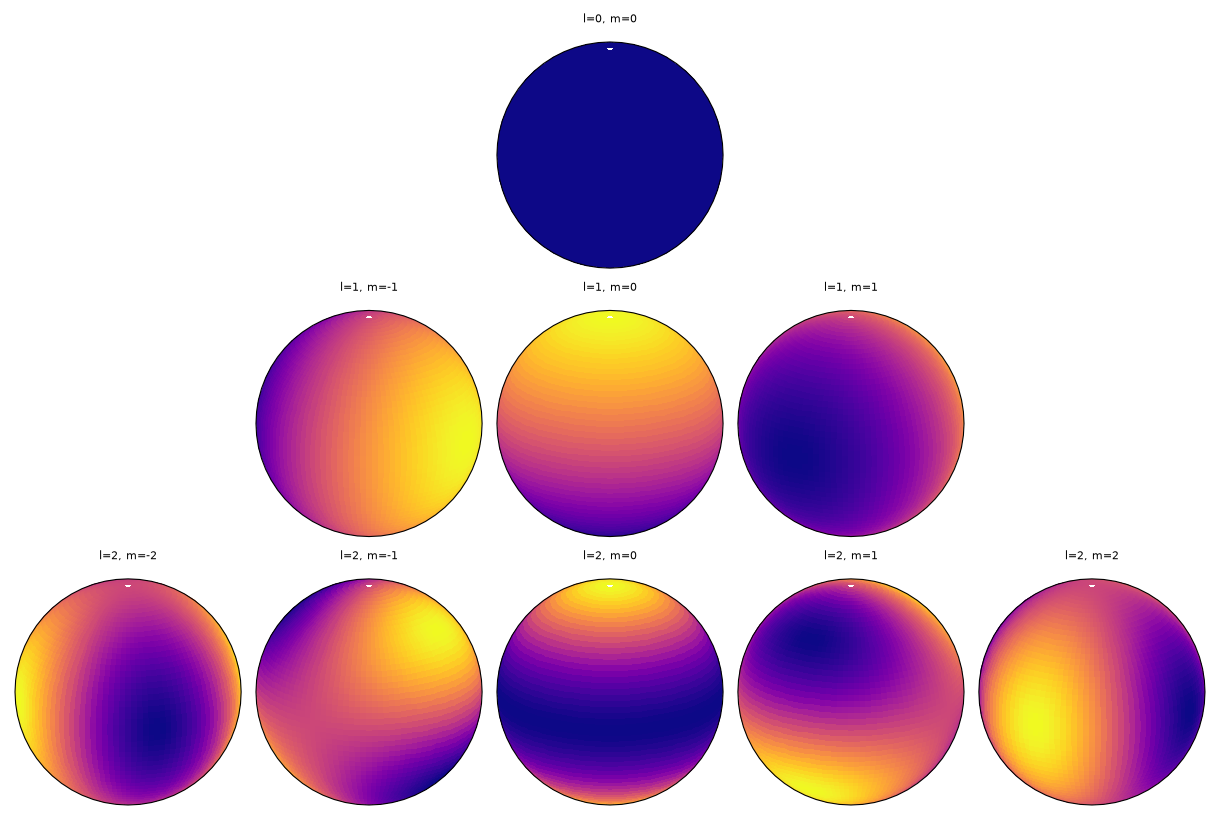
The real spherical harmonics \(Y_l^m(\theta, \varphi)\) form an orthonormal basis on the sphere. This notebook constructs and plots them by applying the inverse SHT to unit basis vectors in spectral space.
Setup#
import torch
import matplotlib.pyplot as plt

from torch_harmonics import RealSHT, InverseRealSHT
from torch_harmonics.plotting import plot_sphere
Forming the Vandermonde matrix#
The Vandermonde matrix maps spectral coefficients to grid values. Each column corresponds to a single spherical harmonic \(Y_l^m\). We construct it by applying the ISHT to each canonical basis vector \(e_{l,m}\) in the coefficient space.
For negative orders \(m < 0\), the real spherical harmonics are recovered by placing the basis vector in the imaginary part of the \(|m|\) coefficient.
nlat = 60
nlon = 2*nlat
lmax = mmax = nlat

sht = RealSHT(nlat, nlon, lmax=lmax, mmax=mmax)
isht = InverseRealSHT(nlat, nlon, lmax=lmax, mmax=mmax)
# forming the Vandermonde matrix

nmodes = int(lmax * lmax)
e = torch.zeros(nmodes, lmax, mmax, dtype=torch.complex64)

midx = lambda l,m : l*(l+1) + m

for l in range(lmax):
    for m in range(-l, l+1):
        e[midx(l,m), l, abs(m)] = 1.0 if m >= 0 else 1.0j

vdm = isht(e)
Plotting the spherical harmonics#
We plot the first few spherical harmonics on a grid indexed by degree \(l\) (rows) and order \(m\) (columns). Each subplot shows an orthographic projection of the sphere:
import os
os.makedirs("plots", exist_ok=True)

plt_lmax = 3

fig = plt.figure(layout='constrained', figsize=(12, 8))
subfigs = fig.subfigures(plt_lmax, 2*plt_lmax-1)

for l in range(plt_lmax):
    for m in range(-l, l+1):
        plot_sphere(vdm[midx(l,m)], fig=subfigs[l, m+plt_lmax-1], projection="orthographic", title=f"l={l}, m={m}", central_latitude=20, central_longitude=30, cmap="plasma")

plt.savefig("./plots/spherical_harmonics.png")
Animated version (optional)#
The following cells generate a rotating animation of the spherical harmonics. Uncomment to run:
# import matplotlib.animation as animation

# fig = plt.figure(layout='constrained', figsize=(12, 8), dpi=72)
# subfigs = fig.subfigures(plt_lmax, plt_lmax)

# moviewriter = animation.writers['pillow'](fps=30)
# moviewriter.setup(fig, './plots/spherical_harmonics.gif', dpi=72)
# for frame in range(120):
#     # compute the rotation of the sphere
#     lon = -120 - 3 * frame

#     if frame % 10 == 0:
#         print(f"frame={frame}")

#     for l in range(plt_lmax):
#         for m in range(l+1):
#             plot_sphere(vdm[midx(l,m)], fig=subfigs[l, m], projection="orthographic", title=f"l={l}, m={m}", central_longitude=lon)

#     plt.draw()
#     moviewriter.grab_frame()

# moviewriter.finish()